Abstract
Objective –
Assess the link between bone marrow blood vessel ossification, trabecular and cortical bone, and hematological parameters across the lifespan in rats.
Methods –
Right femora and whole blood samples were taken from male Fischer-344 rats at 1-month, 6-months, 12-months, 18-months and 24-months. Femora were scanned by MicroCT to determine bone marrow blood vessel ossification (i.e., ossified vessel volume, ossified vessel thickness, ossified vessel density, and SMI). Bone microarchitecture (i.e., bone volume, trabecular thickness, trabecular number, and trabecular separation), density and SMI, and cortical bone parameters (i.e., cortical shell thickness, porosity and density) were also determined by MicroCT. Complete blood counts with differentials were conducted.
Results –
Ossified vessel volume increased throughout the lifespan, coinciding with reduced trabecular bone volume and cortical shell thickness at 24-months. Many of the hematological parameters were unchanged (i.e., WBC, LY#) or increased (MO#, MO%, GR#, GR%, Hgb, Hct, MCHC, RDW, Plt, MPV) with advancing age; however, RBC and LY% were reduced at 24-months. In addition, ossified vessel density was similar to trabecular bone density.
Conclusions –
Declines in trabecular bone volume, cortical shell thickness, RBC and LY% with advanced age coincided with augmented ossification of bone marrow blood vessels.
Keywords: bone marrow blood vessel ossification, hematological parameters bone volume, cortical shell thickness
INTRODUCTION
Billions of cells are produced by the bone marrow each day (1), as bone marrow is a primary site for hematopoiesis (2). Osteoclasts (3) and all blood cell lineages (4,5) are produced by hematopoietic stem cells, and mesenchymal stem cells residing in the bone marrow differentiate into various cell types (e.g., osteoblasts, adipocytes, chondrocytes, cardiomyocytes and endothelial cells) (4–7). Thus, bone marrow is instrumental for immune cell production (8) by the generation of precursor cells for innate and adaptive immunity (2) and organismal vitality is dependent upon an optimal functioning of the bone marrow microenvironment.
Advancing age has profound influences on bone and bone marrow health and can drastically influence physiological systems reliant upon the bone marrow. Humans experience an ~10% decline in bone marrow cellularity during each decade of life, such that the composition of bone marrow transitions from hematopoietic to progressively adipocytic (9). One consequence of this transition results in immunosenescence, defined as diminished immune function with advancing age (2). Immunosenescence may enhance the severity and susceptibility to infection (10) and increase the risk of disease (11). Bone is also affected by advancing age and the most common effect of senescence is the loss of mass, resulting in increased risk of fracture in elderly individuals. Bone turnover rates are highest near hematopoietic marrow (12,13). Thus, age-related declines in hematopoiesis coincide with diminish perfusion to the bone marrow and trabecular bone (14).
While many factors contribute to the loss of hematopoiesis, immunosenescence, and bone loss with advancing age, few studies have examined the role of bone blood vessels in these pathologies. Bone marrow function is reliant upon an intact microvascular system (15). The vascular system in bone and marrow consists of afferent, exchange and efferent vessels. In addition to serving the needs of bone and marrow via the delivery of oxygen and nutrients and the removal of waste products, the bone vascular network participates in other critical functions. For example, blood vessels are requisite for bone development and repair (16,17), bone homeostasis (18,19) and, via filtration, allow for bone adaptation to mechanical loading (20). Furthermore, hematopoietic stem cells are kept in quiescence along the endosteal surfaces of bone and at perivascular spaces next to sinusoids (21). Further, the egress of mature bone marrow cells rely upon sinusoids and the central sinus to gain access to the peripheral circulation (22) and hematopoietic stem cells home to bone marrow and to other organs via the bone sinusoidal network (1,23).
Recently, we demonstrated ossification of bone marrow blood vessels in both rodent and human long bones (24). In other words, bone marrow blood vessels demonstrate the capacity to convert into bone tissue, by evidence of histological staining and the presence of osteoid seams and osteocyte lacunae on their abluminal surfaces (24). We theorized that this vascular pathology is inexorably linked with the previously identified age-related alterations (e.g., reduced blood flow, vascular rarefaction, and diminished mass) in bone and bone marrow (14,24–26). Progressive ossification of bone marrow blood vessels leads to “microvascular dead space”; i.e., the loss of vessel patency and control of tissue perfusion via vasodilator and/or vasoconstrictor mechanisms (24). In addition, the opening and closing of bone marrow sinusoids permit a constant flux of cells from the marrow into the peripheral circulation (1). Progressive ossification of sinusoids with advancing age would presumably prohibit the opening and closing of these vessels, limiting egress of blood cells.
In this study, we hypothesized that bone marrow blood vessel ossification 1) begins at an earlier age (i.e., <4 months) than previously reported (24) and that increased ossification with advancing age 2) corresponds with age-related bone loss, and 3) reduced presence of blood cells in the peripheral circulation.
MATERIALS AND METHODS
All procedures were approved and carried out in accordance with the University of Delaware and University of Texas at Arlington’s Institutional Animal Care and Use Committee and conform to the Guide for the Care and Use of Laboratory Animals published by the National Institutes of Health (NIH Publication No. 85–23, revised 1996). Fifty-six male Fischer-344 rats (1-month, n=9–11; 6-months, n=9–10, 12-months, n=10–12; 18-months, n=9–11; 24-months, n=11–12) were doubly housed in standard cages in a temperature (23±2°C) and light (12:12h light/dark) controlled room. Male rats were chosen to further characterize this pathology and extend upon previous findings (24). Tap water and regular rat chow were given ab libitum. The rats were anesthetized (isoflurane 3% to oxygen balance) and weighed to determine body mass. The thoracic cavity was opened and left ventricular whole blood samples were collected via vacutainer. The animals were subsequently euthanized by removal of the heart. The right femur was collected and stored in 70% EtOH until further processing.
MicroCT
The entire right femur was scanned ex vivo at high–resolution (18.5 μm) with a Scanco MicroCT 35 (Scanco Medical AG, Wayne PA) at 55 kVP and acquired. Trabecular bone microarchitecture (i.e., BV/TV [%], Tb.Th [μm], Tb.N [/mm] and Tb.Sp [μm]), trabecular bone density (mg/cm3) and SMI (in arbitrary units [AU]) were determined from 76 slices in the IISP of the distal femoral metaphysis. Trabecular BV/TV allows for the assessment of bone mass, Tb.Th and Tb.N assess the thickness and number of individual trabeculae, respectively, and Tb.Sp analyzes the distance between individual trabeculae. Alterations in Tb.Th, Tb.N and Tb.Sp often reflect changes in BV/TV. For example, increases in Tb.Th and Tb.N often coincide with augmented BV/TV and vice versa. The SMI provides a shape descriptor for the sample of interest; i.e., values closer to 0 indicate plate-like structures vs. values closer to 4 which indicate rod-like structures. Mature trabecular bone typically has SMI values representing plate-like structures. The following cortical bone parameters were determined from 30 slices at the femoral mid-shaft: Ct.BV/TV (%), cortical shell thickness (μm), and cortical bone density (mg/cm3). Cortical porosity was calculated with the following equation: 1 – Ct.BV/TV. Cortical thickness and porosity examine whether or not the cortical shell becomes thinner and/or more porous with advancing age. OsVV (%; i.e., the volume of ossified bone marrow blood vessels) was determined by analyzing the marrow space of the entire femoral shaft, excluding the IISP of the proximal and distal metaphyses and the cortical shell. OsV.Th (μm), ossified vessel density (mg/cm3) and ossified vessel SMI (AU) were also determined.
Microscopy
Bone marrow blood vessels were isolated from the left femoral shafts and imaged via microscopy. To isolate the vessels, the distal end of the femur was removed with a Dremel Saw-Max™. The femur was spun at low-speed in a mini centrifuge, displacing the bone marrow into an eppendorf tube containing PBS as previously described (27). Bone marrow blood vessels were isolated from the marrow utilizing a stereomicroscope and microsurgical forceps. Normal bone marrow blood vessels were pressurized to 22 mmHg and both normal and ossified bone marrow blood vessels were imaged with light microscopy.
Additionally, ossified bone marrow blood vessels were fixed for 24–48 hours at 4°C in a 0.1M cacodylate buffer containing 2% gluteraldehyde and 2% paraformaldehyde. Samples were subsequently stained with 1% osmium tetroxide, dehydrated in increasing concentrations of EtOH (i.e., 25% - 100%), dried in a critical point dryer (Tousimis Autosamdri®−815 Series A), and mounted on SEM stubs with silver colloid paint. Prior to viewing in the SEM, samples were sputter coated (Leica ACE600) with platinum.
Imaging of Bone Marrow Blood Vessels via SEM
Ossified bone marrow blood vessels were imaged on a field emission scanning electron microscope (Hitachi S-4700) with a beam current between 10–15 μA and an accelerating voltage of three. Ossified vessels were imaged with ultra-high resolution and at magnifications of 4,000x and 20,000x.
Complete Blood Counts
Complete blood counts of the whole blood samples were determined with a Coulter ® Ac•T diffTM Analyzer (Beckman Coulter, Brea, CA). The whole blood samples were analyzed for the following hematological parameters: WBC (x103/μl), LY# (x103/μl), MO# (x103/μl), GR# (x103/μl), LY%, MO%, GR% RBC (x106/μl), Hgb (g/dL), Hct (%), MCV (fL), MCH (pg), MCHC (g/dL), RDW (%), Plt (x103/μl) and MPV (fL).
Statistical Analysis
One-Way ANOVAs (SPSS Version 23, SPSS, Inc., Chicago, IL, USA) were used to determine statistical differences for all variables among age groups. Data are represented as mean ± S.E. Significance was defined a priori at p ≤ 0.05. Tendencies (p<0.10) for differences are also reported.
RESULTS
Body mass was the lowest (p<0.05) at 1-month (149±4g) vs. the other groups. Body mass was similar between 6-months (379±10g) and 24-months (401±13g) but differed (p<0.05) from the other groups. Body masses were similar between 12-months (443±11g) and 18-months (454±10g) but differed (p<0.05) from the other groups.
Light Microscopy Imaging of a Normal and Ossified Bone Marrow Blood Vessel
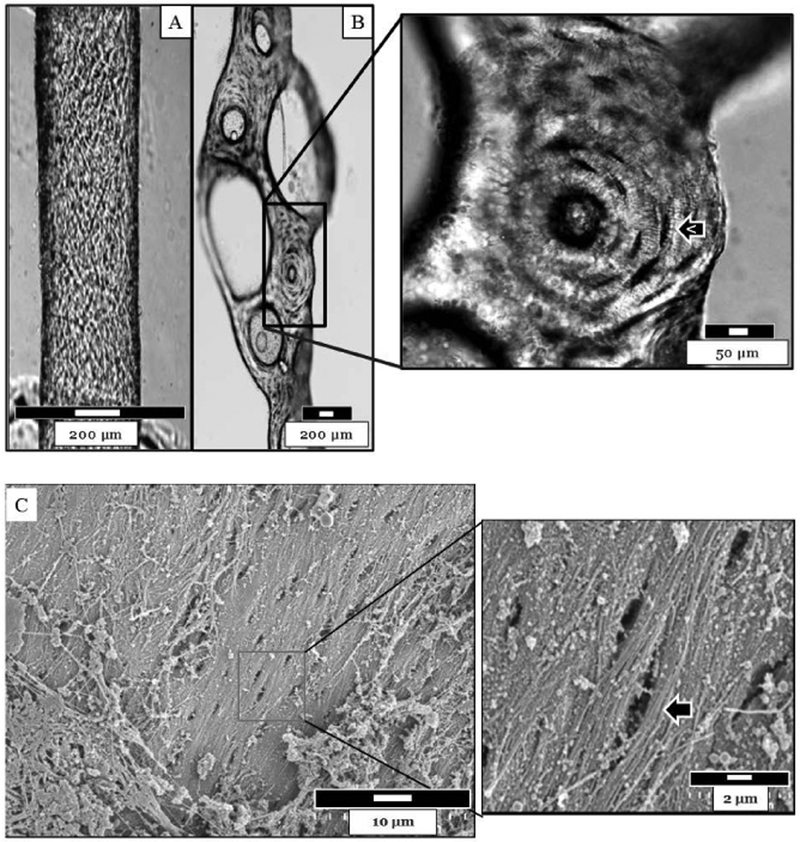
Figure 1 depicts a normal (A) and an ossified (B) bone marrow blood vessel isolated from the femoral shaft of a 6-month-old rat. These images highlight the marked differences between the two vessels. Note the presence of osteocyte lacunae on the abluminal surface of the ossified bone marrow blood vessel.
Figure 1.
A) A normal and B) an ossified bone marrow blood vessel isolated from a 6-month-old rat. The normal vessel was pressurized to 22 mmHg for imaging. Note the appearance of osteocytel lacunae on the abluminal surface of the ossified vessel. Images were acquired via light microscopy. C) The abluminal surface of an ossified bone marrow blood vessel from a 24-mon-old rat was imaged via SEM at 4,000x and 20,000x. Osteocyte lacunae (arrow) can be observed.
SEM of an Ossified Bone Marrow Blood Vessel
Figure 1C depicts the abluminal surface of an ossified bone marrow blood vessel isolated from a 24-month old rat and imaged via SEM. Osteocyte lacunae can be observed (Figure 1C).
MicroCT Analysis of OsVV in the Femoral Shaft
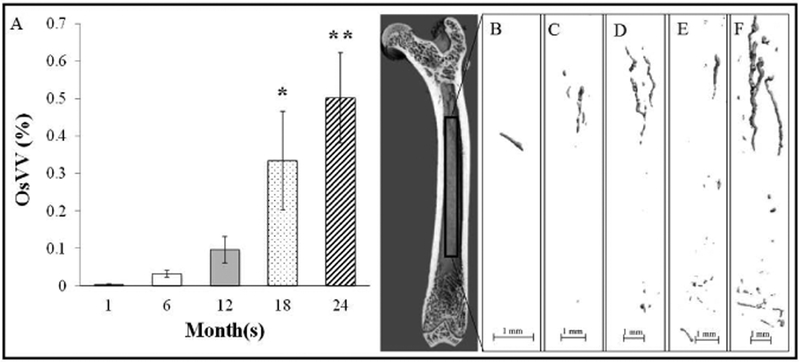
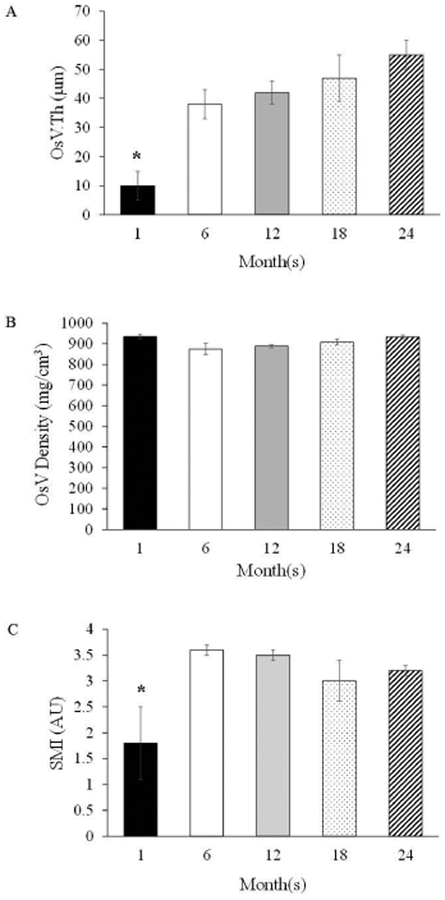
Ossified bone marrow blood vessels were observed in all age groups, including at 1-month. However, OsVV was enhanced (p<0.05) beginning at 18-months vs. 1-month and 6-months (Figure 2). Additionally, OsVV was higher (p<0.05) at 24-months vs. 1-months, 6-months and 12-months. The mean thickness of the ossified vessels ranged from 10–55 μm and was 117% to 138% thicker (p<0.05) at 6-months to 24-months vs. 1-month (Figure 3). Ossified vessel density did not differ among groups and ranged from 875 mg/cm3 to 925 mg/cm3 (Figure 3). The SMI for the ossified bone marrow blood vessels ranged from 1.8 to 3.6 (Figure 3), with a lower (p<0.05), plate-like SMI for 1-month vs. rod-like SMIs for the other age groups.
Figure 2.
A) Ossified vessel volume across the lifespan. B), C), D), E), and F) Representative MicroCT images of ossified bone marrow blood vessels at 1-month, 6-months, 12-months, 18-months and 24- months, respectively. Values represent Means ± S.E. *p<0.05 vs. 1-month and 6-months; **p<0.05 vs. 1- month, 6-months and 12-months. 1-month, n=9; 6-months, n=9; 12-months, n=10; 18-months, n=9; 24- months, n=11.
Figure 3.
Ossified Vessel Parameters: A) Ossified Vessel Thickness (OsV.Th), B) Ossified Vessel Density (OsV Density), and C) Structural Model Index (SMI). Values are Means ± S.E. *p<0.05 vs. all other age groups. AU denotes arbitrary units. 1-month, n=9; 6-months, n=9; 12-months, n=10; 18-months, n=9; 24-months, n=11.
Trabecular Bone
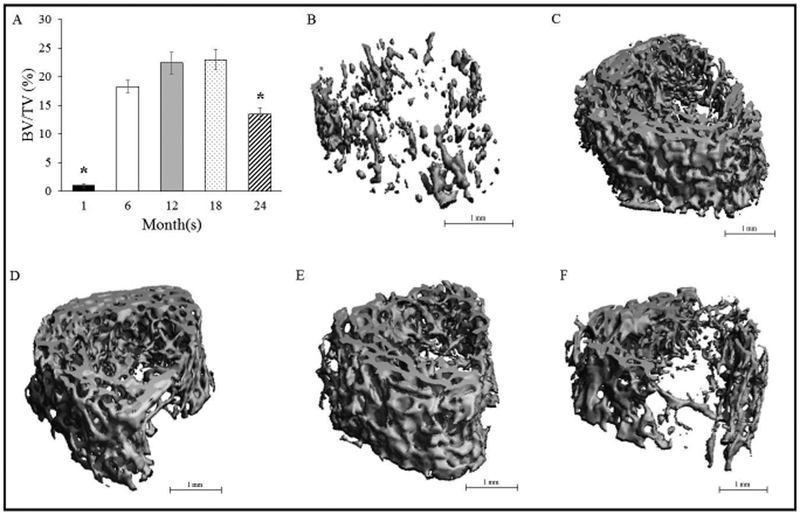
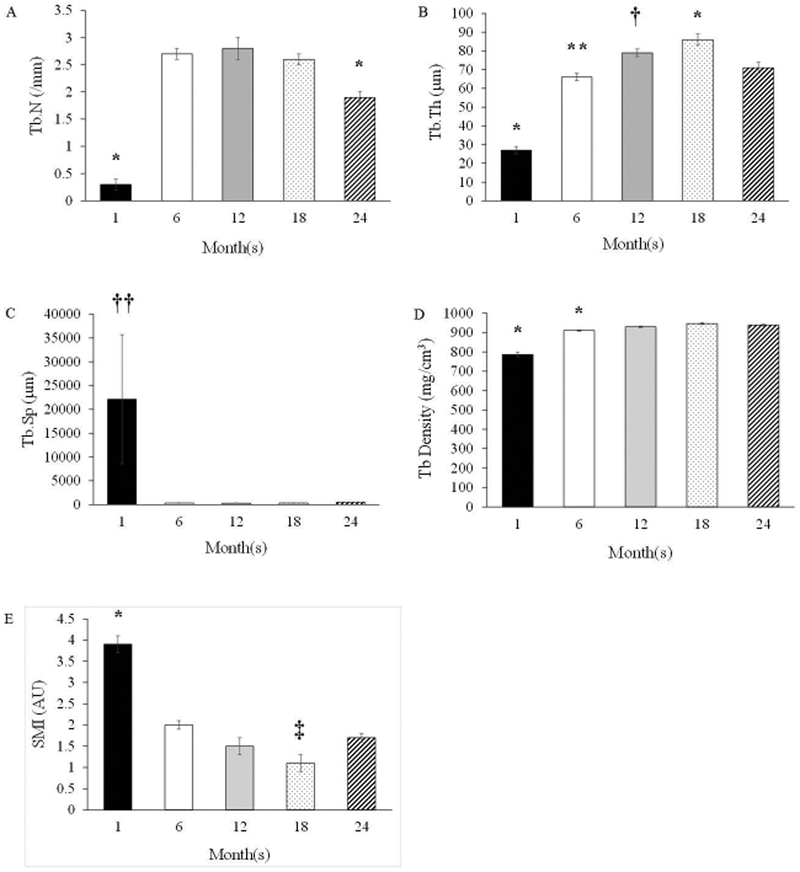
Trabecular BV/TV in the distal metaphysis increased (p<0.05) from 1-month to 6-months, where it plateaued until 18-months, and declined (p<0.05) at 24-months (Figure 4). The augmented BV/TV at 6-months, 12-months, and 18-months corresponded with a higher Tb.N vs. 1-month and 24-months (Figure 5). Further, Tb.Th increased (p<0.05) across the lifespan from 1-month to 18-months, but declined at 24-months (Figure 5). Trabeculae were thinnest (p<0.05) at 1-month (vs. all other groups) and thickest (p<0.05) at 18-months (vs. all other groups). Trabecular separation did not differ among age groups (Figure 5). Trabecular density was the lowest at 1-month (p<0.05 vs. the other age groups) and at 6-months (p<0.05 vs. the other age groups). Trabeculae were rod-like at 1 month and became increasing plate-like with advancing age (p<0.05; 1 month vs. all other groups). SMI also differed (p<0.05) between 18-months vs. 6-months and 24-months.
Figure 4.
A) Trabecular BV/TV in the distal metaphysis across the lifespan. B), C), D), E), and F) Representative MicroCT images of trabecular bone in the secondary spongiosa at 1-month, 6-months, 12- months, 18-months and 24-months, respectively. Values represent Means ± S.E. *p<0.05 vs. all other groups. 1-month, n=9; 6-months, n=9; 12-months, n=10; 18-months, n=9; 24-months, n=11.
Figure 5.
Trabecular Bone Microarchitectural Properties in the Secondary Spongiosa: A) Trabecular Number (Tb.N), B) Trabecular Thickness (Tb.Th), C) Trabecular Separation (Tb.Sp), D) Trabecular Density (Tb Density), and E) Structural Model Index (SMI). Values are Means ± S.E. *p<0.05 vs. all other age groups; **p<0.05 vs. 12-months; †p=0.06 vs. 24-months; ††p=0.06 vs. all other age groups. ‡p<0.05 vs. 6- months and 24-months. AU denotes arbitrary units. 1-month, n=9; 6-months, n=9; 12-months, n=10; 18- months, n=9; 24-months, n=11.
Cortical Bone
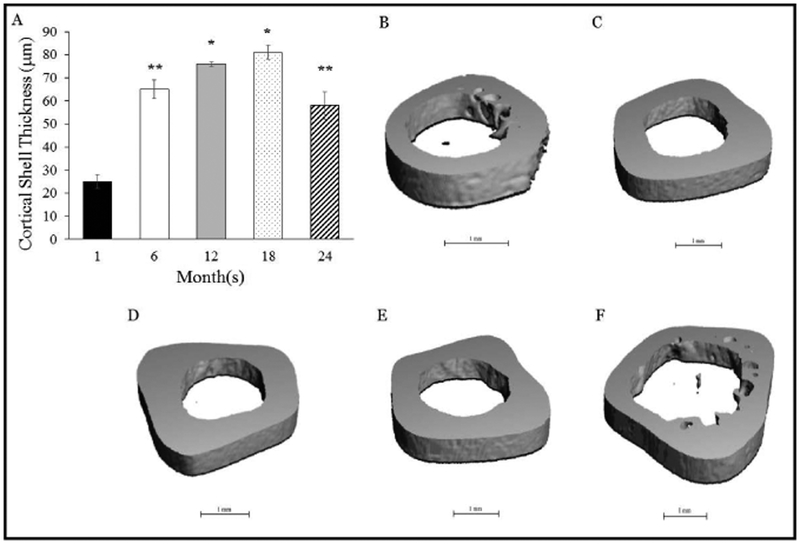
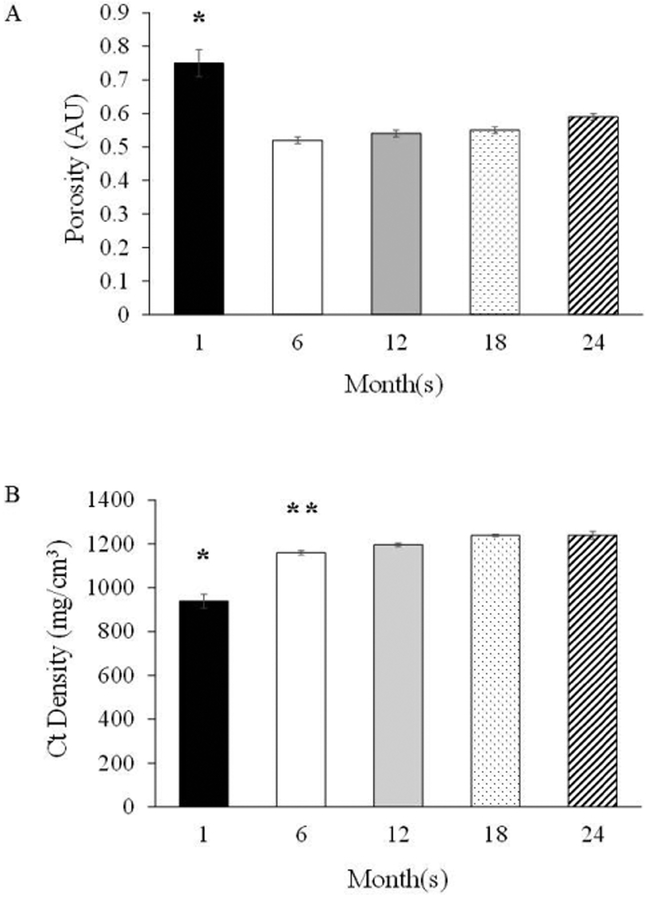
Cortical shell thickness was highest (p<0.05) at 12-months and 18-months vs. the other groups, and higher at 6-months and 24 months vs. 1 month (Figure 6). In addition, the porosity of the cortical shell was highest (p<0.05) at 1-month vs. the other groups (Figure 7), which corresponded with a lower (p<0.05) cortical density. Cortical density was highest (p<0.05) at 18-months and 24-months and differed (p<0.05) from 6-months (Figure 7).
Figure 6.
A) Cortical shell thickness across the lifespan. B), C), D), E), and F) Representative MicroCT images of the cortical shell thickness at the femoral mid-shaft at 1-month, 6-months, 12-months, 18- months and 24-months, respectively. Values represent Means ± S.E. *p<0.05 vs. 1-month, 6-months and 24-months; **p<0.05 vs. 1-month. 1-month, n=9; 6-months, n=9; 12-months, n=10; 18-months, n=9; 24-months, n=11.
Figure 7.
Cortical Bone Properties at the Femoral Mid-Shaft: A) Porosity and B) Cortical Density. Values are Means ± S.E. *p<0.05 vs. all other age groups; **p<0.05 vs. 18-months and 24-months; AU denotes arbitrary units. 1-month, n=9; 6-months, n=9; 12-months, n=10; 18-months, n=9; 24-months, n=11.
White Blood Cell Parameters
WBC and LY# were similar across the lifespan (Table 1). In contrast, MO# was lower (p<0.05) at 1-month vs. the other groups and lower (p<0.05) at 6-months vs. 12-months and 24-months. GR# was lower (p<0.05) at 1-month, 6-months and 12-months vs. 24-months, and lower at 1-month (p<0.05) vs. 18-months. In contrast, LY% declined across the lifespan, declining (p<0.05) at 24-months vs. 1-month, 6-months and 12-months, declining at 12-months and 18-months vs. 1-month and 6-months, and declining at 6-months vs. 1-month. Similarly, MO% was lower (p<0.05) at 1-month and 6-months vs. the other groups. Finally, GR% was higher (p<0.05) at 24-months vs. 1-month, 6-months and 12-months, higher (p<0.05) at 18-months vs. 1-month and 6-months, and higher (p<0.05) at 12-months vs. 1-month.
Table 1.
White Blood Cell Parameters.
| Group | WBC (x103/μL) | LY# (x103/μL) | MO# (x103/μL) | GR# (x103/μL) |
|---|---|---|---|---|
| 1-month | 2.7±0.3 | 2.4±0.2 | 0.19±0.03* | 0.20±0.04*** |
| 6-months | 3.3±0.4 | 2.9±0.3 | 0.30±0.03‡ | 0.40±0.05** |
| 12-months | 3.4±0.2 | 2.4±0.2 | 0.46±0.03 | 0.48±0.06** |
| 18-months | 3.6±0.8 | 2.5±0.8 | 0.40±0.04 | 0.65±0.11 |
| 24-months | 3.3±0.3 | 2.0±0.2 | 0.47±0.05 | 0.79±0.09 |
| Group | LY% | MO% | GR% |
|---|---|---|---|
| 1-month | 86.6±1.1* | 6.5±0.5*** | 6.9±1.1*** |
| 6-months | 79.6±2.0* | 8.4±0.5*** | 11.9±1.9†** |
| 12-months | 71.6±1.9** | 13.7±0.8 | 14.6±1.7** |
| 18-months | 65.8±4.0 | 13.4±1.5 | 20.7±3.8 |
| 24-months | 60.5±1.9 | 15.1±1.3 | 23.8±1.7 |
Values represent Means ± S.E.
p<0.05 vs. all other groups;
p<0.05 vs. 24-months;
p<0.05 vs. 12-months, 18-months and 24-months;
p<0.05 vs. 18-months;
p<0.05 vs. 12-month and 24-months. 1-month, n=11; 6-months, n=10; 12-months, n=12; 18-months, n=11; 24-months, n=12.
Red Blood Cell Parameters
RBC was the lowest at 1-month and differed (p<0.05) from all other ages (Table 2). In addition, RBC was lower (p<0.05) at 24-months vs. 12-months. Hgb was lowest (p<0.05) at 1-month vs. all of the other groups and Hct remained consistent across the lifespan. MCV and MCH were higher (p<0.05) at 1-month vs. 12-months and MCHC and RDW did not differ among groups.
Table 2.
Red Blood Cell Count and Red Blood Cell Indices.
| Group | RBC (x106/μL) | Hgb (g/dL) | Hct (%) |
|---|---|---|---|
| 1-month | 6.2±.01* | 12.0±0.3* | 36.0±0.8 |
| 6-months | 7.6±0.1 | 13.3±0.2 | 36.9±1.6 |
| 12-months | 8.0±0.1 | 14.0±0.2 | 38.0±3.8 |
| 18-months | 7.5±0.4 | 13.9±0.7 | 40.6±1.8 |
| 24-months | 7.0±0.4** | 13.9±0.4 | 40.5±1.0 |
| Group | MCV (fL) | MCH (pg) | MCHC (g/dL) | RDW (%) |
|---|---|---|---|---|
| 1-month | 58.0±0.9** | 19.3±0.2** | 33.4±0.5 | 14.3±1.3 |
| 6-months | 51.3±0.2 | 18.2±0.6 | 34.4±0.3 | 15.6±0.4 |
| 12-months | 47.0±4.7 | 17.0±0.1 | 30.2±3.0 | 15.9±0.4 |
| 18-months | 54.3±0.9 | 18.4±0.3 | 33.9±0.3 | 15.0±0.9 |
| 24-months | 53.5±0.3 | 18.3±0.2 | 34.0±0.4 | 14.5±0.5 |
Values represent Means ± S.E.
p<0.05 vs. all other groups;
p<0.05 vs. 12-months. 1-month, n=11; 6-months, n=10; 12-months, n=12; 18-months, n=11; 24-months, n=12.
Platelet Indices
The number of Plt were higher (p<0.05) at 1 month vs. all the other groups and MPV did not differ among groups (Table 3).
Table 3.
Platelets and Platelet Indices.
| Group | Plt (x103/μL) | MPV (fL) |
|---|---|---|
| 1-month | 849±25* | 5.8±0.3 |
| 6-months | 624±20 | 6.2±0.2 |
| 12-months | 618±22 | 7.0±0.8 |
| 18-months | 574±32 | 6.4±0.2 |
| 24-months | 586±29 | 6.3±0.3 |
Values represent Means ± S.E.
p<0.05 vs. all other groups. 1-month, n=11; 6-months, n=10; 12-months, n=12; 18-months, n=11; 24-months, n=12.
DISCUSSION
The major findings of this investigation are that the volume of ossified bone marrow blood vessels increased across the lifespan, becoming significantly augmented at 18 and 24 months of age. The increased ossification of the bone marrow vasculature corresponded with declines in trabecular bone volume, cortical shell thickness, RBC, and LY% at 24 months of age. Additionally, this investigation revealed that ossification initiates early in life (i.e., 1 month).
The trabecular, cortical and bone marrow compartments exist in a symbiotic relationship. Bone marrow contains a reservoir of cells that release factors capable of acting upon or that are utilized by osteoblasts, osteoclasts and osteocytes for maintaining the structural integrity of bone. The microcirculation of bone is critical for these symbiotic relationships, through its removal of waste products and delivery of nutrients, precursor cells and factors to local and distant remodeling sites. In addition, the bone microcirculation allows for egress and ingress of all blood cell lineages to and from the peripheral circulation (1). Thus, declines in vascular function with advancing age and/or disease compromises these relationships, potentially jeopardizing bone and bone marrow health, as well as overall health.
In regards to the bone microcirculation’s influence on bone and bone marrow health, several age-related physiological adaptations have been previously reported. For example, declines in endothelium-dependent vasodilation of the principal nutrient artery (14,26,28,29) (i.e., the primary conduit for blood flow to long bones (30)) coincided with diminished skeletal blood flow (14,26) and trabecular bone mass (14,26). Further, vascular rarefaction in bone has been demonstrated in old age (24,25), corresponding with increased bone marrow ischemia (31) and adiposity (24,25,32), and reduced patency of the bone marrow vasculature (24) and diminished hematopoiesis (25,32). Additionally, the direction of blood flow to long bones is reversed; i.e., transitioning from a centrifugal entry through the principal nutrient artery in youth to a centripetal entry through the periosteal arteriolar network in old age (30,33). The centripetal direction of blood flow in aged long bones represents abnormality (34) and may relate to the increased presence of bone marrow blood vessel ossification (24), serving to hamper or inhibit the passage of blood through the bone marrow vasculature (35).
Interestingly, bone marrow blood vessel ossification initiates early in life (i.e., 1-month). The ages of the rats in this investigation (i.e., 1-month, 6-months, 12-months, 18-months and 24-months) are approximately equivalent to the following human years, respectively: 8-years, 18-years, 30-years, 45-years and 60-years. While we reported the presence of ossified bone marrow blood vessels in long bones from elderly individuals (24), these current data in rats suggests that bone marrow blood vessel ossification commences in adolescence. Of a similar note, atherosclerosis (e.g., fatty streaks-lipid-engorged macrophages and T lymphocytes) have been demonstrated in the intimal layer of arteries in children (36), illustrating that the processes leading to vascular calcification are not reserved for adulthood. While bone marrow blood vessel ossification presumably shares similar etiologies with atherosclerosis and arteriosclerosis, we theorize that it represents a more severe form or accelerated pathology. Osteocyte lacunae (i.e., a characteristic of bone) were observed on the abluminal surfaces of these ossified vessels (Figure 1) and the density profiles were similar to that of trabecular bone. Further, ossified bone marrow blood vessels have SMI values similar to rod-like structures (i.e., blood vessels) as opposed to the plate-like SMI values of trabecular bone. Additionally, ossified bone marrow blood vessels stain extensively for calcium and bone, and have the presence of osteoid seams (i.e., newly formed but not yet mineralized bone) (24).
Bone marrow blood vessels progressively ossified across the lifespan, growing 280% thicker from 1 to 6 months of age (p<0.05) and increasing ~131% between each subsequent age group (i.e., from 12-months to 18-months to 24-months). Additionally, OsVV continued to enlarge throughout the lifespan, increasing by 967% (1-month to 6-months), 200% (6-months to 12-months), 248% (12-months to 18-months), and 503% (18-months to 24-months) between each subsequent age group, becoming significantly (p<0.05) different at 18-months and 24-month. Such an age-related progression of OsVV enlarges “microvascular dead space”; i.e., the loss of bone marrow blood vessel patency and vasomotor activity (24).
Unlike ossified bone marrow blood vessels, trabecular and cortical bone expressed developmental and growth patterns of a similar nature. For example, trabecular BV/TV was the lowest and less dense at 1-month, increased in volume by 160% at 6-months, remained plateaued until 18-months, and sharply declined by 28% at 24-months. Similarly, the cortical shell was the thinnest, more porous and less dense at 1-month and became thicker, less porous and denser by 6-months. Cortical shell thickness then experienced a period of expansion, becoming thicker at 12-months and 18-months, denser at 18-months, and thinner again at 24-months. Rodent bones experience a period of rapid bone growth for 6 months succeeding birth (37) and closure of the growth plate at 4 months of age (38). Thus, skeletal maturity in rodents occurs between 4–6 months of age. As can be observed from the present data, bone growth in terms of volume and thickness reaches a nadir in middle to late-middle age prior to experiencing a decline.
The developmental and growth similarities between trabecular and cortical bone reflect symbiosis. In other words, alterations in one compartment may lead to mirror alterations for another compartment. Given that the bone microcirculation is intimately involved in bone and bone marrow homoeostasis, pathologies within this system may alter the trabecular and cortical bone compartments as well. The directionality between bone marrow blood vessel ossification and bone volume and cortical shell thickness as a function of advancing age is worth noting. For example, the declines in trabecular BV/TV and cortical shell thickness at 24-months may be related and reflective of the increased OsVV at this stage of life, even though cause and effect cannot be established with the data presented in this manuscript. Coincidentally, declines in skeletal blood flow have been reported at 22–24-month vs. 4–6-month in male Fischer-344 rats (14,26). While present at 1-month and progressively increasing as a function of advancing age, OsVV in the femoral shaft became significantly augmented at times (i.e., 18-months and 24-months) when declines in blood flow to the femur are observed (i.e., 22–24 months of age) (14,26). While we can partially attribute these declines in bone blood flow to reduced endothelium-dependent vasodilator capacity of the principal nutrient artery (14,26,28) and vascular rarefaction (24), the role of bone marrow blood vessel ossification and how it presumably reduces blood vessel patency should be considered (24).
In terms of the whole organism, increased OsVV may manifest into diminished blood cells in the peripheral circulation. Approximately 500 billion cells are produced daily by the bone marrow and these cells gain access to the peripheral circulation via the bone marrow sinusoids (1). While hematopoiesis can occur at extra-medullary sites such as the liver, spleen and lymph nodes, production at these sites are considered pathological and less efficient (1). Ossification of bone marrow blood vessels may include the bone marrow sinusoids and a potential consequence would be the reduction of access routes for bone marrow cells to and from the peripheral circulation.
We examined the relationship between OsVV across the lifespan and the presence of blood cells in the peripheral circulation. Many of the hematological parameters (i.e., WBC, LY#, Hgb, Hct, MCV, MCH, MCHC, and RDW) did not decline from maturity (6-months) to advanced age (24-months); however, some were diminished. For example, LY% demonstrated a steady decline across the lifespan until 18-months, remaining depressed at 24-months. A lower LY% may be indicative of a reduction in the amount of bone marrow within the skeleton or a diminished capacity of the bone marrow to produce cells. Declines in bone marrow hematopoiesis have been documented in old age (25,32), coinciding with augmented bone marrow adiposity (24,25,32). Similarly, RBC reached a nadir at 12-months, but was depressed by 24-months. Senile anemia represents ~37% of the cases of anemia and have an unknown etiology (39,40).
While age-related declines in LY% and RBC are consistent with our hypothesis, it must be noted that other hematological parameters (e.g., MO#, GR#, MO% and GR%) were augmented from 6-months to 24-months. These findings were inconsistent with reported changes in MO% and GR% in male Fischer-344 rats from 12 to 30 months of age (41). We also concede that reduced peripheral blood counts have etiologies related to identifiable pathologies such as chronic disease, iron and vitamin B12 deficiency, etc. (42,43) that are not addressed herein. However, it is interesting to explore the relation between the bone marrow vasculature and the presence of blood cells in the peripheral circulation and suggest a potential link. Please note that the hematological parameters (i.e., Hgb, MCV, MCH and Plt) illustrating differences only at 1-month vs. the other age groups are attributed to physiological development and were not considered in this discussion. On a final note, to our knowledge this is the first paper reporting complete blood counts with differentials from 1-month to 24-months in male Fischer-344 rats. Thus, these data can serve as a reference for hematological parameters across the lifespan in this strain.
In conclusion, declines in trabecular bone volume and cortical shell thickness with advanced age coincided with augmented ossification of bone marrow blood vessels. In addition, RBC and LY% in the peripheral blood were diminished at this age. The role of the bone vasculature in the presence of blood cells in the peripheral circulation, particularly with advancing age or disease, should be explored further.
PERSPECTIVES.
The increasing presence of ossified bone marrow blood vessels across the lifespan corresponded with reduced trabecular bone volume, cortical shell thickness, RBC and LY% in aged rats. Thus, the loss of vascular supply through the non-patency of ossified bone marrow blood vessels may contribute to declines in bone mass and limit egress of blood cells into the peripheral circulation.
ACKNOWLEDGEMENTS
This study was support by the Delaware INBRE Grant from the National Institute of General Medical Sciences (P20 GM103446 – Project PI: Prisby).
A special thanks to Jean Ross and the Delaware Biotechnology Institute at the University of Delaware for her work on scanning electron microscopy.
A special thanks to Paula Melancon, BS, MT (ASCP) in the Department of Medical and Molecular Sciences at the University of Delaware for her performance of the complete blood counts.
Funding Sources: Delaware INBRE Grant from the National Institute of General Medical Sciences (P20 GM103446 – Project PI: Prisby).
List of Abbreviations
- EtOH
Ethanol
- MicroCT
Micro-Computed Tomography
- BV/TV
Bone volume to total volume ratio
- Tb.Th
Trabecular thickness
- Tb.N
Trabecular number
- Tb.Sp
Trabecular separation
- SMI
Structural model index
- IISP
Secondary spongiosa
- Ct.BV/TV
Cortical BV/TV
- OsVV
Ossified vessel volume
- OsV.Th
Ossified vessel thickness
- SEM
Scanning electron microscope
- WBC
White blood cells
- LY#
Lymphocyte number
- MO#
Monocyte number
- GR#
Granulocyte number
- LY%
Percent lymphocytes
- MO%
Percent monocyte
- GR%
Percent granulocyte
- RBC
Red blood cells
- Hgb
Hemoglobin
- Hct
Hematocrit
- MCV
Mean corpuscular volume
- MCH
Mean corpuscular hemoglobin
- MCHC
Mean corpuscular hemoglobin concentration
- RDW
Red blood cell distribution width
- Plt#
Platelet number
- MPV
Mean platelet volume
Footnotes
Conflicts of Interest
All authors have no conflicts of interest
REFERENCES
- 1.Fliedner T, Graessle D, Paulsen C, Reimers K. Structure and function of bone marrow hemopoiesis: mechanisms of response to ionizing radiation exposure. Cancer Biother Radiopharm. 2002;17(4):405–26. [DOI] [PubMed] [Google Scholar]
- 2.Pritz T, Weinberger B, Grubeck-Loebenstein B. The aging bone marrow and its impact on immune responses in old age. Immunol Lett. 2014;162(1 Pt B):310–5. [DOI] [PubMed] [Google Scholar]
- 3.Massey H, Flanagan AM. Human osteoclasts derive from CD14-positive monocytes. Br J Haematol. 1999;106(1):167–70. [DOI] [PubMed] [Google Scholar]
- 4.Beauséjour C Bone marrow-derived cells: the influence of aging and cellular senescence. Handb Exp Pharmacol. 2007;180:67–88. [DOI] [PubMed] [Google Scholar]
- 5.Pittenger M, Mackay AM, Beck SC, Jaiswal RK, Douglas R, Mosca JD, Moorman MA, Simonetti DW, Craig S, Marshak DR. Multilineage potential of adult human mesenchymal stem cells. Science. 1999;284(5411):143–47. [DOI] [PubMed] [Google Scholar]
- 6.Wakitani S, Saito T, Caplan AI. Myogenic cells derived from rat bone marrow mesenchymal stem cells exposed to 5-azacytidine. Muscle Nerve. 1995;18(12):1417–26. [DOI] [PubMed] [Google Scholar]
- 7.Valarmathi M, Yost MJ, Goodwin RL, Potts JD. A three-dimensional tubular scaffold that modulates the osteogenic and vasculogenic differentiation of rat bone marrow stromal cells. Tissue Eng Part A. 2008;14(4):491–504. [DOI] [PubMed] [Google Scholar]
- 8.Goldsby RA, Kindt TJ, Osborne BA. Immunology. 4th ed. New York: W.H. Freeman and Company; 2000. 670 p. [Google Scholar]
- 9.Compston JE. Bone marrow and bone: a functional unit. J Endocrinol. 2002;173(3):387–94. [DOI] [PubMed] [Google Scholar]
- 10.Boraschi D, Aguado MT, Dutel C, Goronzy J, Louis J, Grubeck-Loebenstein B, Rappuoli R, Del Giudice G. The gracefully aging immune system. Sci Transl Med. 2013;5(185):185ps8. [DOI] [PubMed] [Google Scholar]
- 11.Pawelec G, Lustgarten J, Ruby C, Gravekamp C. Impact of aging on cancer immunity and immunotherapy. Cancer Immunol Immunother. 2009;58(12):1907–8. [DOI] [PMC free article] [PubMed] [Google Scholar]
- 12.Jee W Integrated bone tissue physiology: anatomy and physiology In: Cowin S, editor. Bone Mechanics Handbook. Boca Raton: CRC Press; 2001. p. 1–1–1–34. [Google Scholar]
- 13.Jee W The skeletal tissues In: Weiss L, editor. Cell and Tissue Biology, A Textbook of Histology. Baltimore: Urban and Schwarzenberg; 1988. p. chap. 7. [Google Scholar]
- 14.Prisby RD, Ramsey MW, Behnke BJ, Dominguez JM, Donato AJ, Allen MR, Delp MD. Aging reduces skeletal blood flow, endothelium-dependent vasodilation and nitric oxide bioavailability in rats. J Bone Miner Res. 2007;22:1280–8. [DOI] [PubMed] [Google Scholar]
- 15.Füreder W, Krauth MT, Sperr WR, Sonneck K, Simonitsch-Klupp I, Müllauer L, Willmann M, Horny HP, Valent P. Evaluation of angiogenesis and vascular endothelial growth factor expression in the bone marrow of patients with aplastic anemia. Am J Pathol. 2006;168(1):123–30. [DOI] [PMC free article] [PubMed] [Google Scholar]
- 16.Gerber H-P, Vu TH, Ryan AM, Kowalski J, Werb Z, Ferrara N. VEGF couples hypertrophic cartilage remodeling, ossification and angiogenesis during endochondral bone formation. Medicine. 1999;5:623–8. [DOI] [PubMed] [Google Scholar]
- 17.Li G, Simpson AH, Kenwright J, Triffitt JT. Effect of lengthening rate on angiogenesis during distraction osteogenesis. J Orthop Res. 1999;17(3):362–67. [DOI] [PubMed] [Google Scholar]
- 18.Parfitt A Osteonal and hemi-osteonal remodeling: the spatial and temporal framework for signal traffic in adult human bone. J Cell Biochem. 1994;55:273–86. [DOI] [PubMed] [Google Scholar]
- 19.Parfitt AM. Mini-review: Osteoclast precursors as leukocytes: Importance of the area code. Bone. 1998;23(6):491–4. [DOI] [PubMed] [Google Scholar]
- 20.Prisby R The clinical relevance of the bone vascular system: Age-related implications. Clin Rev Bone Miner Metab. 2019. [Google Scholar]
- 21.Nakamura Y, Arai F, Iwasaki H, Hosokawa K, Kobayashi I, Gomei Y, Matsumoto Y, Yoshihara H, Suda T. Isolation and characterization of endosteal niche cell populations that regulate hematopoietic stem cells. Blood. 2010;116(9):1422–32. [DOI] [PubMed] [Google Scholar]
- 22.Mazo I, von Andrian UA. Adhesion and homing of blood-borne cells in bone marrow microvessels. Journal of Leukocyte Biology. 1999;66:25–32. [DOI] [PubMed] [Google Scholar]
- 23.Lapidot T, Dar A, Kollet O. How do stem cells find their way home? Blood. 2005;106(6):1901–10. [DOI] [PubMed] [Google Scholar]
- 24.Prisby R Bone marrow blood vessel ossification and “microvascular dead space” in rat and human long bone. Bone. 2014;64:195–203. [DOI] [PMC free article] [PubMed] [Google Scholar]
- 25.Burkhardt R, Kettner G, Bohm W, Schmidmeier M, Schlag R, Frisch B, Mallmann B, Eisenmenger W, Gilg T. Changes in trabecular bone, hematopoiesis and bone-marrow vessels in aplastic-anemia, primary osteoporosis, and old-age: a comparative histomorphometric study. Bone. 1987;8:157–64. [DOI] [PubMed] [Google Scholar]
- 26.Dominguez JM, Prisby RD, Muller-Delp JM, Allen MR, Delp MD. Increased nitric oxide-mediated vasodilation of bone resistance arteries is associated with increased trabecular bone volume after endurance training in rats. Bone. 2010;46(3):813–19. [DOI] [PMC free article] [PubMed] [Google Scholar]
- 27.Lee S, Bice A, Hood B, Ruiz J, Kim J, Prisby RD. Intermittent PTH 1–34 administration improves the marrow microenvironment and endothelium-dependent vasodilation in bone arteries of aged rats. J Appl Physiol. 2018;124(6):1426–37. [DOI] [PMC free article] [PubMed] [Google Scholar]
- 28.Prisby RD, Muller-Delp J, Delp MD, Nurkiewicz TR. Age, gender and hormonal status modulate the vascular toxicity of the diesel exhaust extract phenanthraquinone. J Toxicol Environ Health A. 2008;71(7):464–70. [DOI] [PubMed] [Google Scholar]
- 29.Prisby RD, Dominguez JM 2nd, Muller-Delp J, Allen MR, Delp MD. Aging and estrogen status: a possible endothelium-dependent vascular coupling mechanism in bone remodeling. PLoS One. 2012;7(11):e48564. doi: 10.1371/journal.pone.0048564. [DOI] [PMC free article] [PubMed] [Google Scholar]
- 30.Brookes M, Revell WJ. Blood Supply of Bone: Scientific Aspects. London, Great Britain: Springer-Verlag; 1998. [Google Scholar]
- 31.Bridgeman G, Brookes M. Blood supply to the human femoral diaphysis in youth and senescence. J Anat. 1996;188(Pt 3):611–21. [PMC free article] [PubMed] [Google Scholar]
- 32.Kita K, Kawai K, Hirohata K. Changes in bone marrow blood flow with aging. J Orthop Res. 1987;5(4):569–75. [DOI] [PubMed] [Google Scholar]
- 33.Thompson B, Towler DA. Arterial calcification and bone physiology: role of the bone-vascular axis. Nat Rev Endocrinol. 2012;8(9):529–43. [DOI] [PMC free article] [PubMed] [Google Scholar]
- 34.Brookes M La circulation osseuse normale and pathologique In: Arlet J, Ficat P, editor. Circulation Osseuse. Paris: INSERM; 1973. p. 3–13. [Google Scholar]
- 35.Mechanical Prisby R., hormonal and metabolic influences on blood vessels, blood flow and bone. J Endocrinol. 2017;235(3):R77–R100. [DOI] [PMC free article] [PubMed] [Google Scholar]
- 36.Hong Y Atherosclerotic cardiovascular disease beginning in childhood. Korean Circ J. 2010;40(1):1–9. [DOI] [PMC free article] [PubMed] [Google Scholar]
- 37.Turner R, Maran A, Lotinun S, Hefferan T, Evans GL, Zhang M, Sibonga JD. Animal Models For Osteoporosis. Reviews in Endocrine and Metabolic Disorders. 2001;2(1):117–27. [DOI] [PubMed] [Google Scholar]
- 38.Joss E, Sobel EH, Zuppinger KA. Skeletal maturation in rats with special reference to order and tme of epiphysical closure. Endocrinology. 1963;72:117–22. [DOI] [PubMed] [Google Scholar]
- 39.Mahlknecht U, Kaiser S. Age-related changes in peripheral blood counts in humans. Exp Ther Med. 2010;1(6):1019–25. [DOI] [PMC free article] [PubMed] [Google Scholar]
- 40.Ohta M Management of anemia in the elderly. JMAJ. 2009;52(4):219–23. [Google Scholar]
- 41.Smith D, Bronson R. Clinical chemistry and hematology profiles of the aging rat. Lab Animal. 1992;21:32–45. [Google Scholar]
- 42.Balducci L Epidemiology of anemia in the elderly: information on diagnostic evaluation. J Am Geriatr Soc. 2003;51(3 Suppl):S2–S9. [DOI] [PubMed] [Google Scholar]
- 43.Anemia Gabrilove J. and the elderly: clinical considerations. Best Pract Res Clin Haematol. 2005;3(3):417–22. [DOI] [PubMed] [Google Scholar]


