

Abstract
BACKGROUND:
A large body of research has investigated the effects of pro-atherogenic lipid profile on cardiovascular diseases (CVD) in peritoneal dialysis (PD) patients. However, there is a general lack of research on the association between atherogenic dyslipidemia and PD technique survival.
AIM:
The study aimed to define the association between dyslipidemia and PD technique survival.
METHODS:
It was a prospective single-centre observational study involving 40 outpatients on continuous ambulatory PD treatment for more than 3 months between 2010 and 2016 in a single centre in Ukraine. There were 27 males and 13 females. The mean age of the participants was 49.3 ± 12.2 years. The primary outcome measures were all-cause technique failure.
RESULTS:
Atherogenic dyslipidemia was identified in 28/40 (70 %) patients and correlated with PD adequacy parameters. During the 36-month- follow-up period technique failure occurred in 2/12 (16.6 %) patients with atherogenic dyslipidemia compared with 12 / 28 (42.9 %) patients without atherogenic dyslipidemia (χ2 = 2.5; p = 0.12). In the univariate Cox regression model, atherogenic dyslipidemia at baseline was significantly associated with a higher risk of all-cause PD technique failure (HR 4.5; 95% CI 1.6 to 12.9; χ2 = 5.5, p = 0.019).
CONCLUSION:
The presence of atherogenic dyslipidemia was significantly associated with a higher risk of technique failure in PD patients. This is an important issue for future research. Further well-designed clinical trials are needed to determine the impact of dyslipidemia on PD adequacy and technique survival.
Keywords: Peritoneal dialysis, Atherogenic dyslipidemia, Technique failure, Technique survival, PD adequacy
Introduction
End-stage renal disease (ESRD) is a worldwide public health problem. The number of patients diagnosed with ESRD continues to increase considerably from year to year [1], [2]. Peritoneal dialysis (PD) is a well-established treatment modality for ESRD patients. Currently, in Ukraine, approximately 12 % of ESRD patients are maintained on PD [3]. Although Ukrainian government and healthcare providers continue to focus on increasing incident PD use, less attention is focused on the effect of time spent on PD therapy and financial resources associated with the development of PD technique failure. Also, despite the significant progress in technique survival, the duration of PD therapy is still limited [4], [5].
There are several factors affecting PD technique survival: age, the presence of diabetes, residual renal function (RRF), glucose degradation products, peritonitis, chronic inflammation, cardiovascular diseases (CVD) [5], [6]. Previous studies have demonstrated a higher risk of mortality 2 years after PD treatment compared to the hemodialysis (HD) population [7], [8], [9], [10]. CVD due to the traditional and non-traditional risk factors are the most common causes of death in PD patients [9], [11].
Dyslipidemia is a traditional risk factor of cardiovascular events in the general population and the HD population [12], [13], [14]. High total cholesterol (TC), high levels of low-density lipoprotein cholesterol (LDL), very low-density lipoprotein cholesterol (VLDL), triglyceride and low level of high-density lipoprotein cholesterol (HDL) are all well-known risk factors of developing CVD [13], [14]. It has been suggested that patients on PD have differences in the lipid profile compared with patients on HD. The lipid profile in PD patients is more atherogenic with more altered dyslipidemia when compared with those in HD patients. This condition may be associated with glucose absorption from the peritoneal dialysate, peritoneal protein loss and a decrease in residual renal function (RRF) [11], [12], [15]. Also, PD treatment leads to body weight gain, and it can also be a potential risk factor for accelerated atherosclerosis [16], [17], [18].
A large body of research has investigated the effects of pro-atherogenic lipid profile on CVD in PD patients [11], [12], [19], [20]. However, in reviewing the literature, no data was found on the association between atherogenic dyslipidemia and PD technique survival and other clinical outcomes including parameters of dialysis adequacy in PD patients. It is still not clear whether dyslipidemia is associated with PD technique survival. We hypothesised that if all factors mentioned above associated with dyslipidemia in PD patients were the predictors of loss of peritoneal function, then dyslipidemia itself could not be associated with PD technique survival.
Therefore, we initiated this prospective observational study to determine whether dyslipidemia was associated with PD technique failure.
Patients and Methods
Study Design and Subjects
The prospective single-centre observational study was carried out between January 2010 and September 2016 at State Institution “Institute of Nephrology of the National Academy of Medical Sciences of Ukraine” in Kyiv, Ukraine. The study was conducted following the Declaration of Helsinki. The study protocol was confirmed by the Ethics Committee of the Institute, and all patients provided their written informed consent to participate in the study. Informed consent was obtained from all subjects participating in the study.
Forty outpatients with ESRD on PD (27 males, 13 females) were included in the study. All patients were treated with continuous ambulatory PD (CAPD) for more than 3 months. They were observed to determine the impact of atherogenic lipid profile on PD technique survival during the 36-month- follow-up period.
All recruited PD patients received 4 exchanges daily. The diabetics and the patients with a history of peritonitis or significant illness/hospitalisation were excluded in the previous 3 months.
Methods
Patient demographics data including age, gender, comorbid conditions, hypertension and dyslipidemia were obtained from medical records.
Whole blood samples were collected from the patients after an overnight fast during a routine outpatient visit. The blood samples were processed immediately after sampling.
Routine biochemical parameters including blood and daily dialysate concentration of urea and creatinine, serum albumin, C-reactive protein (CRP), glucose, electrolytes and lipid profile were carried out using a Flexor Junior Chemistry Analyzer (Vital Scientific, Dieren, Netherlands). Blood lipid profile parameters included triglyceride (TG), TC, HDL, LDL and VLDL. Atherogenic index of plasma (AIP) was calculated from plasma triglyceride and HDL (log [TG / HDL]). Body mass index (BMI) was calculated as weight in kilograms divided by the square of the height in meters.
Haematological parameters of blood were determined using an ABX Micros-60 (ABX Diagnostics, Montpelier, France).
The adequacy of dialysis was determined by measuring the total weekly creatinine clearance (CrCl) (it was normalized to 1.73 m2 of the body surface area) and total weekly urea clearance (Kt / V) using the Watson formula for calculatingbody water [21]. Peritoneal Kt / V, plasma and renal Kt / V were calculated separately. The dialysate/plasma creatinine ratio (D / P) was calculated from the concentrations of creatinine in 24-h dialysate and plasma [22].
Statistical analysis
The statistical analysis and all graphs were performed using MedCalc (Belgium). The average means (M) and the standard deviations (SD) or the median (Me) and the interquartile ranges [Q25-Q75] were calculated according to the standard normal distribution. For the statistical analysis, we used the student’s t-test and the nonparametric (U-test) Mann-Whitney U test.
Categorical variables were expressed as proportions. The Chi-square test was used to compare 2 groups. Pearson’s correlation test was used to evaluate relationships between lipid profile parameters and PD adequacy variables.
The Kaplan-Meier analysis was used to estimate technique survival. The log-rank test was used to evaluate the difference in technique survival rate according to atherogenic dyslipidemia status.
The primary endpoint of this study was the 3-year PD technique survival rate dichotomised according to atherogenic dyslipidemia status. PD technique failure was defined as discontinuation of PD due to uncontrolled volume overload with 2.5% dextrose solution or a decrease in total weekly Kt / V less than 1.7. Death and kidney transplantation were censored.
Atherogenic dyslipidemia was defined as the combination of elevated triglycerides ≥ 2.26 mmol/L (≥ 200 mg/dL) and HDL levels ≤ 0.9 mmol/L (≤ 80 mg/dL) in men and ≤ 1.15 mmol/L (≤ 102 mg/dL) in women.
The duration of technique survival was calculated from the date of study entry. For this analysis, the patients were categorised into 2 groups according to atherogenic dyslipidemia presence at baseline. Group I consisted of 28 patients with atherogenic dyslipidemia and Group II included 12 patients without atherogenic dyslipidemia.
The Cox proportional hazards model of univariate analysis was used to evaluate the association between atherogenic lipid profile and time to PD technique failure as well as to estimate the Hazard ratios (HR) with 95% Confidence Interval (CI). The Cox model was used without adjustment for a priori defined confounding variables including age, gender, BMI, blood pressure, history of CVD and other parameters. P values were calculated, and the null hypothesis was rejected if the P-value was < 0.05.
Results
Association between dyslipidemia and baseline characteristics
Dyslipidemia defined as an increase in atherogenic lipoprotein fractions and inhibition of HDL-cholesterol levels was identified in 28/40 (70%) patients. Table 1 shows the baseline characteristics of study participants according to the presence of atherogenic dyslipidemia. All these data were obtained during routine clinical practice immediately after enrolling the patients in the study.
Table 1.
Baseline characteristics of the study participants according to atherogenic dyslipidemia status
| Clinical parameters | All (n = 40) | Absence of atherogenic dyslipidemia at baseline (n = 12) | Presence of atherogenic dyslipidemia at baseline (n = 28) | P |
|---|---|---|---|---|
| Clinical parameters | ||||
| Male gender, n (%) | 27 (67.5%) | 8 (66.6 %) | 19 (67.8 %) | 0.9 |
| Age, years | 49.3 ± 12.2 | 44.6 ± 8.2 | 52.3 ± 10.4 | 0.028 |
| Charlson Comorbidity Index, points | 5.57±1.5 | 4.83 ± 0.8 | 5.89 ± 1.75 | 0.06 |
| BMI, kg/m2 | 25.3 ± 4.3 | 23.03 ± 1.3 | 25.07 ± 2.54 | 0.01 |
| Serum albumin, g/L | 37.1 [34-39] | 37.8 [36-40.5] | 37 [31.9-39] | 0.12 |
| CRP, mg/L | 9.8 [4.3 - 17.2] | 9.8 [6.0-21] | 10.8 [9.7-17.2] | 0.26 |
| Systolic blood pressure, mm Hg | 129 ± 14.2 | 119 ± 10.2 | 129.3 ± 14.8 | 0.03 |
| Diastolic blood pressure, mm Hg | 78 ±12.4 | 75 ±11.2 | 79 ± 13.2 | 0.38 |
| Hb, g/L | 101.8 ±17.6 | 105.8 [99-124] | 104 [94-121] | 0.65 |
| Glucose, mmol/L | 5.4 ± 2.1 | 5.2 [4.8-5.5] | 5.9 [4.8-5.1] | 0.02 |
| Ferritin, ng/ml | 533 [338.5-832.7] | 523 [348.5-822.1] | 542 [382-785] | 0.58 |
| Calcium, mmol/L | 2.18 [2.0 - 2.33] | 2.25 [2.0 - 2.33] | 2.11 [2.0-2.27] | 0.33 |
| Phosphorus, mmol/L | 1.8 ± 0.5 | 1.7 ± 0.6 | 1.8 ± 0,4 | 0.9 |
| iPTH, ng/L | 225 [123 - 389] | 215 [113 - 329] | 253 [124-468] | 0.11 |
| Peritoneal dialysis parameters | ||||
| Time on PD, months | 29 [18.5-37] | 17.4 [15.0 – 31.3] | 56.0 [32.0-68.1] | <0.0001 |
| Urine volume, mL/24 h | 570 [320-1200] | 920 [680-1300] | 450 [400-750] | 0.002 |
| D/P creatinine ratio | 0.79 ± 0.08 | 0.71 ± 0.12 | 0.78 ± 0.18 | 0.03 |
| Low-average transporters, n (%) | 11 (27.5%) | 4 (33.3%) | 7 (25.0%) | 0.59 |
| High-average transporters,n (%) | 11 (27.5%) | 5 (41.6%) | 6 (21.4%) | 0.19 |
| High transporters,n (%) | 18 (45.0%) | 3 (25.0%) | 15 (53.6%) | 0.09 |
| Icodextrin, n (%) | 5 (12.5%) | 1 (8.3%) | 4 (14.3%) | 0.60 |
| Renal weekly Kt/V | 0.87 [0.44 - 1.43] | 0.91 [0.52 - 1.33] | 0.69 [0.22-0.94] | 0.06 |
| Plasma weekly Kt/V | 1.46 [1.12 - 1.68] | 1.69 [1.32-1.96] | 1.35 [1.06-1.62] | 0.004 |
| Total Kt/V | 2.26 [1.62-2.84] | 2.1 [1.35-2.62] | 1.78 [1.6-1.91] | 0.11 |
| CrCl, L/1.73 m2 | 48.2±18.7 | 49.2 ± 11.05 | 47.4 ± 7.09 | 0.02 |
| Daily peritoneal ultrafiltration, ml | 600 [400-830] | 600 [400-900] | 400 [200-650] | 0.01 |
| Lipid profile parameters | ||||
| TC, mmol/L | 4.95 [4.1-6.1] | 4.9 [4.1-5.8] | 5.2 [4.1-6.1] | 0.3 |
| TG, mmol/L | 1.58 [1.07 - 2.82] | 1.02 [0.85-1.94] | 2.45 [1.08-3.32] | 0.004 |
| LDL, mmol/L | 2.7 [2.4 - 3.3] | 2.6 [2.1-2.9] | 2.8 [2.4-3.7] | 0.04 |
| VLDL, mmol/L | 0.63 [0.44 - 0.9] | 0.7 [0.43-0.8] | 1.14 [0.57-1.7] | 0.0005 |
| HDL, mmol/L | 1.16 [0.9 - 1.56] | 1.25 [0.98-1.3] | 0.81 [0.71-1.0] | 0.0003 |
| AIP | 3.6 [2.3 - 5.3] | 2.9 [2.5-3.15] | 4.8 [4.2-5.8] | <0.0001 |
| Medications, n (%) | ||||
| ACE inhibitors / RAAS blockers | 21 (52.5 %) | 6 (50.0%) | 15 (53.6%) | 0.83 |
| Iron supplementation | 19 (47.5 %) | 5 (41.6%) | 14 (50.0%) | 0.63 |
| Erythropoietins | 26 (65.0 %) | 7 (58.3%) | 19 (67.9%) | 0.56 |
| Beta-blockers | 16 (40.0 %) | 3 (25%) | 13 (46.4%) | 0.21 |
| Calcium channel blockers | 28 (70.0 %) | 8 (66.6%) | 20 (71.4%) | 0.76 |
| Diuretics | 15 (37.5 %) | 4 (33.3%) | 11 (39.3%) | 0.72 |
| Lipid-lowering therapy | 12 (30 %) | 2 (16.6%) | 10 (35.7%) | 0.23 |
The values are expressed as mean ± standard deviation (M ± SD) or as the median and interquartile range (Me [Q25-Q75]). The values are compared between the groups by the Chi-square test, t-test and the Mann–Whitney U test as appropriate. Abbreviations: AIP, atherogenic index of plasma; ACE, angiotensin-converting enzyme; BMI, body mass index; CrCl, creatinine clearance; CRP, C-Reactive Protein; Hb, hemoglobin; HDL-C, high-density lipoprotein cholesterol; iPTH, intact parathyroid hormone; LDL, low-density lipoprotein cholesterol; RAAS, renin-angiotensin-aldosterone system; TC, total cholesterol; total Kt / V, total weekly Kt / V urea; VLDL, very low density lipoprotein cholesterol.
As shown in Table 1, the subjects without atherogenic dyslipidemia at baseline were younger and less obese. Also, they had lesser systolic blood pressure and better glucose control compared with those with atherogenic dyslipidemia at baseline. Moreover, BMI ratios were directly correlated with VLDL levels (r = 0.42, p = 0.007).
Besides, both groups showed significant differences in duration of PD therapy, daily urine output, dialysate to plasma ratio of creatinine (D/P creatinine), plasma weekly Kt/V, weekly creatinine clearance and daily peritoneal ultrafiltration.
Correlation analysis of baseline lipid profile with PD adequacy parameters
Pearson’s correlation analysis was performed to investigate the correlation between lipid profile and PD adequacy variables. It was found that such levels as VLDL and HDL and, accordingly, AIP were significantly associated with duration of PD treatment: r = 0.4, p = 0.009; r = -0.34, p = 0.03 and r = 0.51, p < 0.0001 (Figure 1), respectively.
Figure 1.

The correlation between AIP level and duration of PD treatment in PD patients
In addition, total weekly Kt/V was negatively correlated with serum level of plasma atherogenic index (r = -0.35, p = 0.02) and positively correlated with HDL (r = 0.35, p = 0.027) in PD patients (Figure 2).
Figure 2.

The correlation between HDL levels and total weekly Kt / V in PD patients
The other associations between baseline lipid profile and PD adequacy parameters are listed in Table 2.
Table 2.
The correlations between lipid profile markers and PD adequacy parameters
| PD adequacy parameters | Baseline lipid profile | |||||
|---|---|---|---|---|---|---|
| TC | Triglyceride | LDL | VLDL | HDL | AIP | |
| Duration of PD therapy (months) | r = 0.16 p = 0.29 | r = -0.1 p = 0.53 | r = 0.54 p = 0.0008 | r = 0.4 p = 0.009 | r = -0.34 p = 0.03 | r = 0.51 p < 0.0001 |
| Urine volume | r = -0.16 p = 0.15 | r = 0.18 p = 0.14 | r = -0.31 p = 0.01 | r = 0.22 p = 0.21 | r = 0.31 p = 0.007 | r = 0.15 p = 0.19 |
| D / P creatinine ratio | r = 0.13 p = 0.29 | r = 0.06 p = 0.65 | r = 0.5 p = 0.0001 | r = 0.18 p = 0.16 | r = -0.15, p = 0.23 | r = 0.26 p = 0.04 |
| Total Kt / V | r = -0.13 p = 0.27 | r = -0.01 p = 0.93 | r = -0.16 p = 0.19 | r = -0.13 p = 0.03 | r = 0.35 p = 0.027 | r = -0.35 p = 0.02 |
| Peritoneal Kt / V | r = -0.32 p = 0.004 | r = -0.05 p = 0.67 | r = -0.18 p = 0.15 | r = -0.02 p = 0.85 | r = 0.4 p = 0.0005 | r = -0.17 p = 0.15 |
| Renal Kt / V | r = -0.19 p = 0.09 | r = -0.03 p = 0.78 | r = -0.17 p = 0.17 | r = -0.09 p = 0.44 | r = 0.27 p = 0.02 | r = -0.04 p = 0.69 |
| Peritoneal CrCl | r = -0.33 p = 0.005 | r = -0.09 p = 0.94 | r = -0.25 p = 0.04 | r = -0.05 p = 0.69 | r = 0.33 p = 0.006 | r = -0.04 p = 0.75 |
| Daily peritoneal ultrafiltration | r = -0.27 p = 0.01 | r = -0.26 p = 0.02 | r = -0.12 p = 0.35 | r = -0.23 p = 0.053 | r = 0.05 p = 0.97 | r = -0.19 p = 0.11 |
Abbreviations: AIP, atherogenic index of plasma; CrCl, creatinine clearance; HDL-C, high-density lipoprotein cholesterol; LDL-C, low-density lipoprotein cholesterol; TC, total cholesterol; total Kt / V, total weekly Kt / V urea; VLDL-C, very low-density lipoprotein cholesterol.
There was no correlation between triglyceride level and PD adequacy parameters, excluding daily peritoneal ultrafiltration volume. However, in contrast, baseline HDL level was positively correlated with urine output, total weekly Kt/V, peritoneal and renal Kt / V. Also, HDL level was negatively correlated with duration of PD therapy and D/P creatinine ratio.
Causes of PD technique failure
Fourteen of forty (35.0 %) patients experienced PD technique failure during the 36-month- follow-up period: 9/14 (64.3 %) participants who were transferred to hemodialysis and 5 patients (35.7%) who considered being “technique failures”. However, these 5 patients continued PD treatment for various reasons: inability of adequate vascular access formation-3/5 (60.0%) patients, refusal of HD treatment-1/5 (20.0 %) patients, decompensated heart failure-1 (20.0%) patient. The main reasons for technique failure were the following: dialysis inadequacy-7/14 (50.0%) patients, ascribed to peritonitis-5/14 (35.7%) patients and non-compliance- 2/14 (14.3%) patients.
The incidence of all-cause PD technique failure was 2 times higher in the patients with atherogenic dyslipidemia compared with the patients without dyslipidemia: 2/12 (16.6 %) versus 12/28 (42.9 %) (Figure 3). However, we did not determine a statistically significant difference between the groups (χ2 = 2.5; p = 0.12), which might be associated with small sample size.
Figure 3.

The incidence of all-cause PD technique failure stratified according to atherogenic dyslipidemia status
The effect of atherogenic dyslipidemia on all-cause technique failure
Figure 4 shows the results of the Kaplan-Meier analysis used to estimate technique survival. We observed a highly significant difference in technique failure rate in the patients with atherogenic dyslipidemia compared with the patients without dyslipidemia (log-rank p = 0.02). In the univariate Cox regression model, the presence of atherogenic dyslipidemia was significantly associated with a higher risk of technique failure (HR 4.5; 95% CI 1.6 to 12.9; χ2 = 5.5, p = 0.019).
Figure 4.
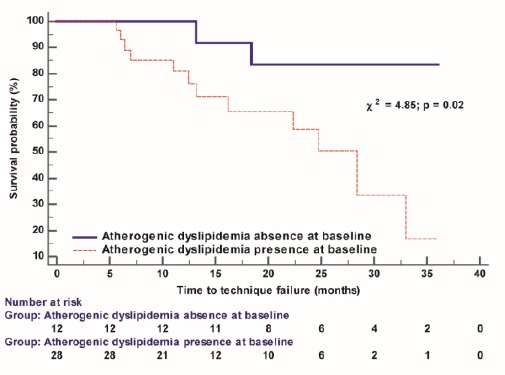
The Kaplan-Meier technique survival curves in PD patients dichotomised according to atherogenic dyslipidemia status
Discussion
Association between dyslipidemia and mortality in PD patients has been well characterized [12], [23], [24], [25]. However, there have been no reports on the association between pro-atherogenic lipid profiles and PD technique survival. To our knowledge, this study is the first prospective cohort study to compare technique survival in PD patients according to atherogenic dyslipidemia status.
One of the more significant findings to emerge from this study is that we found a strong association between lipid profile and PD adequacy parameters. Moreover, this study also founda significantly higher all-cause PD technique failure rate in patients with atherogenic dyslipidemia at baseline.
The effect of dyslipidemia on clinical outcomes in PD patients has not been carefully addressed. Also, the exact mechanism by which dyslipidemia affects a higher risk of all-cause technique failure remains unclear. On the other hand, the association between pro-atherogenic lipid profile and longer PD duration [26], a decrease in RRF [20], [27] and glucose absorption from the dialysis fluid [28], [29] can be a possible explanation of a higher risk of all-cause technique failure.
Cho et al. reported a statistically significant increase in serum TG, AIP and VLDL levels and a decrease in serum HDL levels were associated with longer PD treatment time while the type of PD solution received had no significant effect on these levels [26]. Consistent with this notion, we found a strong positive correlation between the duration of PD therapy and an increase in LDL, VLDL and AIP levels, whereas LDL level decreased over the PD treatment time.
Chen et al. demonstrated different longitudinal changes in lipid profiles in PD patients with different RRF. They also showed an association between a decrease in HDL and deterioration of RRF [20]. LinYC et al. analysed the data from a nationwide population-based cohort study and concluded that the effect of lipid profiles on mortality was modified by RRF [30]. In the present study, we did not analyse RRF in the patients. However, the current study supports the results of the findings mentioned above and confirms the idea of a positive association between urine volume and HDL level. Moreover, we observed a significant decrease in residual diuresis in dyslipidemia conditions. Additionally, fluid and weight control problems are common amongst PD patients and may be accompanied by dyslipidemia [16], [20], [25], [29], [31]. Rincón et al. found the mean increase in fat mass of 3.0 ± 3.2 kg/year during the 26-month-follow-up period. Changes in fat mass were directly associated with an inverse correlation between fat mass and HDL in PD patients [28]. Besides, they concluded that changes in body composition in patients undergoing PD might affect other parameters, namely, alteration in lipid profile [28]. We did not determine the fat mass in this study. On the other hand, we observed an increase in BMI which was significantly associated with high levels of VLDL.
Glucose absorption from the dialysis fluid can be considered as an important risk factor for increased insulin resistance, enhanced hepatic synthesis and secretion of VLDL-C [31]. As a result, administration of glucose-based PD solutions leads to structural and functional changes in the peritoneal membrane resulting in fluid overload, impaired glucose control, altered lipid profiles and peritoneal dialysis technique failure [23], [32], [33]. This research supports previous findings. Thus, we found a direct correlation between D/P creatinine ratio and LDL levels and an inverse correlation between daily peritoneal ultrafiltration and triglyceride level (Table 2). We reported total weekly Kt/V urea was associated with high levels of LDL and AIP (Table 2).
It is almost certain that further investigation is needed to determine the role of atherogenic dyslipidemia in the pathogenesis of PD technique failure. Furthermore, inflammation and malnutrition can affect lipid levels and PD technique survival [34]. However, these factors were not included in the study. Our investigation demonstrated a significant association between atherogenic dyslipidemia and a higher risk of technique failure in PD patients. Thus, it becomes possible to hypothesise that lipid-lowering therapy can reduce not only CVD risk but also improve technique survival in PD patients.
Finally, several important limitations need to be considered
First, it was a small sample size study performed in a single-centre study. Therefore, our findings revealed only associations. Further study with a larger sample size from multiple dialysis centres is needed to confirm our results. Second, only baseline data were used for this analysis. The current study was limited by baseline data. Third, we did not investigate the effect of changes in lipid profiles on the development of CVD in PD patients during the observation period.
Moreover, dialysis-related, patient-related and systemic factors could affect both the development of atherosclerosis and PD technique failure. However, these factors were not considered in our study. Despite the limitations mentioned above, the strong association between dyslipidemia and PD technique survival observed in the present study indicated the important role of dyslipidemia in predicting PD technique failure. The larger-scale studies are needed for further confirmation of our findings.
In conclusion, the presence of atherogenic dyslipidemia in PD patients was significantly associated with a higher risk of technique failure. The results of the present study demonstrated that dyslipidemia in PD patients could be considered not only as a traditional risk factor for CVD but also as a predictor of PD technique survival. Further well-designed clinical trials are needed to determine the impact of dyslipidemia on PD adequacy and technique survival.
Authors’ Contribution
NS: the concept, design; analysed and interpreted the patient data; a major contributor in writing the manuscript. OB: performed the data collection, the manuscript preparation.
Acknowledgements
The study was carried out within the framework of the Institute’s research work: “The Study of New Prognostic Risk Factors for Peritoneal Dialysis Technique Survival” (Domestic Trial Registration Number is 0117U002122).
Footnotes
Funding: The study was carried out within the framework of the Institute’s research work: “The Study of New Prognostic Risk Factors for Peritoneal Dialysis Technique Survival” (Domestic Trial Registration Number is 0117U002122)
Competing Interests: The authors have declared that no competing interests exist
References
- 1.Barone R, Cámpora M, Gimenez N, Ramirez L, Panese S, Santopietro M. Peritoneal Dialysis as a first versus second option after previous haemodialysis:a very long-term assessment. Int J Nephrol. 2014;2014:693670. doi: 10.1155/2014/693670. https://doi.org/10.1155/2014/693670 PMid:25505992 PMCid:PMC4258321. [DOI] [PMC free article] [PubMed] [Google Scholar]
- 2.Jain AK, Blake P, Cordy P, Garg AX. Global trends in rates of peritoneal dialysis. J Am Soc Nephrol. 2012;23(3):533–533. doi: 10.1681/ASN.2011060607. https://doi.org/10.1681/ASN.2011060607 PMid:22302194 PMCid:PMC3294313. [DOI] [PMC free article] [PubMed] [Google Scholar]
- 3.Kolesnyk I, Noordzij M, Kolesnyk M, Kulyzky M, Jager K. Renal replacement therapy in Ukraine:epidemiology and international comparisons. Clin Kidney J. 2014;7(3):330–330. doi: 10.1093/ckj/sfu037. https://doi.org/10.1093/ckj/sfu037 PMid:25852905 PMCid:PMC4377756. [DOI] [PMC free article] [PubMed] [Google Scholar]
- 4.Velloso MS, Otoni A, de Paula Sabino A, de Castro WV, Pinto SW, Marinho MA, et al. Peritoneal dialysis and inflammation. Clin Chim Acta. 2014;430:109–14. doi: 10.1016/j.cca.2013.12.003. https://doi.org/10.1016/j.cca.2013.12.003 PMid:24333488. [DOI] [PubMed] [Google Scholar]
- 5.Cho Y, Hawley CM, Johnson DW. Clinical causes of inflammation in peritoneal dialysis patients. Int J Nephrol. 2014;2014:909373. doi: 10.1155/2014/909373. https://doi.org/10.1155/2014/909373 PMid:24895536 PMCid:PMC4033334. [DOI] [PMC free article] [PubMed] [Google Scholar]
- 6.Baroni G, Schuinski A, de Moraes T, Meyer F, Pecoits-Filho R. Inflammation and the peritoneal membrane:causes and impact on structure and function during peritoneal dialysis. Mediators Inflamm. 2012;2012:912595. doi: 10.1155/2012/912595. https://doi.org/10.1155/2012/912595 PMid:22547910 PMCid:PMC3323921. [DOI] [PMC free article] [PubMed] [Google Scholar]
- 7.Termorshuizen F, Korevaar JC, Dekker FW, Van Manen JG, Boeschoten EW, et al. Hemodialysis and peritoneal dialysis:comparison of adjusted mortality rates according to the duration of dialysis:analysis of The Netherlands Cooperative Study on the Adequacy of Dialysis 2. J Am Soc Nephrol. 2003;14(11):2851–2851. doi: 10.1097/01.asn.0000091585.45723.9e. https://doi.org/10.1097/01.ASN.0000091585.45723.9E PMid:14569095. [DOI] [PubMed] [Google Scholar]
- 8.Jaar BG, Coresh J, Plantinga LC, Fink NE, Klag MJ, et al. Comparing the risk for death with peritoneal dialysis and hemodialysis in a national cohort of patients with chronic kidney disease. Ann Intern Med. 2005;143(3):174–174. doi: 10.7326/0003-4819-143-3-200508020-00003. https://doi.org/10.7326/0003-4819-143-3-200508020-00003 PMid:16061915. [DOI] [PubMed] [Google Scholar]
- 9.Wu C-L, Wu H-M, Chiu P-F, Liou HH, Chang CB, Tarng DC, et al. Stover CM, editor. Associations between the duration of dialysis, endotoxemia, monocyte chemoattractant protein-1, and the effects of a short-dwell exchange in patients requiring continuous ambulatory peritoneal dialysis. PLoS One. 2014;9(10):e109558. doi: 10.1371/journal.pone.0109558. https://doi.org/10.1371/journal.pone.0109558 PMid:25286027 PMCid:PMC4186838. [DOI] [PMC free article] [PubMed] [Google Scholar]
- 10.Tonelli MA, Wanner C. Kidney disease:improving global outcomes (KDIGO) lipid work group. KDIGO clinical practice guideline for lipid management in chronic kidney disease. Kidney International Supplements. 2013;3(3):1–315. [Google Scholar]
- 11.Chiu YW, Mehrotra R. Can we reduce the cardiovascular risk in peritoneal dialysis patients? Indian J Nephrol. 2010;20(2):59–59. doi: 10.4103/0971-4065.65296. https://doi.org/10.4103/0971-4065.65296 PMid:20835317 PMCid:PMC2931134. [DOI] [PMC free article] [PubMed] [Google Scholar]
- 12.Mikolasevic I, Žutelija M, Mavrinac V, Orlic L. Dyslipidemia in patients with chronic kidney disease:etiology and management. Int J Nephrol Renovasc Dis. 2017;10:35–45. doi: 10.2147/IJNRD.S101808. https://doi.org/10.2147/IJNRD.S101808 PMid:28223836 PMCid:PMC5304971. [DOI] [PMC free article] [PubMed] [Google Scholar]
- 13.Omran J, Al-Dadah A, Dellsperger KC. Dyslipidemia in patients with chronic and end-stage kidney disease. Cardiorenal Med. 2013;3(3):165–165. doi: 10.1159/000351985. https://doi.org/10.1159/000351985 PMid:24454313 PMCid:PMC3884190. [DOI] [PMC free article] [PubMed] [Google Scholar]
- 14.Yang W-L, Zhu X-Y, Zhu N, Chun-Yan Su, Qing-Feng Han, Tao Wang, et al. What's the optimal lipids level for dialysis patients?A cohort study from a Chinese dialysis center in a university hospital. PLoS One. 2016;11(12):e0167258. doi: 10.1371/journal.pone.0167258. https://doi.org/10.1371/journal.pone.0167258 PMid:27992532 PMCid:PMC5161355. [DOI] [PMC free article] [PubMed] [Google Scholar]
- 15.Shurraw S, Tonelli M. Statins for treatment of dyslipidemia in chronic kidney disease. Perit Dial Int. 2006;26:523–39. [PubMed] [Google Scholar]
- 16.Rincón Bello A, Bucalo L, Abad Estébanez S, Barraca Núñez D, Yuste Lozano C, Pérez de José A, et al. Fat tissue and inflammation in patients undergoing peritoneal dialysis. Clinical Kidney Journal. 2016;9(3):374–374. doi: 10.1093/ckj/sfw007. https://doi.org/10.1093/ckj/sfw007 PMid:27274820 PMCid:PMC4886903. [DOI] [PMC free article] [PubMed] [Google Scholar]
- 17.de Mattos AM, Ovidio PP, Jordão AA, da Costa JA, Chiarello PG. Association of body fat with inflammation in peritoneal dialysis. Inflammation. 2013;36(3):689–689. doi: 10.1007/s10753-013-9593-3. https://doi.org/10.1007/s10753-013-9593-3 PMid:23321723. [DOI] [PubMed] [Google Scholar]
- 18.Fernström A, Hylander B, Moritz A, Jacobsson H, Rössner S. Increase of intra-abdominal fat in patients treated with continuous ambulatory peritoneal dialysis. Perit Dial Int. 1998;18(2):166–71. [PubMed] [Google Scholar]
- 19.Harmankaya O, Akalin N, Akay H, Okuturlar Y, Erturk K, Kaptanogullari H, et al. Comparison of risk factors for cardiovascular disease in hemodialysis and peritoneal dialysis patients. Clinics. 2015;70(9):601–601. doi: 10.6061/clinics/2015(09)01. https://doi.org/10.6061/clinics/2015(09)01. [DOI] [PMC free article] [PubMed] [Google Scholar]
- 20.Chen H-Y, Tsai W-C, Chiu Y-L, Hsu SP, Pai MF, Yang JY, et al. Triglyceride to high-density lipoprotein cholesterol ratio predicts cardiovascular outcomes in prevalent dialysis patients. Medicine. 2015;94(10):e619. doi: 10.1097/MD.0000000000000619. https://doi.org/10.1097/MD.0000000000000619 PMid:25761189 PMCid:PMC4602469. [DOI] [PMC free article] [PubMed] [Google Scholar]
- 21.Ronco C. Adequacy of peritoneal dialysis is more than Kt/V. Nephrol Dial Transplant. 1997;12(1):68–73. [PubMed] [Google Scholar]
- 22.Heimburger O. How should we measure peritoneal dialysis adequacy in the clinic. Contrib Nephrol. 2009;163:140–6. doi: 10.1159/000223792. https://doi.org/10.1159/000223792 PMid:19494607. [DOI] [PubMed] [Google Scholar]
- 23.Liao CT, Kao TW, Chou YH, Wu MS, Chen YM, Chuang HF, et al. Associations of metabolic syndrome and its components with cardiovascular outcomes among non-diabetic patients undergoing maintenance peritoneal dialysis. Nephrol Dial Transplant. 2011;26(12):4047–4047. doi: 10.1093/ndt/gfr175. https://doi.org/10.1093/ndt/gfr175 PMid:21565947. [DOI] [PubMed] [Google Scholar]
- 24.Habib AN, Baird BC, Leypoldt JK, Cheung AK, Goldfarb-Rumyantzev AS. The association of lipid levels with mortality in patients on chronic peritoneal dialysis. Nephrol Dial Transplant. 2006;21(10):2881–2881. doi: 10.1093/ndt/gfl272. https://doi.org/10.1093/ndt/gfl272 PMid:16735386. [DOI] [PubMed] [Google Scholar]
- 25.Lin YC, Lin YC, Peng CC, Chen KC, Chen HH, Fang TC, et al. Effects of cholesterol levels on mortality in patients with long-term peritoneal dialysis based on residual renal function. Nutrients. 2018;10(3):300. doi: 10.3390/nu10030300. https://doi.org/10.3390/nu10030300 PMid:29510483 PMCid:PMC5872718. [DOI] [PMC free article] [PubMed] [Google Scholar]
- 26.Cho Y, Büchel J, Steppan S, et al. Longitudinal trend in lipid profile of incident peritoneal dialysis patients is not influenced by the use of biocompatible solutions. Perit Dial Int. 2016;36(2):146–146. doi: 10.3747/pdi.2014.00291. https://doi.org/10.3747/pdi.2014.00291 PMid:26429421 PMCid:PMC4803359. [DOI] [PMC free article] [PubMed] [Google Scholar]
- 27.Liu X, Dai C. Advances in understanding and management of residual renal function in patients with chronic kidney disease. Kidney Dis. 2017;2(4):187–187. doi: 10.1159/000449029. https://doi.org/10.1159/000449029 PMid:28232935 PMCid:PMC5260570. [DOI] [PMC free article] [PubMed] [Google Scholar]
- 28.Rincón Bello A, Bucalo L, Abad Estébanez S, Vega Martínez A, Barraca Núñez D, Yuste Lozano C, et al. Fat tissue and inflammation in patients undergoing peritoneal dialysis. Clin Kidney J. 2016;9(3):374–374. doi: 10.1093/ckj/sfw007. https://doi.org/10.1093/ckj/sfw007 PMid:27274820 PMCid:PMC4886903. [DOI] [PMC free article] [PubMed] [Google Scholar]
- 29.Guo Q, Lin J, Li J, Yi C, Mao H, Yang X, et al. The effect of fluid overload on clinical outcome in southern chinese patients undergoing continuous ambulatory peritoneal dialysis. Perit Dial Int. 2015;35(7):691–691. doi: 10.3747/pdi.2014.00008. https://doi.org/10.3747/pdi.2014.00008 PMid:26152580 PMCid:PMC4690624. [DOI] [PMC free article] [PubMed] [Google Scholar]
- 30.Lin YC, Lin YC, Peng CC, et al. Effects of Cholesterol Levels on Mortality in Patients with Long-Term Peritoneal Dialysis Based on Residual Renal Function. Nutrients. 2018;10(3):300. doi: 10.3390/nu10030300. https://doi.org/10.3390/nu10030300 PMid:29510483 PMCid:PMC5872718. [DOI] [PMC free article] [PubMed] [Google Scholar]
- 31.Tsimihodimos V, Mitrogianni Z, Elisaf M. Dyslipidemia associated with chronic kidney disease. Open Cardiovasc Med J. 2011;5:41–48. doi: 10.2174/1874192401105010041. https://doi.org/10.2174/1874192401105010041 PMid:21643500 PMCid:PMC3106357. [DOI] [PMC free article] [PubMed] [Google Scholar]
- 32.Holmes CJ. Reducing cardiometabolic risk in peritoneal dialysis patients:role of the dialysis solution. J Diabetes Sci Technol. 2009;3(6):1472–1472. doi: 10.1177/193229680900300629. https://doi.org/10.1177/193229680900300629 PMid:20144403 PMCid:PMC2787049. [DOI] [PMC free article] [PubMed] [Google Scholar]
- 33.Mehrotra R, Devuyst O, Davies SJ, Johnson DW. The current state of peritoneal dialysis. J Am Soc Nephrol. 2016;27(11):3238–3238. doi: 10.1681/ASN.2016010112. https://doi.org/10.1681/ASN.2016010112 PMid:27339663 PMCid:PMC5084899. [DOI] [PMC free article] [PubMed] [Google Scholar]
- 34.Liu Y, Coresh J, Eustace JA, Longenecker JC, Jaar B, Fink NE, Tracy RP, Powe NR, Klag MJ. Association between cholesterol level and mortality in dialysis patients:role of inflammation and malnutrition. Jama. 2004;291(4):451–451. doi: 10.1001/jama.291.4.451. https://doi.org/10.1001/jama.291.4.451 PMid:14747502. [DOI] [PubMed] [Google Scholar]