

Abstract
Objective:
To evaluate the association between gestational weight gain in twin pregnancies and small- and large-for-gestational-age birth (SGA, LGA), preterm birth <32 weeks, cesarean delivery, and infant death within each prepregnancy body mass index (BMI) category.
Methods:
Data in this population-based study came from Pennsylvania linked infant birth and death records (2003–2013). We studied 54,836 twins born alive at <39 weeks gestation. Total pregnancy weight gain (kg) was converted to gestational age-standardized z scores. Multivariable modified Poisson regression models stratified by prepregnancy BMI were used to estimate associations between z scores and outcomes. A probabilistic bias analysis, informed by an internal validation study, evaluated the impact of BMI and weight gain misclassification.
Results:
Gestational weight gain z score was negatively associated with SGA and positively associated with LGA and cesarean delivery in all BMI groups. The relation between weight gain and preterm birth was U-shaped in non-obese women. An increased risk of infant death was observed for very low weight gain among normal weight women and for high weight gain among women without obesity. Most excess risks of these outcomes were observed at weight gains 37-week gestation equivalent to <14 kg or >27 kg in underweight or normal weight women, <11 kg or >28 kg in overweight women, and <6.4 kg or >26 kg in women with obesity. The bias analysis supported the validity of the conventional analysis.
Conclusions:
Very low or very high weight gains were associated with the adverse outcomes we studied. If the associations we observed are even partially reflective of causality, then targeted modification of pregnancy weight gain in women carrying twins might improve pregnancy outcomes.
Precis
Most of the excess risk of poor birth outcomes in twin pregnancies occurs at very high or very low gestational weight gains relative to moderate gains.
Introduction
Over the past 40 years, the number of twins born in the U.S. doubled (1,2). This unprecedented rise is a major public health concern because twin gestations disproportionately experience poor maternal and infant outcomes. Compared with singletons, twins are 2.5 times as likely to die in utero (3) and are more than four times as likely to die in the first year of life (4). The dramatic elevation in the risk of perinatal death is due to the higher rates of pregnancy complications and poor birth outcomes, most notably preterm birth. While twins make up 3.3% of all births, they account for over 20% of the burden of preterm births (2) Twin pregnancies are also more likely to experience diabetes, preeclampsia, and cesarean deliveries (5,6).
Gestational weight gain is a potentially modifiable factor that has been linked with many poor pregnancy and birth outcomes that are common to twin pregnancies (7,8). In 1990 (9) and again in 2009 (8), the Institute of Medicine (IOM) (now called the National Academy of Medicine) and the National Research Council recognized the importance of understanding optimal pregnancy weight gain ranges for women with twin gestations. Yet, the current evidence base to inform gestational weight gain guidelines for twin pregnancies is methodologically limited. As a result of the limited evidence base, the 2009 IOM Committee could only provide provisional guidelines that were based on the interquartile range of weight gain observed in a single study of 2234 self-selected mothers who delivered twins weighing at least 2500 g at ≥36 weeks’ gestation (8,11). This evidence base and the resulting provisional guidelines are insufficient for optimizing maternal and child health.
Our objective was to evaluate the association between gestational weight gain z scores, a measure standardized for gestational age, and SGA, LGA, preterm birth <32 weeks, cesarean delivery, and infant death separately by prepregnancy BMI category in a large, population-based cohort of twin births.
Methods
Penn MOMS is a population-based study of maternal obesity, gestational weight gain, and adverse birth outcomes (12,13) that was approved by the University of Pittsburgh institutional review board. Data came from Pennsylvania linked infant birth and death vital statistics records from 2003 to 2013. We cleaned the data to eliminate duplicate records, confirm plurality and match twin siblings, create unique maternal and pregnancy identifiers, and confirm all birth-death matches. Of the 55,471 live-born twins, we excluded 635 (1.1%) infants born at 39 weeks gestation or greater because the American College of Obstetricians and Gynecologists recommend the delivery of twin pregnancies by 39 weeks (14), and gestational weight gain z scores (15) and the fetal growth percentiles (16) for twins are available up to 38 weeks of gestation. Our final analytic sample included 54,836 live-born twins, contributed by 27,723 twin pregnancies. Missing values were filled first using information from the record of the twin sibling, as appropriate, and if missing in both twins, by multiple imputation, described below.
Birth registry staff interviewed the mother before hospital discharge to obtain prepregnancy height and weight, which we used to calculate prepregnancy BMI (weight (kg)/height (m)2). We classified women as underweight (<18.5 kg/m2), normal weight (18.5–24.9 kg/m2), overweight (25–29.9 kg/m2), grade 1 obese (30–34.9 kg/m2), grade 2 obese (35–39.9 kg/m2), or grade 3 obese (≥40 kg/m2) (17). Maternal weight at delivery was ascertained from the medical record, either from the last recorded antenatal weight or from measured or self-reported weight at delivery. We calculated total gestational weight gain by subtracting prepregnancy weight from maternal weight at delivery. We standardized total gestational weight gain (kg) for gestational age at delivery using prepregnancy BMI category-specific z score charts for twin pregnancies that were produced for Magee-Womens Hospital in Pittsburgh, Pennsylvania (15). Converting women’s total weight gain to gestational age-standardized z scores produces a measure that is independent of gestational duration (15,18,19). Z-scores were calculated by comparing a woman’s weight gain to the gestational age-specific mean and standard deviation of weight gain in the population using the formula: z score=(observed weight- gestational age-specific population mean weight)/gestational age-specific population standard deviation (15). We present the total weight gain (kg) equivalent to each z score, assuming a 37-week gestation.
The Pennsylvania Bureau of Health Statistics and Research uses birth certificate record number, county of birth, date of birth, and mother and infant names to link infant death certificates to the birth certificates with a match rate of 98.5%. We defined infant mortality as the death of a live-born infant before 365 days old, and neonatal death as death before 28 days old. We evaluated preterm birth before 32 weeks’ gestation because the risk of neonatal morbidity is highest at <32 weeks (20). Gestational age was based on the best obstetric estimate at delivery (21). We validated gestational age from the birth certificate against the customary gestational age derivation based on last menstrual period and ultrasound dating in the medical record (22) from 2251 twin pregnancies at Magee-Womens Hospital (Spearman’s rank correlation: 0.97; preterm birth classification: 99% agreement). Small- and large-for-gestational age births were classified using twin-specific ultrasound-based intrauterine fetal weight standards at <10th percentile or >90th percentile, respectively (16).
Maternal interview before discharge provided birth certificate data on maternal race or ethnicity, maternal education, marital status, and smoking during pregnancy. Medical records were used to ascertain birth certificate data on parity, source of payment at delivery, preexisting conditions, and address of primary residence at delivery. A birth registry staff member uses medical record data to ascertain whether the “pregnancy resulted from infertility treatment” (yes/no). The Pennsylvania Bureau of Health Statistics and Research geocodes addresses of primary residence and provides census tracts and block groups, which we merged with U.S. Department of Agriculture Economic Research Service Urban-Rural Continuum Codes (23) to define urban residence. Using the 2000 United States Census data, we also created a census-tract level measure of the percentage of Black residents (24). We classified the neonatal care of the birth facility as level 1, 2, or 3 (25).
Statistical Analysis
Records were missing data on birth weight (0.7%), gestational age (0.4%), delivery weight (9.4%), prepregnancy weight (5.8%), height (0.9%), or one of the confounders in the final model (11%). Missing data were imputed using the multivariate normal imputation model, which uses an iterative Markov Chain Monte Carlo method (26,27). We included in the imputation model all variables in the dataset because this approach produces more accurate and stable estimates (28,29). We imputed 25 datasets, with initial values derived from 500 iterations. Data were imputed at the infant level, but the pregnancy identifier was included in the imputation model to inform the estimates. We performed imputation diagnostics comparing the imputed and observed datasets to inform the number of imputations and to ensure acceptability of the completed imputations (30).
To estimate the independent association between gestational weight gain z score and each adverse outcome, we used multivariable modified Poisson models with a log link and robust standard errors to account for clustering between twin pairs (31). Modified Poisson regression with robust standard errors is an acceptable alternative to log-binomial models, even when applied to binomially distributed data (31,32). We used a “twins-as-individuals” modeling approach because we were not interested in studying the twin pair itself (33).
We decided a priori to stratify models by prepregnancy BMI category because weight gain guidelines are BMI-specific (8). To accommodate flexible, nonlinear relations, we modeled gestational weight gain z scores as restricted cubic splines with four knots at the 5th, 35th, 65th, and 95th percentiles of the distribution (normal weight and overweight women) or three knots at the 10th, 50th, and 90th percentiles (all other BMI categories) (34). We selected these specifications for each BMI group based on Akaike information criterion (34). We used theory-based causal diagrams (35) to identify confounders that we included in all models: maternal race or ethnicity, education, neonatal care level of birth facility (a proxy for antenatal care facility), parity, payment at delivery, smoking during pregnancy, marital status, year of birth, height, maternal age, pre-existing diabetes or hypertension, infertility treatment, infant sex, and racial composition of neighborhood (as a proxy of neighborhood-level socioeconomic status). All models included prepregnancy weight to account for potential confounding within BMI categories, and a statistical interaction term between maternal race or ethnicity and the racial composition of the neighborhood. We specified categorical confounders as indicator variables and continuous confounders as restricted cubic splines.
After model estimation, we calculated risk differences and 95% confidence intervals (CI) for selected z score values from −2 SD to +2 SD (approximately 4.5th to 97.5th percentiles of weight gain z scores observed in our cohort) compared with the z score of 0. We calculated the excess or prevented number of cases per 100 births by multiplying estimates by 100. We plotted the average adjusted risks and 95% CI for each outcome by BMI category. We compared these results with those generated using twins known to have a sex discordant pair because they were dichorionic diamniotic twins (n=19,406, 35% of twins). We also performed sensitivity analysis among twins without congenital anomalies (n= 54,048) or twins with complete data (n=43,668).
We previously conducted a validation study of self-reported prepregnancy weight and height, and the resulting estimates of BMI and gestational weight gain categories, derived from the birth certificate. Self-reported weight and height were validated with information abstracted from medical records for 1204 singleton and 186 twin Pennsylvania births at a single institution (36,37). We used the predictive values from the validation study to adjust our results for measurement error in BMI and gestational weight gain using probabilistic bias analysis methods as a supplemental analysis (38,39). Our approach has been described in detail previously (38). We randomly selected one multiply imputed dataset for the probabilistic bias analysis due to the computational intensity of joining probabilistic bias analysis with multiple imputation (38).
Results
Mothers of twins tended to be non-Hispanic white, college graduates, married, multiparous, 30 years or older, and had private insurance and no preexisting conditions (Table 1). Most mothers lived in metropolitan areas and delivered in facilities with Level 3 neonatal care. Approximately 16% of mothers received infertility treatment. Women who were underweight, normal weight, overweight, grade 1 obese, grade 2 obese, and grade 3 obese made up 3.4%, 48%, 24%, 13%, 6.6%, and 5.0% of the population, respectively, and their mean total weight gain (SD) was 18 (6.4), 19 (7.2), 18 (8.5), 16 (9.2), 13 (9.7), and 11 (11) kg.
Table 1.
Characteristics of mothers delivering live-born twins, Pennsylvania twin birth certificates, 2003–2013.
| Total Mothers N = 27,723 n (%) | |
|---|---|
| Race or ethnicity | |
| Non-Hispanic White | 20,515 (74) |
| Non-Hispanic Black | 4,436 (16) |
| Hispanic | 1,830 (6.6) |
| Non-Hispanic Other | 942 (3.4) |
| Prepregnancy body mass index | |
| Underweight (<18.5 kg/m2) | 915 (3.3) |
| Normal weight (18.5–24.9 kg/m2) | 13,307 (48) |
| Overweight (25–29.9 kg/m2) | 6,654 (24) |
| Grade 1 obese (30–34.9 kg/m2) | 3,604 (13) |
| Grade 2 obese (35–39.9 kg/m2) | 1,857 (6.7) |
| Grade 3 obese (>40 kg/m2) | 1,386 (5.0) |
| Age | |
| < 20 years | 1,109 (4.0) |
| 20-29 years | 11,366 (41) |
| ≥ 30 years | 15,248 (55) |
| Education | |
| High school or equivalent | 9,149 (33) |
| Some college or associates degree | 7,208 (26) |
| College graduate | 11,366 (41) |
| Marital status | |
| Unmarried | 8,871 (32) |
| Married | 18,852 (68) |
| Parity at index birth | |
| 1 | 6,099 (22) |
| 2 or more | 21,624 (78) |
| Received infertility treatment | |
| No | 23,287 (84) |
| Yes | 4,436 (16) |
| Smoking during pregnancy | |
| No | 24,119 (87) |
| Yes | 3,604 (13) |
| Preexisting diabetes or hypertension | |
| No | 26,891 (97) |
| Yes | 832 (3.0) |
| Insurance | |
| Private | 19,129 (69) |
| Medicaid, self-pay, or other | 8,594 (31) |
| Neonatal care level of birth facility | |
| Level 1 or 2 | 6,654 (24) |
| Level 3 | 21,069 (76) |
| Urban residence | |
| Metropolitan, ≥1 million | 16,079 (58) |
| Metropolitan, 250,000–<1 million | 7,208 (26) |
| Metropolitan, <250,000 | 2,190 (7.9) |
| Non-metropolitan urban/rural | 2,246 (8.1) |
| Census tract racial distribution % Black residents (median (interquartile range)) | 2.7 (0.8, 11) |
| Gestational weight gain (mean (SD)), kg | 17 (8.5) |
| Gestational weight gain z score (mean (SD)), SD | −0.048 (1.5) |
SD, standard deviation
The unadjusted incidences of SGA, LGA, preterm birth <32 weeks, cesarean delivery, and infant death were 12%, 8%, 13%, 68%, and 3.1%, respectively. Approximately 84% of infant deaths occurred in the neonatal period. SGA and preterm birth <32 weeks were most common among underweight women, and did not vary greatly among the other BMI groups (Table 2). LGA and cesarean delivery were more common as prepregnancy BMI category increased. The incidence of infant death was highest at the extremes of BMI.
Table 2.
Unadjusted incidence of select adverse twin birth outcomes stratified by maternal prepregnancy body mass index, Pennsylvania twin birth certificates, 2003–2013.
| Prepregnancy body mass index* | Births | Small-for-gestational-age birth | Large-for-gestational-age birth | Preterm birth <32 weeks | Cesarean delivery | Infant death | |||||
|---|---|---|---|---|---|---|---|---|---|---|---|
| Total, n | Cases, n | % | Cases, n | % | Cases, n | % | Cases, n | % | Cases, n | % | |
| Underweight | 1858 | 370 | 20 | 88 | 4.7 | 291 | 16 | 1093 | 59 | 75 | 4.0 |
| Normal weight | 26,011 | 3323 | 13 | 1756 | 6.8 | 3183 | 12 | 16,979 | 65 | 675 | 2.6 |
| Overweight | 13,373 | 1531 | 11 | 1146 | 8.6 | 1667 | 12 | 9237 | 69 | 409 | 3.1 |
| Grade 1 obese | 7153 | 864 | 12 | 627 | 8.8 | 865 | 12 | 5120 | 72 | 262 | 3.7 |
| Grade 2 obese | 3684 | 403 | 11 | 403 | 11 | 485 | 13 | 2668 | 72 | 136 | 3.7 |
| Grade 3 obese | 2757 | 285 | 10 | 317 | 12 | 376 | 14 | 2164 | 78 | 117 | 4.2 |
Underweight (<18.5 kg/m2), normal weight (18.5–24.9 kg/m2), overweight (25–29.9 kg/m2), grade 1 obese (30–34.9 kg/m2), grade 2 obese (35–39.9 kg/m2), or grade 3 obese (≥40 kg/m2)
As gestational weight gain z score category increased across all BMI groups, the unadjusted risk of SGA declined, while LGA and cesarean delivery increased (Table 3). The risk of preterm birth <32 weeks and infant death tended to be highest at the extremes of weight gain.
Table 3.
Unadjusted incidence of select adverse twin birth outcomes stratified by gestational weight gain z score and maternal prepregnancy body mass index, Pennsylvania twin birth certificates, 2003–2013.
| Maternal prepregancy BMI | Gestational weight gain z score * | Total gestational weight gain equivalent at 37 weeks, kg | Small-for-gestational-age birth | Large-for-gestational-age birth | Preterm birth <32 weeks | Cesarean Delivery | Infant death | ||||||
|---|---|---|---|---|---|---|---|---|---|---|---|---|---|
| Births, n | Cases, n | % | Cases, n | % | Cases, n | % | Cases, n | % | Cases, n | % | |||
| Underweight † | <−1 SD | <14 | 314 | 104 | 33 | 6 | 1.7 | 53 | 17 | 159 | 51 | 8 | 2.6 |
| −1 to +1 SD | 14-27 | 1317 | 234 | 18 | 63 | 4.8 | 176 | 13 | 790 | 60 | 48 | 3.6 | |
| >+1 SD | >27 | 227 | 32 | 14 | 19 | 8.6 | 62 | 27 | 144 | 64 | 19 | 8.5 | |
| Normal weight | <−1 SD | <14 | 4194 | 872 | 21 | 169 | 4.0 | 673 | 16 | 2549 | 61 | 144 | 3.4 |
| −1 to +1 SD | 14-27 | 17,514 | 2049 | 12 | 1104 | 6.3 | 1941 | 11 | 11,427 | 65 | 394 | 2.3 | |
| >+1 SD | >27 | 4303 | 402 | 9.3 | 483 | 11 | 569 | 13 | 3003 | 70 | 137 | 3.2 | |
| Overweight | <−1 SD | <11 | 1856 | 335 | 18 | 104 | 5.6 | 305 | 17 | 1226 | 66 | 68 | 3.6 |
| −1 to +1 SD | 11–28 | 9220 | 971 | 11 | 730 | 7.9 | 1041 | 11 | 6324 | 69 | 253 | 2.7 | |
| >+1 SD | >28 | 2297 | 225 | 9.8 | 312 | 14 | 321 | 14 | 1687 | 73 | 88 | 3.8 | |
| Grade 1 obese | <−1 SD | <6.4 | 769 | 133 | 17 | 31 | 4.0 | 116 | 15 | 492 | 64 | 35 | 4.5 |
| −1 to +1 SD | 6.4–26 | 5088 | 608 | 12 | 422 | 8.3 | 560 | 11 | 3641 | 72 | 162 | 3.2 | |
| >+1 SD | >26 | 1297 | 123 | 9.5 | 174 | 13 | 189 | 15 | 987 | 76 | 65 | 5.1 | |
| Grade 2 obese | <−1 SD | <6.4 | 670 | 99 | 15 | 43 | 6.5 | 110 | 16 | 465 | 69 | 32 | 4.9 |
| −1 to +1 SD | 6.4–26 | 2486 | 253 | 10 | 280 | 11 | 302 | 12 | 1788 | 72 | 84 | 3.4 | |
| >+1 SD | >26 | 528 | 51 | 9.7 | 80 | 15 | 73 | 14 | 415 | 79 | 20 | 3.8 | |
| Grade3 obese | <−1 SD | <6.4 | 744 | 113 | 15 | 55 | 7.4 | 114 | 15 | 566 | 76 | 35 | 4.8 |
| −1 to +1 SD | 6.4-26 | 1684 | 149 | 8.8 | 195 | 12 | 218 | 13 | 1322 | 79 | 65 | 3.9 | |
| >+1 SD | >26 | 329 | 23 | 7.0 | 67 | 20 | 44 | 13 | 276 | 84 | 17 | 5.2 | |
SD, standard deviation
Gestational weight gain z scores <−1, −1 to +1, and >+1 SD correspond to total gestational weight gains at 37 weeks gestation. Total weight gain ranges are the same for all grades of obesity because there is one z score chart for obese women (BMI ≥30 kg/m2)
Underweight (<18.5 kg/m2), normal weight (18.5–24.9 kg/m2), overweight (25–29.9 kg/m2), grade 1 obese (30–34.9 kg/m2), grade 2 obese (35–39.9 kg/m2), or grade 3 obese (≥40 kg/m2)
Figure 1 shows the confounder-adjusted curvilinear associations between gestational weight gain and adverse outcomes for each prepregnancy BMI group (CI have been removed for readability). Table 4 shows adjusted risk differences (95% CI) for these relations for 5 different weight gain values. Pregnancy weight gain was negatively associated with SGA and positively associated with LGA and cesarean delivery in all BMI groups. For example, among normal weight women, compared with a pregnancy weight gain equivalent to 20 kg at 37 weeks (z score of 0 SD), a weight gain of 27 kg at 37 weeks (z score of +1 SD) was associated with 2.2 fewer cases of SGA but 2.9 more cases of LGA and 3.7 more cases of cesarean delivery.
Figure 1.

Association between gestational weight gain z score and the adjusted predicted risks of five adverse perinatal outcomes, shown separately for women who are underweight (n=1,858, light orange lines), normal weight (n=26,011, purple lines), overweight (n=13,373, blue lines), grade 1 obese (n=7,153, green lines), grade 2 obese (n=3,684, yellow lines), or grade 3 obese (n=2,757, dark orange lines), Pennsylvania twin birth certificates, 2003–2013. The solid lines represent the point estimate. The 95% confidence bands have been removed for readability. Effect estimates that correspond to this figure appear in Table 4. Gestational weight gain z scores −2, −1, 0, 1, and 2 standard deviations correspond to the following total gestational weight gains at 37 weeks of gestation: 9.4, 14, 20, 27, and 37 kg for underweight and normal weight women; 5.5, 11, 18, 28, and 41 kg for overweight women; 0.9, 6.4, 14, 26, and 43 kg for women with grade 1, 2, or 3 obesity. Risks were set at the population average for maternal race or ethnicity, maternal education, maternal age, marital status, parity, insurance source, smoking during pregnancy, preexisting diabetes or hypertension, height, prepregnancy weight, infertility treatment, infant sex, neonatal care level of birth facility, year of birth, urban residence, and racial composition of neighborhood. Small for gestational age (A), large for gestational age (B), cesarean delivery (C), early preterm birth (<32 weeks of gestation) (D), and infant death (E).
Table 4.
Associations between gestational age z score and select adverse twin birth outcomes stratified by gestational weight gain z score and maternal prepregnancy body mass index, Pennsylvania twin birth certificates, 2003–2013.
| Gestational weight gain z score | Total gestational weight gain equivalent at 37 weeks, kg | Adjusted* number of excess cases† per 100 births (95% CI) | |||||
|---|---|---|---|---|---|---|---|
| Small-for-gestational-age birth | Large-for-gestational-age birth | Preterm birth <32 weeks | Cesarean delivery | Infant death | Neonatal death | ||
| Underweight‡ | |||||||
| −2 SD§ | 9.4 | 18 (9.3–26) | −3.2 (−5.8–−0.6) | 6.4 (−0.3–13) | −11 (−21–−0.5) | 0.5 (−2.3–3.2) | 0.8 (−1.6–3.2) |
| −1 SD | 14 | 7.2 (4.8–9.5) | −1.9 (−3.7–−0.1) | 1.3 (−0.8–3.3) | −4.8 (−9.2–−0.3) | −0.2 (−1.2–0.8) | −0.04 (−0.9–0.8) |
| 0 | 20 | 0 | 0 | 0 | 0 | 0 | 0 |
| 1 SD | 27 | −4.8 (−7.8–−1.8) | 2.1 (0.1–4.0) | 4.2 (2.0–6.5) | 1.6 (−2.7–5.9) | 2.1 (0.8–3.5) | 1.9 (0.7–3.2) |
| 2 SD | 37 | −8.1 (−14–−2.3) | 4.1 (−2.6–11) | 16 (6.6–26) | 1.0 (−10–12) | 9.0 (1.1–17) | 8.7 (0.7–17) |
| Normal weight | |||||||
| −2 SD | 9.4 | 7.1 (5.8–8.3) | −1.1 (−1.8–−0.3) | 3.9 (2.7–5.2) | −3.4 (−5.5–−1.2) | 1.0 (0.5–1.6) | 0.9 (0.3–1.4) |
| −1 SD | 14 | 4.3 (3.4–5.2) | −1.3 (−1.7–−0.9) | 2.2 (1.3–3.1) | −2.4 (−3.6–−1.1) | 0.6 (0.2–1.0) | 0.5 (0.1–0.8) |
| 0 | 20 | 0 | 0 | 0 | 0 | 0 | 0 |
| 1 SD | 27 | −2.2 (−2.8–−1.7) | 2.9 (2.3–3.6) | 0.4 (−0.3–1.1) | 3.7 (2.5–4.9) | 0.1 (−0.2–0.4) | 0.1 (−0.2–0.4) |
| 2 SD | 37 | −1.9 (−3.4–−0.5) | 6.3 (4.9–7.7) | 5.0 (3.2–6.9) | 7.8 (5.1–10) | 1.3 (0.5–2.2) | 1.2 (0.4–2.0) |
| Overweight | |||||||
| −2 SD | 5.5 | 3.8 (2.6–5.0) | −1.6 (−2.4–−0.8) | 2.7 (1.3–4.0) | −0.7 (−2.6–1.1) | 0.6 (−0.01–1.2) | 0.4 (−0.2–0.9) |
| −1 SD | 11 | 2.8 (1.8–3.8) | −1.6 (−2.1–−1.0) | 1.7 (0.6–2.7) | −1.1 (−2.6–0.4) | 0.3 (−0.20–0.8) | 0.1 (−0.3–0.5) |
| 0 | 18 | 0 | 0 | 0 | 0 | 0 | 0 |
| 1 SD | 28 | −2.1 (−2.9–−1.3) | 4.3 (3.1–5.5) | 0.3 (−0.7–1.4) | 3.3 (1.5–5.0) | 0.5 (−0.09–1.0) | 0.6 (0.1–1.1) |
| 2 SD | 41 | −0.5 (−2.7–1.8) | 7.7 (4.9–10) | 6.2 (2.9–9) | 6.3 (1.9–11) | 2.7 (0.9–4.6) | 2.6 (0.9–4.4) |
| Grade 1 Obese | |||||||
| −2 SD | 0.9 | 2.1 ( 1.5–2.7) | −3.3 (−5.8–−0.8) | 1.1 (0.2–2.0) | −1.6 (−4.3–1.2) | 0.2 (−0.4–0.8) | 0.1 (−0.5–0.7) |
| −1 SD | 6.4 | 1.1 (0.7–1.4) | −1.9 (−3.4–−0.5) | 0.4 (−0.07–0.8) | −1.1 (−2.3–0.2) | 0.03 (−0.2–0.3) | −0.01 (−0.3–0.3) |
| 0 | 14 | 0 | 0 | 0 | 0 | 0 | 0 |
| 1 SD | 26 | −1.5 (−2.8–−0.2) | 3.3 (2.3–4.3) | 1.0 (−0.4–2.5) | 3.6 (1.7–5.6) | 0.6 (−0.8–1.3) | 0.6 (−0.1–1.2) |
| 2 SD | 43 | −3.1 (−5.8–−0.4) | 8.7 (4.7–13) | 3.1 (−1.0–7.1) | 8.8 (3.6–14) | 1.8 (−0.4–4.1) | 1.7 (−0.4–3.7) |
| Grade 2 Obese | |||||||
| −2 SD | 0.9 | 1.3 (0.2–2.5) | −1.5 (−3.0–−0.1) | 0.9 (−0.02–1.7) | −2.4 (−4.8–0.01) | 0.4 (−0.1–0.9) | 0.3 (−0.1–0.8) |
| −1 SD | 6.4 | 1.0 (0.2–1.9) | −1.2 (−1.9–−0.6) | 0.2 (−0.5–0.8) | −1.7 (−2.9–−0.6) | 0.1 (−0.3–0.5) | 0.1 (−0.3–0.4) |
| 0 | 14 | 0 | 0 | 0 | 0 | 0 | 0 |
| 1 SD | 26 | −2.4 (−4.3–−0.5) | 4.3 (2.6–6.0) | 0.9 (−1.2–3.1) | 4.2 (1.3–7.2) | 0.3 (−0.9–1.5) | 0.3 (−0.8–1.4) |
| 2 SD | 43 | −4.6 (−7.9–−1.4) | 12 (6.1–18) | 2.3 (−2.9–7.6) | 9.5 (2.5–17) | 0.7 (−2.2–3.7) | 0.7 (−2.1–3.5) |
| Grade 3 Obese | |||||||
| −2 SD | 0.9 | 3.2 (1.4–4.9) | −2.3 (−3.1–−1.5) | 1.0 (−0.7–2.6) | −2.1 (−4.1–−0.2) | 0.04 (−0.7–0.7) | 0.3 (−0.4–1.0) |
| −1 SD | 6.4 | 2.3 (0.9–3.7) | −2.0 (−2.6–−1.4) | 0.4 (−0.9–1.8) | −1.2 (−2.7–0.3) | −0.2 (−0.7–0.4) | 0.04 (−0.5–0.6) |
| 0 | 14 | 0 | 0 | 0 | 0 | 0 | 0 |
| 1 SD | 26 | −1.5 (−2.2–−0.8) | 1.8 (1.1–2.5) | −0.5 (−1.4–0.5) | 1.1 (−0.04–2.3) | 0.05 (−0.4–0.5) | −0.1 (−0.5–0.3) |
| 2 SD | 43 | −5.2 (−7.4–−3.0) | 14 (6.6–20) | −0.7 (−5.7–4.3) | 3.3 (−3.1–9.7) | 1.4 (−1.7–4.6) | 0.4 (−2.1–3.0) |
| Grade 2 or Grade 3 Obese | |||||||
| −2 SD | 0.9 | 2.6 (1.2–3.9) | −1.8 (−2.5–−1.0) | 1.0 (−0.3–2.2) | −2.0 (−3.8–−0.3) | 0.2 (−0.4–0.7) | 0.3 (−0.2–0.9) |
| −1 SD | 6.4 | 1.9 (0.7–3.1) | −1.6 (−2.1–−1.1) | 0.4 (−0.6–1.5) | −1.2 (−2.4–0.1) | −0.1 (−0.5–0.4) | 0.1 (−0.4–0.6) |
| 0 | 14 | 0 | 0 | 0 | 0 | 0 | 0 |
| 1 SD | 26 | −3.2 (−4.9–−1.4) | 5.2 (3.0–7.3) | −0.3 (−2.9–2.3) | 1.7 (−1.5–4.9) | 0.6 (−0.7–2.0) | 0.2 (−1.2–1.4) |
| 2 SD | 43 | −5.6 (−8.1–−3.1) | 14 (6.8–22) | −0.5 (−6.1–5.0) | 3.6 (−3.4–11) | 1.6 (−1.9–5.1) | 0.5 (−2.3–3.2) |
SD, standard deviation
Adjusted for maternal race or ethnicity, maternal education, maternal age, marital status, parity, insurance source, smoking during pregnancy, pre-existing diabetes or hypertension, height, prepregnancy weight, infertility treatment, infant sex, neonatal care level of birth facility, year of birth, urban residence, and racial composition of neighborhood.
When the estimate is a negative value, it is the adjusted number of prevented cases per 100 births.
Underweight (<18.5 kg/m2), normal weight (18.5–24.9 kg/m2), overweight (25–29.9 kg/m2), grade 1 obese (30–34.9 kg/m2), grade 2 obese (35–39.9 kg/m2), or grade 3 obese (≥40 kg/m2)
Total weight gain ranges are the same for all grades of obesity because there is one z score chart for obese women (BMI ≥30 kg/m2)
Adjusted associations between gestational weight gain and preterm birth <32 weeks were U-shaped for all women except women with grade 2 or 3 obesity, among whom there was no association. An increased risk of infant death was observed for low weight gain among normal weight women (≤14 kg at 37 weeks [z score <−1 SD]) and for high weight gain among underweight (≥27 kg [z score +1 SD]), normal weight (≥37 kg [z score +2 SD]), and overweight women (≥41 kg [z score +2 SD]). Results were similar when we studied neonatal death (data available upon request).
Figure 2 shows associations between pregnancy weight gain and risk of outcomes simultaneously for women in each BMI category (grade 2 and 3 obesity are combined in Appendix 1). We overlaid the 2009 IOM provisional recommended total weight gain ranges for twins with vertical lines (underweight – no recommendation; normal weight 16.8–24.5 kg; overweight 14.1–22.7 kg; obese 11.3–19.1 kg). Within the IOM-recommended weight gain ranges for normal weight, overweight, and grade 1 obese women, there were meaningful declines in SGA risk and increases in LGA risk. Below the guidelines, risks of SGA, infant death (for normal weight women only), and preterm birth <32 weeks were elevated. At the upper limit of the IOM recommendations for these 3 BMI groups, the risk of SGA and LGA were approximately 10%, but weight gains greater than the upper cut-point were associated with increasing risk of preterm birth, infant death, and cesarean delivery. For women with severe obesity, weight gain below the provisional guidelines was associated with an elevated risk of SGA (adjusted predicted probabilities >12%), but not preterm birth or infant death. At gains higher than recommended, risk of LGA increased sharply. In sum, most excess risk was observed at weight gains more than 1 SD away from the mean: <14 kg or >27 kg in underweight or normal weight women, <11 kg or >28 kg in overweight women, and <6.4 kg or >26 kg in women with obesity.
Figure 2.
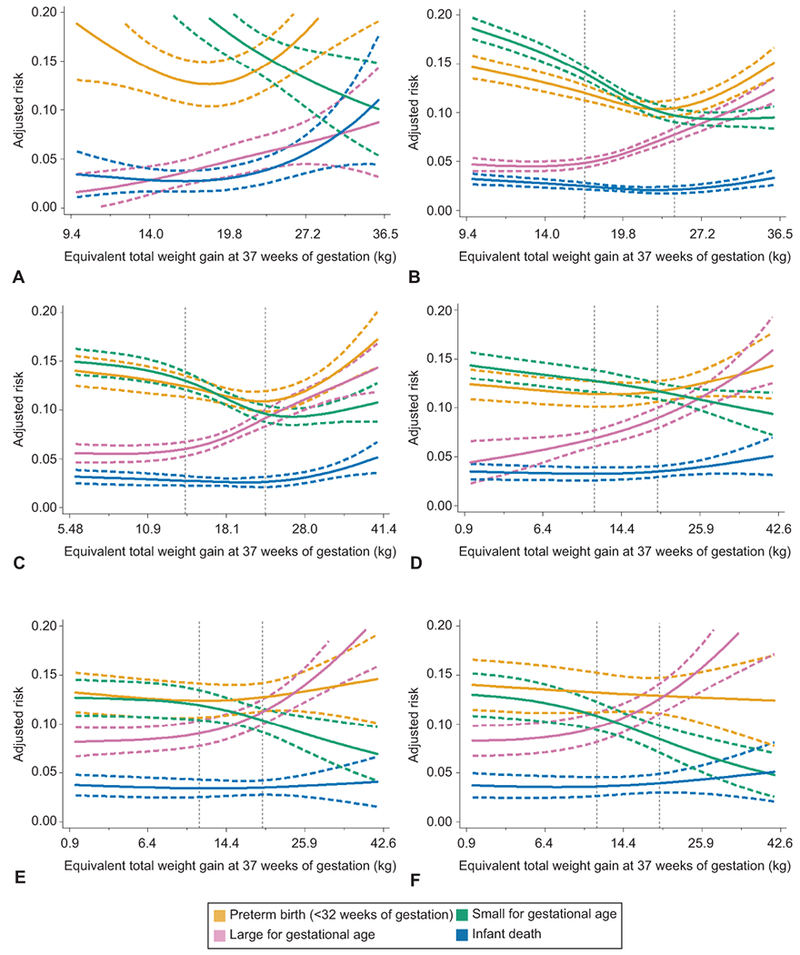
Adjusted predicted risks of four adverse perinatal outcomes by gestational weight gain z score among women with twin gestations who are underweight (n=1,858, A), normal weight (n=26,011, B), overweight (n=13,373, C), grade 1 obese (n=7,153, D), grade 2 obese (n=3,684, E), or grade 3 obese (n=2,757, F), Pennsylvania twin birth certificates, 2003–2013. The solid lines represent the point estimate and dashed lines represent its 95% confidence bands. Vertical dotted lines represent the current Institute of Medicine provisional gestational weight gain guidelines for twin pregnancies.8,11 Gestational weight gain z scores have been converted to equivalent total weight gain at 37 weeks of gestation on the y-axis. Tick marks and values of total weight gain are given for z scores of −2, −1, 0, 1, and 2 standard deviations. Risks were set at the population average for maternal race or ethnicity, maternal education, maternal age, marital status, parity, insurance source, smoking during pregnancy, preexisting diabetes or hypertension, height, prepregnancy weight, infertility treatment, infant sex, neonatal care level of birth facility, year of birth, urban residence, and racial composition of neighborhood.
There were no meaningful differences when we limited to sex-discordant twins, twins without congenital malformations, or twins with complete data (Appendix 2–4).
Our probabilistic bias analysis showed that measurement error in BMI and gestational weight gain on the birth certificate led to biases both away from the null and towards the null, but was unlikely to explain the aforementioned associations (Appendix 5), conditional on the accuracy of the bias model.
Discussion
In this population-based cohort of Pennsylvania twins, we found that very low weight gain was related to excess risk of SGA in all women and preterm birth <32 weeks and infant death in women without obesity, while very high weight gain is related to excess risks of LGA and cesarean delivery in all women and preterm birth <32 weeks and infant death in women without obesity. These associations remained after adjustment for many important confounding factors including race or ethnicity, smoking, socioeconomic status, and infertility treatment and were supported after a quantitative evaluation of bias due to measurement error in BMI and gestational weight gain.
It is difficult to compare our findings to existing literature on gestational weight gain in twins because published studies have suffered from serious limitations, including the use of small, highly-selected samples, lack of stratification by prepregnancy BMI or control for confounders (10). Studies of fetal growth in twins tended to use absolute measures of birth weight, which are problematic because this measure cannot separate infants who are small due to preterm delivery from infants who are small due to intrauterine growth restriction (40). Nevertheless, our findings of a negative association between gestational weight gain and SGA in all BMI groups is consistent with several (41–44) but not all (45,46) large studies in twins.
Importantly, published work on weight gain in twin pregnancies has used measures of weight gain that failed to account for the impact of the duration of pregnancy on weight gain. Our use of BMI-specific z score charts to classify gestational weight gain (15) untangles gestational duration from weight gain, thereby removing this bias (18).
In our study, gestational weight gain had a U-shaped association with preterm birth <32 weeks among women without severe obesity. Infant death was elevated with high weight gain among women without obesity and low weight gain only among normal weight women. In singleton pregnancies, U-shaped relations have been observed between gestational weight gain z score and preterm birth and infant death in non-obese women, but associations have been more variable among women with obesity (12,13,48–50). Our observation of elevated risks of LGA birth and cesarean delivery and reduced risk of SGA birth as gestational weight gain z score increased in each BMI group is consistent with a large body of evidence in singletons (8,51).
We found that very low weight gain (0.9 to 6.4 kg at 37 weeks) among women with severe obesity increased the risk of SGA birth, but was not associated with preterm birth or infant death (outcomes related to low weight gain in non-obese samples (8,13)). Only a single study from 1990 has reported associations between gestational weight gain and adverse outcomes in twin pregnancies with severe obesity, but inferences were limited by the sparse data from only 179 women (45). Research evaluating a wider range of outcomes is needed to understand the safety of low gestational weight gain among pregnant women with severe obesity and carrying twins (8,11). Poor perinatal outcomes rise as obesity becomes more severe (52,53), and optimal gestational weight gain may attenuate these risks. Further, prepregnancy BMI and gestational weight gain contribute to an intergenerational cycle of obesity (54).
We lacked data to evaluate chorionicity as a confounder or effect modifier. Although chorionicity affects twin perinatal outcomes, it is unknown whether it influences gestational weight gain. When we limited our sample to sex-discordant pairs, which are known to be dichorionic, inferences were similar. Our measure of infertility treatment was based on a single question in the birth record that underestimates actual use (55,56). There is likely incomplete control for confounding by assisted reproductive technologies.
We did not include gestational diabetes or preeclampsia as outcomes because these conditions may alter total gestational weight gain, and data on early-pregnancy weight gain were not available to avoid biases due to reverse causality. We also did not adjust for these pregnancy complications because they likely lie on the causal pathway, and therefore do not meet the definition of a confounder (57). Strong system level factors shape the management of twin gestations. For example, some hospitals preclude twins from delivering vaginally. Relations with cesarean delivery may not be relevant for all twin pregnancies. The birth certificate does not collect clinical data that would have allowed us to distinguish spontaneous from induced preterm births or to classify twins based on achievement of their growth potential. We have documented measurement error in prepregnancy weight, height, and weight at delivery on Pennsylvania birth records (36,37), but our bias analysis found little evidence to support misclassification as importantly influencing the results or inferences from our study. In the study period, twin birth rates and the distribution of maternal age and race or ethnicity in twin births were similar between Pennsylvania and the U.S.(58), which lends support to the generalizability of our results.
Lifestyle interventions can modify gestational weight gain and improve some outcomes in singletons (59–62). While some evidence suggests that women with twin gestations who participate in a dietary intervention program are more likely than non-participants to meet weight gain goals (63,64), randomized trials have not tested whether interventions in twin pregnancies can modify weight gain and adverse outcomes. As a result, the causality and the biological basis of associations between pregnancy weight gain and outcomes in twin gestations are unknown.
We found that weight gains well above or well below the IOM provisional guidelines (<14 kg or >27 kg in underweight or normal weight women, <11 kg or >28 kg in overweight women, and <6.4 kg or >26 kg in women with obesity) were associated with the highest risk of adverse outcomes and that nearly 1 in 3 women had such weight gains. If the associations we observed are even partially reflective of causality, then targeted modification of pregnancy weight gain in women carrying twins might improve pregnancy outcomes. Data on a wide range of short- and long-term outcomes and information on the relative seriousness of these outcomes is needed to determine optimal gestational weight gain ranges for twin pregnancies.
Supplementary Material
Acknowledgments
Sources of Funding: This project was supported by NIH grants R21 HD067851 and R01 NR014245. The funders had no role in the study design, data collection and analysis, decision to publish, or preparation of the manuscript.
Financial Disclosure
Cara L. Eckhardt disclosed receiving funds paid to her institution from University of Pittsburgh. The other authors did not report any potential conflicts of interest.
References
- 1.Martin JA, Hamilton BE, Osterman MJK. Three decades of twin births in the United States, 1980–2009 NCHS data brief, no 80. Hyattsville, MD: National Center for Health Statistics, 2012. [PubMed] [Google Scholar]
- 2.Martin JA, Hamilton BE, Osterman MJK, Driscoll AK, Drake P. Births: Final Data for 2017. National Vital Statistics Reports 2018; 67(8): 1–50. [PubMed] [Google Scholar]
- 3.MacDorman MF, Gregory EC. Fetal and Perinatal Mortality: United States, 2013. National Vital Statistics Reports 2015; 64(8): 1–24. [PubMed] [Google Scholar]
- 4.Matthews TJ, MacDorman MF, Thoma ME. Infant Mortality Statistics From the 2013 Period Linked Birth/Infant Death Data Set. National Vital Statistics Reports 2015; 64(9): 1–30. [PubMed] [Google Scholar]
- 5.Luke B, Brown MB. Contemporary risks of maternal morbidity and adverse outcomes with increasing maternal age and plurality. Fertility and Sterility 2007; 88(2): 283–93. [DOI] [PMC free article] [PubMed] [Google Scholar]
- 6.CDC. QuickStats: Percentage of live births by cesarean delivery, by plurality--United States, 1996, 2000, 2006. MMWR 2009; 58(9): 542. [Google Scholar]
- 7.Viswanathan M, Siega-Riz AM, Moos MK, Deierlein A, Mumford S, Knaack J, Thieda P, Lux LJ, Lohr KN. Outcomes of maternal weight gain. Evid Rep Technol Assess (Full Rep) 2008(168): 1–223. [PMC free article] [PubMed] [Google Scholar]
- 8.Institute of Medicine. Weight Gain During Pregnancy: Reexamining the Guidelines. Washington, DC: National Academies Press, 2009. [PubMed] [Google Scholar]
- 9.Institute of Medicine. Nutrition during Pregnancy. Washington, D.C.: National Academy Press, 1990. [Google Scholar]
- 10.Bodnar LM, Pugh SJ, Abrams B, Himes KP, Hutcheon JA. Gestational weight gain in twin pregnancies and maternal and child health: a systematic review. Journal of Perinatology 2014; 34(4): 252–63. [DOI] [PMC free article] [PubMed] [Google Scholar]
- 11.ACOG Committee opinion no. 548: weight gain during pregnancy. Obstet Gynecol 2013; 121(1): 210–2. [DOI] [PubMed] [Google Scholar]
- 12.Bodnar LM, Pugh SJ, Lash TL, Hutcheon JA, Himes KP, Parisi SM, Abrams B. Low gestational weight gain and risk of adverse perinatal outcomes in obese and severely obese women. Epidemiology 2016; 27(6): 894–902. [DOI] [PMC free article] [PubMed] [Google Scholar]
- 13.Bodnar LM, Siminerio LL, Himes KP, Hutcheon JA, Lash TL, Parisi SM, Abrams B. Maternal obesity and gestational weight gain are risk factors for infant death. Obesity (Silver Spring) 2015; 24(2): 490–8. [DOI] [PMC free article] [PubMed] [Google Scholar]
- 14.Practice Bulletin No. 169: Multifetal Gestations: Twin, Triplet, and Higher-Order Multifetal Pregnancies. Obstet Gynecol 2016; 128(4): e131–46. [DOI] [PubMed] [Google Scholar]
- 15.Hutcheon JA, Platt RW, Abrams B, Braxter BJ, Eckhardt CL, Himes KP, Bodnar LM. Pregnancy Weight Gain by Gestational Age in Women with Uncomplicated Dichorionic Twin Pregnancies. Paediatr Perinat Epidemiol 2018. [DOI] [PMC free article] [PubMed] [Google Scholar]
- 16.Grantz KL, Grewal J, Albert PS, Wapner R, D’Alton ME, Sciscione A, Grobman WA, Wing DA, Owen J, Newman RB, Chien EK, Gore-Langton RE, Kim S, Zhang C, Buck Louis GM, Hediger ML. Dichorionic twin trajectories: the NICHD Fetal Growth Studies. Am J Obstet Gynecol 2016; 215(2): 221 e1–221 e16. [DOI] [PMC free article] [PubMed] [Google Scholar]
- 17.WHO Consultation on Obesity, Obesity: Preventing and Managing the Global Epidemic. 2000, World Health Organization: Geneva, Switzerland. [PubMed] [Google Scholar]
- 18.Hutcheon JA, Bodnar LM. Good Practices for Observational Studies of Maternal Weight and Weight Gain in Pregnancy. Paediatr Perinat Epidemiol 2018. [DOI] [PMC free article] [PubMed] [Google Scholar]
- 19.Hutcheon JA, Bodnar LM, Joseph KS, Abrams B, Simhan HN, Platt RW. The bias in current measures of gestational weight gain. Paediatric and Perinatal Epidemiology 2012; 26: 109–116. [DOI] [PMC free article] [PubMed] [Google Scholar]
- 20.Chen HY, Chauhan SP. Risk of Neonatal and Infant Mortality in Twins and Singletons by Gestational Age. Am J Perinatol 2019; 36(8): 798–805. [DOI] [PubMed] [Google Scholar]
- 21.CDC National Center for Health Statistics, Birth Edit Specifications for the 2003 Proposed Revision of the U.S. Standard Certificate of Birth http://www.cdc.gov/nchs/data/dvs/birth_edit_specifications.pdf. 2003.
- 22.Ultrasound in pregnancy. Practice Bulletin No. 175. American College of Obstetricians and Gynecologists. Obstet Gynecol 2016;128:e241–56. [DOI] [PubMed] [Google Scholar]
- 23.USDA Economic Research Service. Rural-Urban Comtinuum Codes 2013. May 10, 2013 May 5, 2014]; Available from: http://www.ers.usda.gov/data-products/rural-urban-continuum-codes.aspx#.U7WgCvldUg0.
- 24.US Census Bureau. Census 2000, Summary File 3, Table P006, generated by Sarah Pugh using American FactFinder. <http://factfinder2.census.gov/>>; (13 February 2015)
- 25.Stark AR. Levels of neonatal care. Pediatrics 2004; 114(5): 1341–7. [DOI] [PubMed] [Google Scholar]
- 26.Royston P Multiple imputation of missing values: Further update of ice, with an emphasis on categorical variables. Stata Journal 2009; 9(3): 466–477. [Google Scholar]
- 27.Sterne JA, White IR, Carlin JB, Spratt M, Royston P, Kenward MG, Wood AM, Carpenter JR. Multiple imputation for missing data in epidemiological and clinical research: potential and pitfalls. BMJ 2009; 338: b2393. [DOI] [PMC free article] [PubMed] [Google Scholar]
- 28.Allison PD. Handling Missing Data by Maximum Likelihood SAS Global Forum 2012: Paper 312–2012. [Google Scholar]
- 29.Enders CK. Applied Missing Data Analysis. New York: Guilford Press, 2010. [Google Scholar]
- 30.Eddings W, Marchenko Y. Diagnostics for multiple imputation in Stata. Stata Journal 2012; 12(3): 353–367. [Google Scholar]
- 31.Zou GY, Donner A. Extension of the modified Poisson regression model to prospective studies with correlated binary data. Stat Methods Med Res 2013; 22(6): 661–70. [DOI] [PubMed] [Google Scholar]
- 32.Petersen MR, Deddens JA. A comparison of two methods for estimating prevalence ratios. BMC medical research methodology 2008; 8: 9. [DOI] [PMC free article] [PubMed] [Google Scholar]
- 33.Carlin JB, Gurrin LC, Sterne JA, Morley R, Dwyer T. Regression models for twin studies: a critical review. Int J Epidemiol 2005; 34(5): 1089–99. [DOI] [PubMed] [Google Scholar]
- 34.Harrell FE Jr., Lee KL, Pollock BG. Regression models in clinical studies: determining relationships between predictors and response. Journal of the National Cancer Institute 1988; 80(15): 1198–202. [DOI] [PubMed] [Google Scholar]
- 35.Shrier I, Platt RW. Reducing bias through directed acyclic graphs. BMC medical research methodology 2008; 8: 70. [DOI] [PMC free article] [PubMed] [Google Scholar]
- 36.Bodnar LM, Abrams B, Bertolet M, Gernand AD, Parisi SM, Himes KP, Lash TL. Validity of birth certificate-derived maternal weight data. Paediatric and Perinatal Epidemiology 2014; 28(3): 203–12. [DOI] [PMC free article] [PubMed] [Google Scholar]
- 37.Bodnar LM, Abrams B, Siminerio L, Lash TL. Validity of birth certificate-derived maternal weight data in twin pregnancies. Maternal & child nutrition 2016; 12(3): 632–8. [DOI] [PMC free article] [PubMed] [Google Scholar]
- 38.Lash TL, Abrams B, Bodnar LM. Comparison of bias analysis strategies applied to a large data set. Epidemiology 2014; 25(4): 576–82. [DOI] [PMC free article] [PubMed] [Google Scholar]
- 39.Lash TL, Fink AK. Semi-automated sensitivity analysis to assess systematic errors in observational data. Epidemiology 2003; 14(4): 451–8. [DOI] [PubMed] [Google Scholar]
- 40.Arnold CC, Kramer MS, Hobbs CA, McLean FH, Usher RH. Very low birth weight: a problematic cohort for epidemiologic studies of very small or immature neonates. American Journal of Epidemiology 1991; 134(6): 604–13. [DOI] [PubMed] [Google Scholar]
- 41.Chu SY, D’Angelo DV. Gestational weight gain among US women who deliver twins, 2001–2006. American Journal of Obstetrics & Gynecology 2009; 200(4): 390.e1-6. [DOI] [PubMed] [Google Scholar]
- 42.Gonzalez-Quintero VH, Kathiresan A, Tudela FJ, Rhea D, Istwan N. The association of gestational weight gain and pre-pregnancy body mass index on outcomes of twin pregnancies. Reproductive Sciences 2011; 18(3): 177A. [DOI] [PubMed] [Google Scholar]
- 43.Gavard JA, Artal R. Gestational weight gain and maternal and neonatal outcomes in term twin pregnancies in obese women. Twin Research & Human Genetics: the Official Journal of the International Society for Twin Studies 2014; 17(2): 127–33. [DOI] [PubMed] [Google Scholar]
- 44.Ozcan T, Bacak SJ, Zozzaro-Smith P, Li D, Sagcan S, Seligman N, Glantz CJ. Assessing Weight Gain by the 2009 Institute of Medicine Guidelines and Perinatal Outcomes in Twin Pregnancy. Matern Child Health J 2017; 21(3): 509–515. [DOI] [PubMed] [Google Scholar]
- 45.Brown JE, Schloesser PT. Prepregnancy weight status, prenatal weight gain, and the outcome of term twin gestations. American Journal of Obstetrics & Gynecology 1990; 162(1): 182–6. [DOI] [PubMed] [Google Scholar]
- 46.Fox NS, Saltzman DH, Kurtz H, Rebarber A. Excessive weight gain in term twin pregnancies: examining the 2009 Institute of Medicine definitions. Obstetrics & Gynecology 2011; 118(5): 1000–4. [DOI] [PubMed] [Google Scholar]
- 47.Bodnar LM, Hutcheon JA, Parisi SM, Pugh SJ, Abrams B. Comparison of gestational weight gain z-scores and traditional weight gain measures in relation to perinatal outcomes. Paediatr Perinat Epidemiol 2015; 29(1): 11–21. [DOI] [PMC free article] [PubMed] [Google Scholar]
- 48.Hutcheon JA, Bodnar LM. A systematic approach for establishing the range of recommended weight gain in pregnancy. Am J Clin Nutr 2014; 100(2): 701–7. [DOI] [PMC free article] [PubMed] [Google Scholar]
- 49.Leonard SA, Hutcheon JA, Bodnar LM, Petito LC, Abrams B. Gestational Weight Gain-for-Gestational Age Z-Score Charts Applied across U.S. Populations. Paediatr Perinat Epidemiol 2018; 32(2): 161–171. [DOI] [PMC free article] [PubMed] [Google Scholar]
- 50.Leonard SA, Petito LC, Stephansson O, Hutcheon JA, Bodnar LM, Mujahid MS, Cheng Y, Abrams B. Weight gain during pregnancy and the black-white disparity in preterm birth. Ann Epidemiol 2017; 27(5): 323–328 e1. [DOI] [PMC free article] [PubMed] [Google Scholar]
- 51.Goldstein RF, Abell SK, Ranasinha S, Misso M, Boyle JA, Black MH, Li N, Hu G, Corrado F, Rode L, Kim YJ, Haugen M, Song WO, Kim MH, Bogaerts A, Devlieger R, Chung JH, Teede HJ. Association of Gestational Weight Gain With Maternal and Infant Outcomes: A Systematic Review and Meta-analysis. JAMA 2017; 317(21): 2207–2225. [DOI] [PMC free article] [PubMed] [Google Scholar]
- 52.Siega-Riz AM, King JC. Position of the American Dietetic Association and American Society for Nutrition: obesity, reproduction, and pregnancy outcomes. J Am Diet Assoc 2009; 109(5): 918–27. [DOI] [PubMed] [Google Scholar]
- 53.Catalano PM. Management of obesity in pregnancy. Obstet Gynecol 2007; 109(2 Pt 1): 419–33. [DOI] [PubMed] [Google Scholar]
- 54.Perez-Escamilla R, Kac G. Childhood obesity prevention: a life-course framework. Int J Obes Suppl 2013; 3(Suppl 1): S3–S5. [DOI] [PMC free article] [PubMed] [Google Scholar]
- 55.Luke B, Brown MB, Spector LG. Validation of infertility treatment and assisted reproductive technology use on the birth certificate in eight states. Am J Obstet Gynecol 2016; 215(1): 126–7. [DOI] [PMC free article] [PubMed] [Google Scholar]
- 56.Zhang Z, Macaluso M, Cohen B, Schieve L, Nannini A, Chen M, Wright V. Accuracy of assisted reproductive technology information on the Massachusetts birth certificate, 1997–2000. Fertil Steril 2010; 94(5): 1657–61. [DOI] [PubMed] [Google Scholar]
- 57.Cole SR, Hernan MA. Falliability in estimating direct effects. Int J Epidemiol 2002; 31: 163–165. [DOI] [PubMed] [Google Scholar]
- 58.United States Department of Health and Human Services (US DHHS), Centers for Disease Control and Prevention (CDC), National Center for Health Statistics (NCHS), Statistics DoV. Natality public-use data 2003–2006, on CDC WONDER Online Database. 2009.
- 59.Effect of diet and physical activity based interventions in pregnancy on gestational weight gain and pregnancy outcomes: meta-analysis of individual participant data from randomised trials. BMJ 2017; 358: j3119. [DOI] [PMC free article] [PubMed] [Google Scholar]
- 60.Shieh C, Cullen DL, Pike C, Pressler SJ. Intervention strategies for preventing excessive gestational weight gain: systematic review and meta-analysis. Obes Rev 2018; 19(8): 1093–1109. [DOI] [PubMed] [Google Scholar]
- 61.Bennett CJ, Walker RE, Blumfield ML, Gwini SM, Ma J, Wang F, Wan Y, Dickinson H, Truby H. Interventions designed to reduce excessive gestational weight gain can reduce the incidence of gestational diabetes mellitus: A systematic review and meta-analysis of randomised controlled trials. Diabetes Res Clin Pract 2018; 141: 69–79. [DOI] [PubMed] [Google Scholar]
- 62.Thangaratinam S, Rogozinska E, Jolly K, Glinkowski S, Roseboom T, Tomlinson JW, Kunz R, Mol BW, Coomarasamy A, Khan KS. Effects of interventions in pregnancy on maternal weight and obstetric outcomes: meta-analysis of randomised evidence. BMJ 2012; 344: e2088. [DOI] [PMC free article] [PubMed] [Google Scholar]
- 63.Luke B, Brown MB, Misiunas R, Anderson E, Nugent C, van de Ven C, Burpee B, Gogliotti S. Specialized prenatal care and maternal and infant outcomes in twin pregnancy. American Journal of Obstetrics & Gynecology 2003; 189(4): 934–8. [DOI] [PubMed] [Google Scholar]
- 64.Dubois S, Dougherty C, Duquette MP, Hanley JA, Moutquin JM. Twin pregnancy: the impact of the Higgins Nutrition Intervention Program on maternal and neonatal outcomes. Am J Clin Nutr 1991; 53(6): 1397–403. [DOI] [PubMed] [Google Scholar]
Associated Data
This section collects any data citations, data availability statements, or supplementary materials included in this article.