Abstract
Chronic diseases have spread around the world. Cardiovascular diseases (CVD), the most important of the chronic diseases and the leading cause of death in women of Mashhad, are impacted by environmental factors. Urban green spaces (UGSs) are important environmental factors playing a critical role in the prevention and control of CVD. Spatial analysis is useful in understanding the application of UGSs in CVD prevention. To identify the spatial distribution of CVD in Mashhad, Moran’s index was used and 7539 home addresses of female patients with CVD were imported into ArcMap. Moran’s coefficient was estimated to be 0.34, revealing a clustered distribution of CVD. The spatial autocorrelation between CVD and UGSs was analyzed using Moran’s I. Moran’s I index value was calculated to be − 0.15, and four types of clusters were identified in eight sub-districts of Mashhad municipality. To find the factors influencing the presence in UGSs among women affected by CVD, 607 female patients living in the selected sub-districts were asked to take part in a telephone survey. Data were analyzed using ordinary least squares (OLS) and geographically weighted regression (GWR) at block level (343 statistical blocks in total). Accordingly, the spatial diversity and effects of three variables of income, level of education, and access to UGSs among female patients with CVD were measured. According to OLS results and the standard residual, two clusters were removed. Finally, vulnerable blocks were identified that could be helpful in the development of prevention policies and place-based interventions.
Keywords: Cardiovascular disease, Mashhad, Spatial distribution, Spatial analysis, Urban green space
Introduction
Disease outbreaks around the world have shifted dramatically from infectious to chronic diseases. CVDs are the most common chronic diseases and are associated with an unhealthy lifestyle facilitated by urban life and environmental factors [1, 2]. It is of great importance to identify vulnerable populations and develop strategies for CVD risk reduction. The most effective strategy for the prevention and control of this disease is the utilization of environmental resources [3–6].
UGSs are one of the key environmental resources for the prevention and control of CVD [7–9]. UGSs through reducing harmful effects of air [10, 11] and noise pollution [12, 13], promoting physical activities [14, 15] and psychological recovery [16–18], and encouraging social interactions [19, 20] influence the cardiovascular system.
There are gender differences in the diagnosis and treatment of CVD as it is the leading cause of death among women worldwide [21–23]. The relationship between the presence of UGSs and CVD occurrence even differs from men to women [24–26]. A study in Australia indicated that green spaces reduced the risk of obesity and overweight in women but not in men [27]. Another study in the UK demonstrated that increased green spaces decreased the number of deaths from CVD among men. Although no difference existed between men and women in terms of use of UGSs, no statistically significant relationship was found between the quantity of green spaces and the number of deaths among women [28]. Tamosiunas and colleagues [26] found that park users were less likely to suffer from CVD and the risk of cardiovascular disease in women who have less access to parks is higher. Similarly, a study in New Zealand reported a lower risk of CVD for people living in areas with greater access to green spaces. This result remained unchanged even after adjusting the physical activity level [29]. A study in two cities of Iran (Rasht and Ardabil) showed that physical activity is the most common reason for people using parks [30]. However, as more men than women use urban green spaces, they are more likely to engage physical activities [31]. Therefore, there is a greater need to study women’s health because women have a powerful influence on health and well-being of the future generation [32].
In countries such as China and the USA, there are many cities devising strategies for increasing green spaces, especially in deprived neighborhoods [33], but there are various factors influencing on presence in UGSs. One study in the Netherlands showed that individuals with lower levels of education were more likely to take advantage of the health benefits of green spaces and used UGSs more compared with people with higher levels of education [34]. In contrast, another study revealed that people with lower levels of education were less likely to use UGSs compared with individuals with higher education levels [35]. It is argued that individuals with higher levels of education may have a better knowledge of the benefits of interacting with nature [36]. Among other socioeconomic variables, education has more effect on cardiovascular health [37]. Economic status of individuals strongly influences their presence in UGSs [38]. Some studies showed that people of lower economic status have appropriate access to parks [39, 40], which means that people living in low-income neighborhoods are more willing to use them [41]. A study claimed that the beneficial effect of green spaces on CVD is higher for people of lower economic status [20]. However, this is not certain because of the variety of factors affecting cardiovascular health.
Another factor that affects the presence in UGSs is distance [42, 43]. Appropriate access to green spaces is critical for providing a foundation for healthy living in urban areas [44] and access to green spaces is essential for women’s health [26]. The closer green spaces are, the more they are used [5, 35, 45]. Studies demonstrated that any decrease in economic inequality in access to green spaces could contribute to a decrease in health disparities [46].
Most studies in the context of health and UGSs have been conducted in Europe and the USA [47]. However, in many low-income countries like Iran, which are experiencing a high rate of urbanization, no studies have been carried out and consequently, the health benefits of UGSs and the ways to encourage their use have never been considered. In the Middle East, due to discrimination against women and limits on their personal freedom, obesity affects more women than men [48]. Around 60% of Iranian women have a high risk of obesity and, consequently, CVD because of lack of physical activity. Based on the statistical yearbook of Mashhad (2016), CVD is the main reason for death in women of Mashhad.
Geographic information system (GIS) can be a useful tool for solving health issues [49–51]. Spatial analysis and its techniques like spatial autocorrelation and GWR facilitate the study of factors associated with CVD. They are also able to find areas in which environmental interventions are required [6, 52, 53]. Geospatial tools for mapping disease, predicting disease occurrence, and allocating health resources have been used in many studies [51, 54–58]. However, in Iran, geospatial tools have never been applied in studying CVD. Additionally, the relationship between CVD occurrence and urban spaces has never been considered.
Identification of populations affected by certain diseases could be a useful instrument for planning, monitoring, and evaluation [59]. Moreover, it is important to identify spatial clusters as they can facilitate planning for green open spaces and enable the use of health benefits of green spaces with the aim of prevention and control of CVD which have great social and economic influences. This study aims to: (1) understanding the spatial distribution of women affected by CVD in Mashhad, (2) analyzing spatial autocorrelation between CVD and UGSs, and (3) conducting a spatial analysis of influential factors on presence in UGSs among women affected by CVD.
Methodology
This work only studied women aged between 16 and 64 because for women in this age group (16–64), social-spatial inequalities are at their highest level [28]. Women aged over 64 were excluded because they have specific requirements and should be studied independently.
Study Area
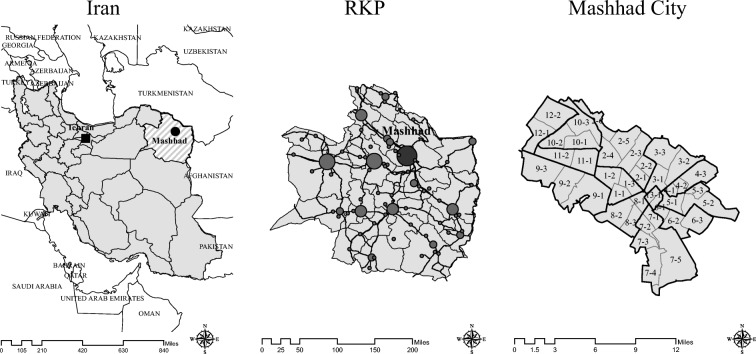
The study area is Mashhad city. Mashhad is the capital of Razavi Khorasan Province (RKP), situated in the North East of Iran (Fig. 1). It is the second most populous city of Iran with a population of 3,001,184 (with 49% females and 51% males) in 2016.
Fig 1.
Location of Mashhad city
Because of the existence of the Imam Reza holy shrine, Mashhad is the center of religious tourism in Iran and it is the second holiest city for Muslims after Mecca in Saudi Arabia. Over 20 million tourists travel to Mashhad every year.
The city is 35,147 ha in area. Green spaces including parks, groves, gardens, natural reserves, and agricultural lots account for 12.4%, 4359 ha, of total urban land area. Mashhad is composed of 13 (administrative) districts and 41 (administrative) sub-districts.
Health Data
CVD is the leading cause of death among women in Mashhad, based on the statistical yearbook of Mashhad (2016), with 38% of deaths in females in 2017. To analyze the spatial distribution of CVD, data was obtained from three major hospitals in Mashhad. We received the home addresses and profiles of female patients hospitalized for CVD in 2016 and 2017, in Microsoft Excel format. The data were imported into ArcMap point data layer. In total, 7539 home addresses were imported from Excel into ArcMap and the spatial distribution of Mashhad female patients with CVD was obtained.
The patients were classified based on the International Statistical Classification of Diseases and Related Health Problems (ICD-10) and were coded from I20–I25 and from I60–I69. The most frequent are I20.0, I25.1, I21.0, I21.1, I21.4, I64, I61, and I60.9.
Urban Green Space Data
Green spaces were measured using satellite imagery or land cover datasets [4]. Some studies estimate green areas based on satellite imagery, using normalized difference vegetation index (NDVI) [20, 60, 61]. NDVI takes into account areas of land covered by parks, public gardens, sports fields, and forests, etc. Sports fields such as football grounds and private gardens should be excluded from analysis because they have limited use [44]. Therefore, land cover layers seem to be much more helpful than satellite imagery in this area of study [4].
In this paper, green spaces are defined as areas or places that provide recreational facilities and services for public use [56]. According to this definition and considering the fact that the park size can influence the frequency presence in park and physical activities [62, 63], this paper studied urban parks which were above 1 ha in area and have at least 65% of their land covered by trees. In urban planning of Iran, urban parks are categorized by size into four types:
Urban parks at district level, including parks that are between 4 and 5 ha in area.
Urban parks at sub-district level, including parks that are between 1 and 4 ha in area.
Urban parks at neighborhood level, including parks between 0.5 and 1 ha in area.
Urban parks at sub-neighborhood level, including parks that are below 0.5 ha in area.
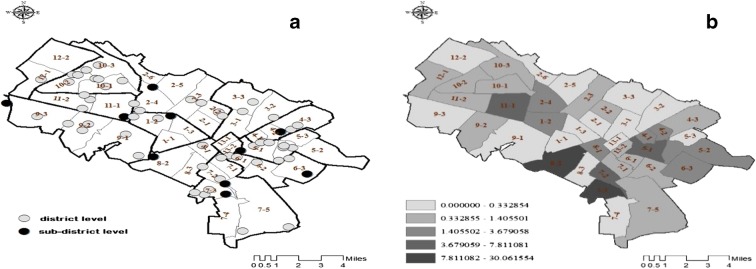
This study only considers urban parks at micro-neighborhood (district and sub-district) levels (Fig. 2).
Fig. 2.
Urban parks at district and sub-district levels. a Park distribution. b Parks per capita
Seven sub-districts, including district one sub-district three (1-3), 12-2, 13-1, 2-6, 2-5, 2-1, 3-1, lack urban parks at micro-neighborhood (district and sub-district) level.
Accessibility to Urban Green Space
Methods for measuring accessibility to parks vary between studies. However, most studies measured accessibility to green spaces using ArcGIS. Some used network analysis [64, 65] and others applied the Euclidean distance method for calculating accessibility [5].
The standard distance threshold for considering a green space easily accessible is 300 to 400 m [35]. According to Lee and colleagues [66], accessible distance to green spaces is below 0.5 km or a 5-min walk. Some other studies defined a 15-min walk or 900 to 1000 m as a standard green space distance threshold [62]. To calculate distance to open spaces, the network analysis method is more accurate because it considers the real road network [67, 68]. In this study, due to limitations such as incompleteness of the map layer of secondary streets and alleys, Euclidean distance was used for calculating accessibility.
Spatial Analysis
To analyze the spatial distribution of female patients with CVD, Moran’s I analysis was used [69], and to explore the spatial relationship between two variables of UGSs and CVD, Moran’s autocorrelation index was used. Moran’s I analysis is a type of spatial analysis mapping spatial relationships between two sets of variables [5].
Factors influencing presence in UGSs by women with CVD were identified by OLS and GWR. GWR reflects spatial relations and the heterogeneity of regions [70]. It also estimates the impact of explanatory variables on dependent variables and through mapping results, it contributes to planning [50, 64]. It makes planning easier as it provides a better understanding of the spatial distribution and the relationships between sets of variables, which is important for better interventions in the future [70]. In this study, spatial autocorrelation, OLS, and GWR were measured using ArcGIS and GeoDa software.
Variables Obtained Using the Questionnaire
When the spatial autocorrelation between female patients with CVD and UGSs had been measured, eight sub-districts of Mashhad municipality were selected for survey. Six hundred twenty women with cardiovascular disease who had been living in these eight sub-districts were selected and asked to complete the questionnaires. They were asked questions about levels of education, levels of income, and presence in urban parks. Presence in urban parks by women was measured by self-reporting [41, 63]. Participants were asked about the frequency they used urban parks on a scale of: at least once a day, 3–6 times per week, 1–2 times per week, 2–3 times per month, once a month, and never [41]. Thirteen respondents were removed from the analysis because they did not use parks at micro-neighborhood (district and sub-district) level.
Results
Spatial Distribution of Women Affected by CVD in Mashhad
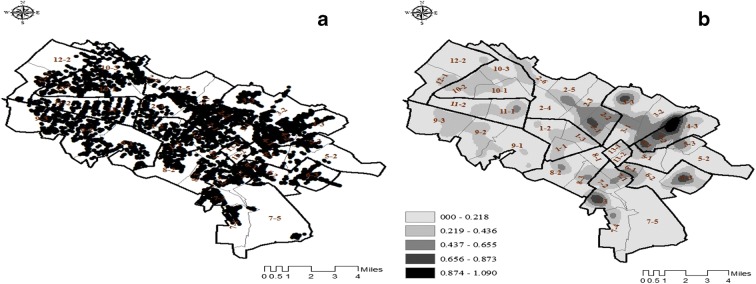
To find the spatial distribution of women with CVD, 7539 home addresses were imported into ArcGIS software (Fig. 3).
Fig. 3.
a Spatial distribution. b Density map of women affected by CVD
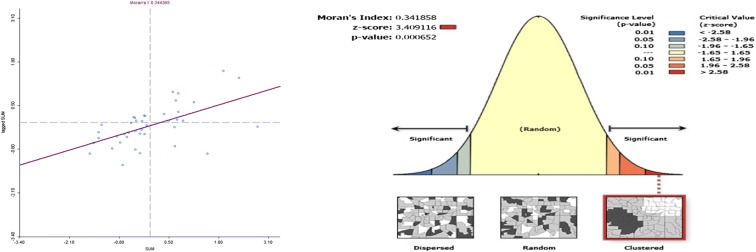
CVD occurrence was analyzed for all sub-districts. The results showed that the density of women affected by CVD was at the highest level in sub-districts 3-3, 4-3, 5-3, and 7-3. For a better understanding of the spatial distribution of CVD, Moran’s index was used and calculated using both ArcGIS and GeoDa software. As can be seen in Fig. 4, Moran’s I value was estimated to be 0.34 and a clustered pattern for CVD distribution was found.
Fig. 4.
Moran’s coefficient in spatial autocorrelation analysis of CVD
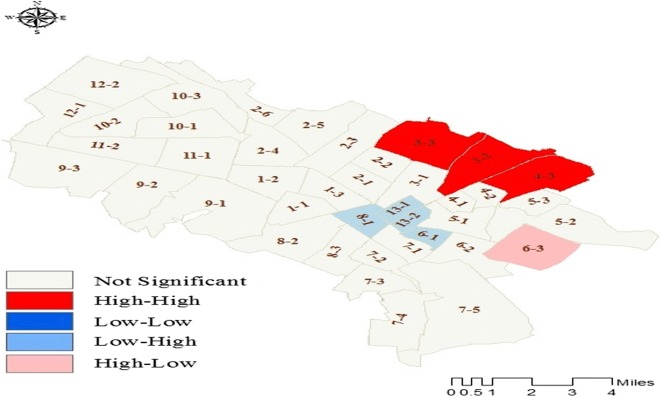
Figure 5 indicates the clustered distribution of CVD in Mashhad. Three types of clusters were found.
Fig. 5.
Analysis of spatial autocorrelation of CVD in Mashhad
The High-High (HH) cluster type was composed of three sub-districts, accounting for 13.39% of all female patients with CVD. There were three sub-districts in the Low-High (LH) cluster type, which accounted for 4.8% of total women with CVD. One sub-district, with 3.9% of total women with CVD, was in the High-Low (HL) cluster type. No Low-Low (LL) cluster type occurred.
Analysis of Spatial Autocorrelation Between CVD and UGSs
According to Fig. 2, seven sub-districts of Mashhad municipality lacked urban parks at micro-neighborhood (districts and sub-districts) level. To analyze spatial autocorrelation between CVD and UGSs, Moran’s I spatial autocorrelation test was employed. Figure 6 shows a negative correlation between CVD and UGSs with a coefficient of correlation of − 0.15.
Fig. 6.
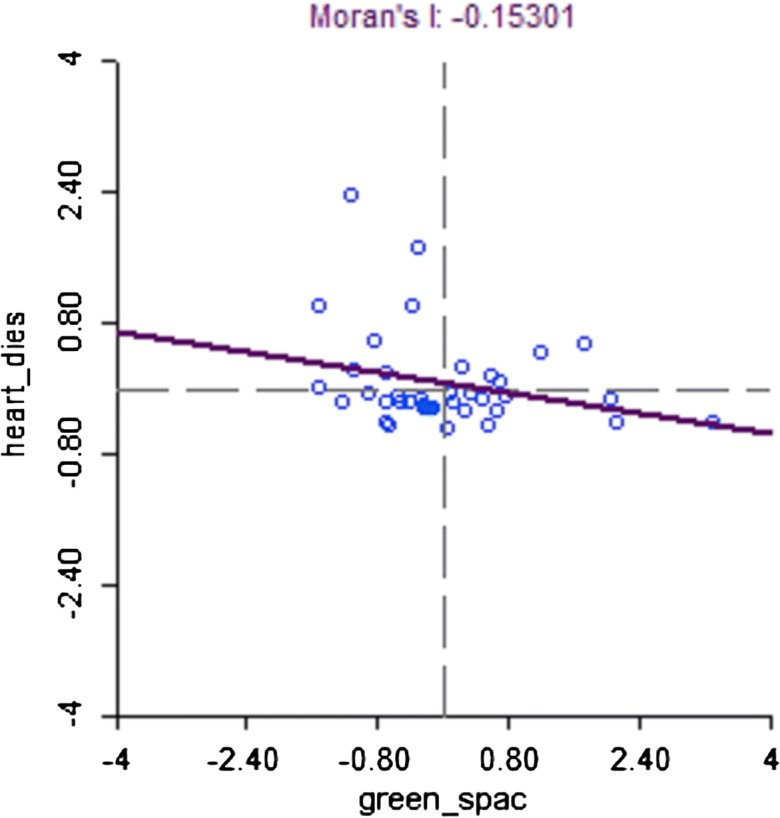
Moran’s I spatial autocorrelation coefficient
This indicates that if parks (at district and sub-district level) per capita increases, CVD occurrence among women decreases.
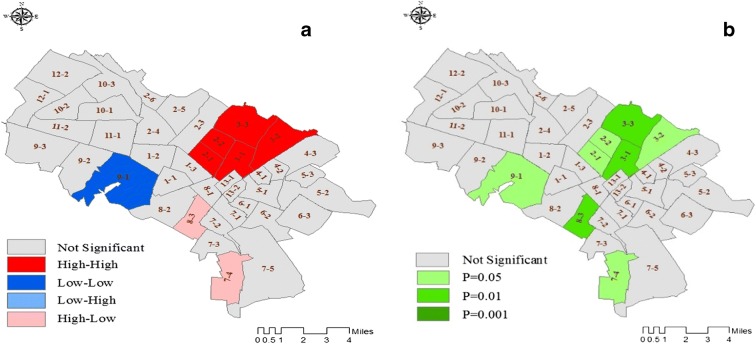
In total, three clusters were identified (Fig. 7), as follows:
The HH cluster type occurred in five sub-districts, accounting for 17.9% of all female patients with CVD. This occurred in sub-districts where UGS per capita was high and CVD occurrence in women was high. It was confirmed with a 95% confidence level in sub-districts 2-1, 2-2, and 3-2, and with a 99% confidence level in sub-districts 3-1 and 3-3.
The LL cluster type occurred in one sub-district, accounting for 2.8% of total women affected by CVD. This occurred in sub-districts where UGS per capita was low and CVD occurrence was low. It was confirmed with a 95% confidence level.
The HL cluster type occurred in two sub-districts with 4.3% of female patients with CVD. This occurred in sub-districts where UGS per capita was high and consequently, CVD occurrence in women was low. It was confirmed with a 95% confidence level.
Fig. 7.
a Spatial autocorrelation between CVD and UGSs. b Significant level
Overall, the results confirmed a spatial correlation between UGSs per capita and CVD occurrence in all eight sub-districts of Mashhad municipality. In the following paragraphs, the factors influencing the presence in urban parks among women affected by CVD in eight sub-districts (4 clusters) will be studied.
Identification of Factors Influencing the Presence in UGSs Among Women with CVD
In the previous section, significant correlation between cardiovascular disease and urban green spaces was found in eight sub-districts. At this stage, 607 women who had been living in these eight sub-districts were asked to complete questionnaires (Figure 7). They were asked to answer questions about their level of education, income, and presence in urban parks. Two variables of age and marital status of women were in the file obtained from three hospitals and the analysis was controlled based on these. The number of women participating in the survey in each sub-district was estimated based on the total number of female patients so they could cover all statistical blocks.
According to Table 1, in the first five sub-districts that included low-income neighborhoods, a large proportion of women had poor education, holding elementary school leaving certificates or high school diplomas, and they were mostly aged between 64 and 50. In sub-district 9-1, including high-income neighborhoods, a larger proportion of women held university degrees and the literacy rate was higher compared with other sub-districts while in two sub-districts 7-4 and 8-3, the number of women with secondary education was greater.
Table 1.
Demographic characteristics of women
| Sub-district | Number of patients | Number of patients selected | Number of statistical blocks | Age (%) | Education (%) | Marital status (%) | |||||||
|---|---|---|---|---|---|---|---|---|---|---|---|---|---|
| 60–64 | 50–59 | 35–49 | 16–34 | Illiterate | Primary | High school | University | Single | Married | ||||
| 2-1 | 248 | 79 | 48 | 25.7 | 33.93 | 29.98 | 10.37 | 12.8 | 16.38 | 51.24 | 19.52 | 37.98 | 62.01 |
| 2-2 | 228 | 73 | 40 | 12.15 | 36.69 | 34.4 | 16.74 | 8.66 | 17.82 | 57 | 16.5 | 34.14 | 65.85 |
| 3-1 | 227 | 73 | 59 | 28.11 | 22.08 | 26.5 | 23.29 | 13.25 | 18.56 | 51.6 | 16.56 | 37.34 | 62.65 |
| 3-2 | 362 | 116 | 58 | 18.55 | 20.61 | 40.2 | 20.61 | 13.83 | 27.15 | 51.16 | 7.84 | 33.97 | 66.02 |
| 3-3 | 290 | 93 | 52 | 31.42 | 28.57 | 18.57 | 21.42 | 14.46 | 28.04 | 50.82 | 6.66 | 34.21 | 65.78 |
| 9-1 | 214 | 69 | 38 | 12.5 | 18.75 | 31.25 | 37.5 | 5.2 | 12.8 | 42.19 | 52.54 | 39.76 | 60.23 |
| 8-3 | 166 | 53 | 25 | 18.57 | 25.71 | 20 | 35.71 | 9.99 | 14.38 | 49.56 | 26.05 | 38.45 | 61.54 |
| 7-4 | 160 | 51 | 23 | 21.05 | 22.36 | 26.31 | 30.26 | 7.96 | 24.56 | 57.56 | 9.91 | 31.04 | 68.95 |
Moran’s I revealed a negative spatial correlation between UGSs and CVD, with a coefficient of correlation of − 0.15 (Fig. 6), and three types of clusters occurred (Fig. 7). Although the value of Moran’s coefficient was small, the autocorrelation between two variables was confirmed within the confidence intervals in all eight sub-districts. Following this, the factors influencing the presence in UGSs by female patients with CVD were identified using GWR, in sub-districts where the spatial correlation between variables was confirmed.
OLS was applied as the first step of the modeling procedure. OLS results demonstrate which variables and which clusters should be used in GWR modeling. Based on GWR results, standard residual, local R-squared, and regression coefficient were estimated for statistical blocks.
To understand the spatial heterogeneity and identification of statistical blocks in which values were well-estimated, the standard residual was mapped. Moran’s I was used to confirm the results obtained from standard residual. To explore where the model identified a high proportion of variance and where further investigations were needed, local R-squared values were represented in a map. Next, the regression coefficient for each variable, with respect to the nature of the variables, was mapped and consequently, spatial diversity was analyzed.
Five sub-districts, including 257 statistical blocks, were in the HH cluster type in which UGS per capita was high and CVD occurrence among women was high. One sub-district, including 38 statistical blocks, was in the LL cluster type in which UGS per capita was low and CVD occurrence in women was low. The two other sub-districts of 8-3 and 7-4, composed of 25 and 23 statistical blocks respectively, were in the HL cluster type in which UGS per capita was high and, as expected, CVD occurrence was low.
OLS results (Table 2) confirmed a significant correlation between the explanatory variables and the presence in UGSs among women with CVD as the dependent variable. In this model, if the Koenker statistic was statistically significant, the variables were not independent of each other. Therefore, the GWR model was used to provide improvement over OLS results.
Table 2.
The results of OLS
| Cluster | Variable | Coefficient | p value | VIF | Adjusted R-squared (R2) | Koenker statistic |
|---|---|---|---|---|---|---|
| HH | Income | 0.03 | 0.00 | 1.55 | 0.34 |
14.31 p value 0.002 |
| Education | 0.13 | 0.00 | 1.93 | |||
| Accessibility | 0.12 | 0.02 | 1.33 | |||
| LL | Income | − 0.27 | 0.05 | 1.70 | 0.58 |
13.61 p value 0.003 |
| Education | − .38 | 0.03 | 1.84 | |||
| Accessibility | 0.10 | 0.00 | 1.32 | |||
| HL (8-3) | Income | 0.28 | 0.004 | 2.54 | 0.53 |
5.14 p value 0.04 |
| Education | 0.18 | 0.00 | 2.49 | |||
| Accessibility | 0.25 | 0.0008 | 1.17 | |||
| HL (7-4) | Income | 0.19 | 0.008 | 3.18 | 0.46 |
6.99 p value 0.07 |
| Education | 0.49 | 0.0002 | 4.03 | |||
| Accessibility | − 0.14 | 0.001 | 1.81 |
Adjusted R-squared value was calculated to be 0.34 for HH, 0.58 for LL, 0.53 for HL (8-3), and 0.46 for the HL (7-4) cluster type. In other words, in HH: 34% of the total variance, in LL: 58% of the total variance, in HL (8-3): 53% of the total variance, and in HL (7-4): 46% of the total variance of the presence in UGSs among women with CVD were explained by the model. Despite the small values of coefficients of correlation, p values confirmed the existence of significant correlations between variables.
The GWR model is based on the results of OLS. At this stage, the HL cluster (7-4) is not included in the GWR model due to insignificant Koenker statistic.
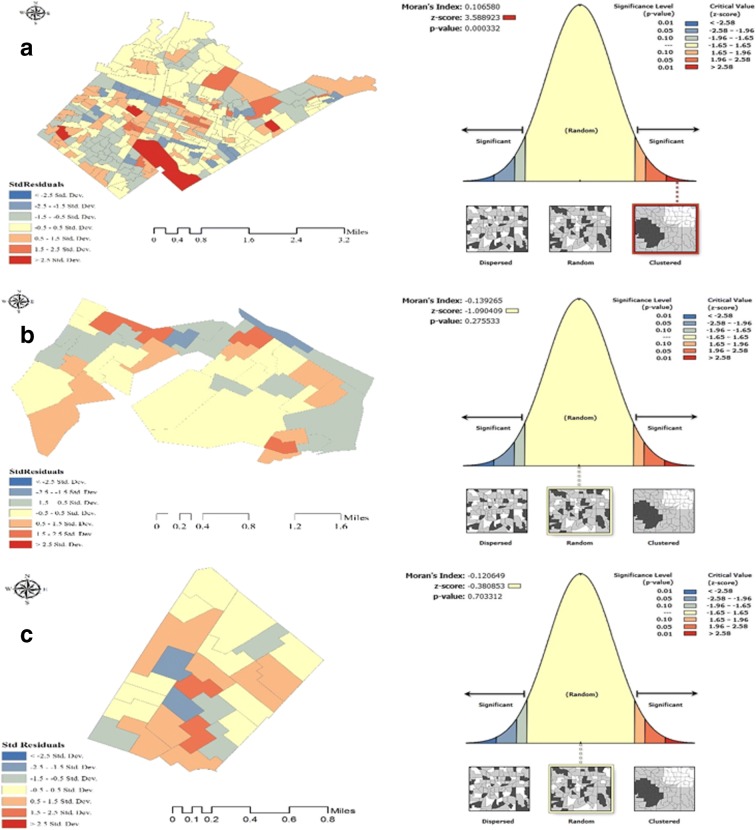
Figure 8 represents the map of standard residual for statistical blocks. The residual is a part of the dependent variable that could not be explained by the model, model under and over predictions. At this stage, the statistical blocks in which the value of the dependent variable (the presence in UGSs among women with CVD) predicted under (blue color) or over (red color) the observed value were identified.
Fig. 8.
Geographically weighted regression model standard residual R2 and Moran’s I in a HH, b LL, c HL (8-3)
Cluster or dispersed distribution of the residuals was evidence that one or more explanatory variables were missing from the model. Therefore, a properly specified regression model could occur when the residuals were distributed randomly.
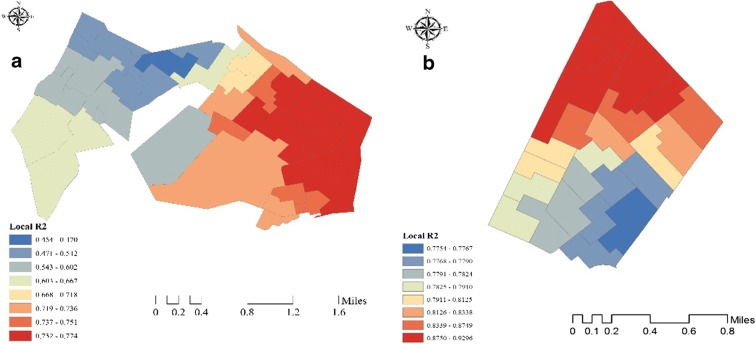
In HH, the clustering of residuals indicated that at least one key explanatory variable was missing from the model. Consequently, the results could not be trusted for further analysis. In LL and HL (8-3), the residuals were spatially random. Therefore, the model was properly specified. The local R2 values for LL and HL (8-3) were mapped in Fig. 9, showing that the model appropriately fitted the data and explained the variance well.
Fig. 9.
Geographically weighted regression local R2 in a LL and b HL (8–3)
The local R2 value was estimated to be 0.76 in LL and it ranged from 0.45 to 0.77. While the model explained a high proportion of variance on the right site of the map, the local R2 value was smaller on the left side. In total, the model explained 76% of the total variance of the presence in UGSs among women with CVD in LL.
In HL (8–3), the local R2 value was estimated to be 0.88 and it ranged from 0.77 to 0.92, revealing a small difference among statistical blocks. The local R2 value was high for all the blocks. However, the model explained a larger proportion of variance at the top of the map. In total, the model explained 88% of the total variance of the presence in UGSs among women with CVD in HL. The statistical blocks with low R2 value represented the blocks in which the model was influenced by other variables.
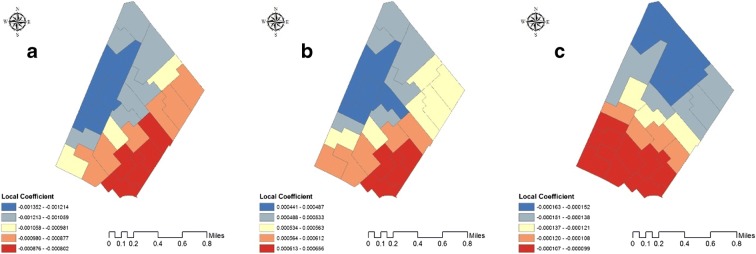
The local regression coefficient values in LL and HL (8-3) were mapped in Figs. 10 and 11 to describe the strength of relationship between the presence in UGSs and other variables in the model, additionally to analyze the spatial diversity, and to explore the areas in which further interventions were required.
Fig. 10.
Geographically weighted regression coefficient for a income, b education, and c accessibility in the LL cluster
Fig. 11.
Geographically weighted regression coefficient for a income, b education, and c accessibility in the HL (8-3) cluster
The variables illustrated various spatial patterns and the strength of relationships between sets of variables varied by cluster. These results emphasize the capability of GWR for revealing differences and unexpected relationships resulting from spatial heterogeneity. The regression equation obtained in LL is as follows:
The presence in UGSs among women with CVD = − 0.27 income − 0.38 education + 0.1 accessibility + 4.62.
The regression equation in LL indicated a negative correlation between income and the presence in UGSs among women with CVD, as an increase in income and the level of education, respectively, resulted in a decrease of 27% and 38% in the total variance of the presence in UGSs. A positive correlation existed between the presence in UGSs among women with CVD and accessibility. This means that when distance to UGSs decreased, the total variance of the presence in UGSs increased by 10%. The east side showed a better fit. The regression equation in HL (8–3) is detailed below:
The presence in UGSs among women with CVD = 0.28 Income +0.18 Education +0.25 Accessibility +3.007.
In HL (8-3), a positive correlation existed between the explanatory variables and the dependent variable, as an increase in income, level of education, and accessibility led to a 28%, 18%, and 15% increase in the total variance of the presence in UGSs, respectively. The variable of income had more influence on the presence in UGSs and the south side showed a better fit.
With a higher coefficient of determination (R2), GWR showed improved results over OLS for both LL and HL (8–3) (R2 in LL was estimated to be 0.76 compared with 0.58, and R2 in HL (8-3) was estimated to be 0.88 compared with 0.53). The GWR model decreased the unexplained variance—the GWR model explained more variance.
Discussion
The study results (Figs. 4 and 5) found a clustered pattern for women’s CVD distribution in Mashhad.
A study in Thailand suggested GIS techniques as an effective approach for identification of spatial clusters of disease occurrence [58].
In Iran, particularly in Mashhad as the most important religious center of Iran, some religious norms and traditions limit women to use parks and public open spaces for physical activities. While increased open spaces and easy access to green spaces can increase women’s participation in physical activities, this has been neglected in Iran to some extent [71]. Therefore, although at first it seemed that there was no relationship between cardiovascular disease and green spaces, a negative spatial correlation, with coefficient of − 0.15, was found between per capita green space and cardiovascular disease occurrence (Fig. 6), and three types of cluster were identified in eight sub-districts (Fig. 7).
The HH cluster type occurred in low-income sub-districts, HL cluster type occurred in median-income sub-districts, and LL cluster type occurred in high-income sub-districts. These findings are consistent with the results reported by Kondo and colleagues [47]. They investigated the relationship between urban green spaces and human health, and their results confirmed a negative correlation among the use of urban green spaces, mortality, and heart rate. A research in New Zealand supported the existence of a negative relationship between the rate of CVD occurrence and green space quantity [29]. Another study in Ontario, Canada, demonstrated that people living in areas with higher NDVI had a lower risk of death from CVD [72]. Similarly, Bixby and colleagues [43] showed that an increase in green area resulted in a decrease in the rate of deaths caused by CVD and this was the same for men and women. Overall, it can be said that features of neighborhoods are important for health. They can particularly impact women’s health and well-being as women spend more time in neighborhoods [28].
In the third stage, factors influencing the presence in UGSs among women with CVD were investigated using GWR. Following OLS results, HL (7-4) cluster was eliminated. The three remaining clusters were entered in the model and the standard residual was calculated for each cluster type. Moran’s autocorrelation coefficient revealed that the HH cluster type should also be removed. There may have been other important variables in this cluster that were not considered in the research. HH occurred in five sub-districts including low-income neighborhoods. Vaughan and colleagues [41] indicated that people living in low-income neighborhoods used parks more frequently. It could be argued that poor quality and quantity of green spaces were probably other reasons influencing the use of urban parks by women. This is mainly because quality and quantity of green spaces have a great influence on usage patterns and there are often poor-quality green spaces in low-income neighborhoods [73]. Therefore, the identification of factors encouraging increased use of green spaces is necessary [56]. Soltanifard and Jafari [74] stated that due to the physical expansion of Mashhad, urban green spaces have been replaced by a variety of other land uses, and it is of great importance to study Mashhad’s urban green spaces in terms of quality. The quality of green spaces is more important for women than men [75]. These aforementioned factors probably caused the increased rate of CVD occurrence in these areas.
In LL, 76%, and in HL, (8-3), 88% of variance explained by variables of the model. All variables showed various spatial patterns (Figs. 10 and 11 and Table 3).
Table 3.
Variables coefficients and their relationships in LL and HL (8-3) clusters
| Cluster | Relationship between UGSs and CVD | Coefficient | ||
|---|---|---|---|---|
| Income | Education | Accessibility | ||
| LL |
Per capita of UGSs is low, occurrence of CVD is low p value 0.05 |
− 0.27 | − 0.38 | 0.1 |
| HL (8-3) |
Per capita of UGSs is high, occurrence of CVD is low p value 0.01 |
0.28 | 0.18 | 0.25 |
In LL, which occurred in high-income sub-districts, there was a negative correlation between income and the presence of UGS by women with CVD. In contrast, in HL, which occurred in median-income sub-districts, a positive correlation existed between two variables. The findings in LL can be interpreted based on those reported by Mitchell and Popham [73], stating that people living in high-income neighborhoods use public green spaces less as they almost always have private gardens. Furthermore, a high economic status has a protective influence against CVD [76].
The correlation between education and the presence in UGSs among women with CVD was negative in LL but positive in HL (8-3). This means that in LL, where a large proportion of women held university degrees (Table 1), when the level of education increased, presence in UGSs decreased. In HL (8-3) where a large proportion of women held high school diplomas (Table 1) when the level of education increased, presence in UGSs also increased. The findings in LL are in accordance with the findings reached by Mass and colleagues [34], indicating that individuals with lower levels of education are more likely to use UGSs. In HL (8-3), the results are in accordance with the findings reported by Schipperjin and colleagues [35] showing that individuals with lower levels of education are less likely to use urban green spaces. In other words, the more educated individuals are, the more they use urban green spaces.
The results emphasized the capability of GWR in mapping spatial differences [77]. A negative correlation was found between education and CVD occurrence [50, 78], which was more statistically significant among women [37].
This study found a positive relationship between accessibility and the presence in UGSs among women with CVD in both cluster types, which is consistent with that found in previous studies [26, 79, 80]. In HL (8-3), the value of correlation coefficient between accessibility and the presence in UGSs was estimated to be higher, confirming the primary outcome: higher green space per capita contributes to a lower rate of CVD occurrence.
This is the first study in Iran studying the occurrence of CVD in relation to urban spaces. The results of the study could be helpful in disease prevention and improving women’s health and thus affect the next generation’s health and wellbeing. Therefore, similar studies in other metropolitan cities of Iran are recommended.
Limitations of the Study
Although the findings of the study were statically significant, there are some limitations that should be considered when interpreting our findings. This paper only studied a few number of variables. The variable of the presence in parks by women was self-reported which may bias the results. Additionally, other aspects of UGSs such as physical activity opportunities, physical quality, esthetic aspects, and security were not considered. However, this study emphasizes the importance of environmental factors in women’s cardiovascular health.
A comprehensive method that analyzes the residents’ health in relation to features of urban environment is needed. Lack of such methodology is a result of the complex nature of urban systems in which many factors affect health. While the age and marital status of respondents were controlled in this study, their family conditions were ignored.
Conclusions
The results suggest that public health policies aiming at improving healthy lifestyle in urban areas could benefit patients with CVD. CVD has considerable economic impacts on individuals, families, and countries. It especially affects women who have great influence on the well-being of future generations.
Similar studies should be encouraged because their resulting maps are useful tools for identifying factors associated with health and are also helpful for finding key vulnerable areas. They can help in allocating resources to healthcare and applying preventive policies.
Today, there is a greater need for collaboration between researchers and practitioners in the fields of public health and urban planning to create sustainable built environments promoting cardiovascular health. The results of this work can help urban managers and organizations achieve their goals of planning, design, and maintenance of UGSs. They can guide decision makers to develop future UGS strategies and policies. Furthermore, as causes vary from one place to another, it is important that policy makers consider differences.
Acknowledgements
We appreciate of three hospitals managers (Imam Reza, Ghaem and Dr. Shariati) for providing health data. Also, the editor and anonymous referees for valuable comments.
Footnotes
Publisher’s Note
Springer Nature remains neutral with regard to jurisdictional claims in published maps and institutional affiliations.
References
- 1.Caiaffa WT, Friche AA, Dias MA, Meireles AL, Ignacio CF, Prasad A, Kano M. Developing a conceptual framework of urban health observatories toward integrating research and evidence into urban policy for health and health equity. J Urban Health. 2014;91(1):1–6. doi: 10.1007/s11524-013-9812-0. [DOI] [PMC free article] [PubMed] [Google Scholar]
- 2.Daniel OJ, Adejumo OA, Adejumo EN, Owolabi RS, Braimoh RW. Prevalence of hypertension among urban slum dwellers in Lagos, Nigeria. J Urban Health. 2013;90(6):1016–1025. doi: 10.1007/s11524-013-9795-x. [DOI] [PMC free article] [PubMed] [Google Scholar]
- 3.Maas J, Verheij RA, Groenewegen PP, De Vries S, Spreeuwenberg P. Green space, urbanity, and health: how strong is the relation? J Epidemiol Community Health. 2006;60(7):587–592. doi: 10.1136/jech.2005.043125. [DOI] [PMC free article] [PubMed] [Google Scholar]
- 4.James P, Banay RF, Hart JE, Laden F. A review of the health benefits of greenness. Current epidemiology reports. 2015;2(2):131–142. doi: 10.1007/s40471-015-0043-7. [DOI] [PMC free article] [PubMed] [Google Scholar]
- 5.Ngom R, Gosselin P, Blais C, Rochette L. Type and proximity of green spaces are important for preventing cardiovascular morbidity and diabetes—a cross-sectional study for Quebec, Canada. Int J Environ Res Public Health. 2016;13(4):423. doi: 10.3390/ijerph13040423. [DOI] [PMC free article] [PubMed] [Google Scholar]
- 6.Mena C, Sepulveda C, Fuentes E, Ormazabal Y, Palomo I. Spatial analysis for the epidemiological study of cardiovascular disease: a systematic literature search. Geospat Health. 2018;13(587):11–19. doi: 10.4081/gh.2018.587. [DOI] [PubMed] [Google Scholar]
- 7.Bruton CM, Floyd MF. Disparities in built and natural features of urban parks: comparisons by neighborhood level race/ethnicity and income. J Urban Health. 2014;91(5):894–907. doi: 10.1007/s11524-014-9893-4. [DOI] [PMC free article] [PubMed] [Google Scholar]
- 8.Wolch JR, Byrne J, Newell JP. Urban green space, public health, and environmental justice: the challenge of making cities ‘just green enough’. Landsc Urban Plan. 2014;125:234–244. doi: 10.1016/j.landurbplan.2014.01.017. [DOI] [Google Scholar]
- 9.Putrik P, van Amelsvoort L, De Vries NK, Mujakovic S, Kunst AE, van Oers H, et al. Neighborhood environment is associated with overweight and obesity, particularly in older residents: results from cross-sectional study in Dutch municipality. J Urban Health. 2015;92(6):1038–1051. doi: 10.1007/s11524-015-9991-y. [DOI] [PMC free article] [PubMed] [Google Scholar]
- 10.Cakmak S, Dales R, Leech J, Liu L. The influence of air pollution on cardiovascular and pulmonary function and exercise capacity: Canadian Health Measures Survey (CHMS) Environ Res. 2011;111(8):1309–1312. doi: 10.1016/j.envres.2011.09.016. [DOI] [PubMed] [Google Scholar]
- 11.Cohen P, Potchter O, Schnell I. The impact of an urban park on air pollution and noise levels in the Mediterranean city of Tel-Aviv, Israel. Environ Pollut. 2014;195:73–83. doi: 10.1016/j.envpol.2014.08.015. [DOI] [PubMed] [Google Scholar]
- 12.Dzhambov AM, Dimitrova DD. Green spaces and environmental noise perception. Urban For Urban Green. 2015;14(4):1000–1008. doi: 10.1016/j.ufug.2015.09.006. [DOI] [Google Scholar]
- 13.Margaritis E, Kang J. Relationship between green space-related morphology and noise pollution. Ecol Indic. 2017;72:921–933. doi: 10.1016/j.ecolind.2016.09.032. [DOI] [Google Scholar]
- 14.Lachowycz K, Jones AP, Page AS, Wheeler BW, Cooper AR. What can global positioning systems tell us about the contribution of different types of urban greenspace to children's physical activity? Health Place. 2012;18(3):586–594. doi: 10.1016/j.healthplace.2012.01.006. [DOI] [PMC free article] [PubMed] [Google Scholar]
- 15.Koohsari MJ, Mavoa S, Villanueva K, Sugiyama T, Badland H, Kaczynski AT, et al. Public open space, physical activity, urban design and public health: concepts, methods and research agenda. Health Place. 2015;33:75–82. doi: 10.1016/j.healthplace.2015.02.009. [DOI] [PubMed] [Google Scholar]
- 16.White MP, Alcock I, Wheeler BW, Depledge MH. Would you be happier living in a greener urban area? A fixed-effects analysis of panel data. Psychol Sci. 2013;24(6):920–928. doi: 10.1177/0956797612464659. [DOI] [PubMed] [Google Scholar]
- 17.Nutsford D, Pearson AL, Kingham S. An ecological study investigating the association between access to urban green space and mental health. Public Health. 2013;127(11):1005–11. doi: 10.1016/j.puhe.2013.08.016. [DOI] [PubMed] [Google Scholar]
- 18.Cohen-Cline H, Turkheimer E, Duncan GE. Access to green space, physical activity and mental health: a twin study. J Epidemiol Community Health. 2015;69(6):523–529. doi: 10.1136/jech-2014-204667. [DOI] [PMC free article] [PubMed] [Google Scholar]
- 19.Khotdee M, Singhirunnusorn W, Sahachaisaeree N. Effects of green open space on social health and behavior of urban residents: a case study of communities in Bangkok. Procedia Soc Behav Sci. 2012;36:449–455. doi: 10.1016/j.sbspro.2012.03.049. [DOI] [Google Scholar]
- 20.Silveira IH, Junger WL. Green spaces and mortality due to cardiovascular diseases in the city of Rio de Janeiro. Rev Saude Publica. 2018;52:49. doi: 10.11606/S1518-8787.2018052000290. [DOI] [PMC free article] [PubMed] [Google Scholar]
- 21.Frich JC, Malterud K, Fugelli P. Women at risk of coronary heart disease experience barriers to diagnosis and treatment: a qualitative interview study. Scand J Prim Health Care. 2006;24(1):38–43. doi: 10.1080/02813430500504305. [DOI] [PubMed] [Google Scholar]
- 22.Mosca L, Benjamin EJ, Berra K, Bezanson JL, Dolor RJ, Lloyd-Jones DM, et al. Effectiveness-based guidelines for the prevention of cardiovascular disease in women—2011 update: a guideline from the American Heart Association. J Am Coll Cardiol. 2011;57(12):1404–1423. doi: 10.1016/j.jacc.2011.02.005. [DOI] [PMC free article] [PubMed] [Google Scholar]
- 23.Bird CE, Manocchia M, Tomblin B, Payne P, Kulakodlu M, Iacolo E, et al. Mapping the gaps: gender differences in preventive cardiovascular care among managed care members in four metropolitan areas. Womens Health Issues. 2018; [DOI] [PubMed]
- 24.Prince SA, Kristjansson EA, Russell K, Billette JM, Sawada M, Ali A, et al. A multilevel analysis of neighborhood built and social environments and adult self-reported physical activity and body mass index in Ottawa, Canada. Int J Environ Res Public Health. 2011;8(10):3953–3978. doi: 10.3390/ijerph8103953. [DOI] [PMC free article] [PubMed] [Google Scholar]
- 25.Omoleke SA. Green space, gender and health: a re-examination of the literature. Bulletin. 2012; 3–11.
- 26.Tamosiunas A, Grazuleviciene R, Luksiene D, Dedele A, Reklaitiene R, Baceviciene M, et al. Accessibility and use of urban green spaces, and cardiovascular health: findings from a Kaunas cohort study. Environ Health. 2014;13(1):20. doi: 10.1186/1476-069X-13-20. [DOI] [PMC free article] [PubMed] [Google Scholar]
- 27.Astell-Burt T, Feng X, Kolt GS. Greener neighborhoods, slimmer people? Evidence from 246 920 Australians. Int J Obes (Lond) 2014;38(1):156. doi: 10.1038/ijo.2013.64. [DOI] [PubMed] [Google Scholar]
- 28.Richardson EA, Mitchell R. Gender differences in relationships between urban green space and health in the United Kingdom. Soc Sci Med. 2010;71(3):568–575. doi: 10.1016/j.socscimed.2010.04.015. [DOI] [PubMed] [Google Scholar]
- 29.Richardson EA, Pearce J, Mitchell R, Kingham S. Role of physical activity in the relationship between urban green space and health. Public Health. 2013;127(4):318–324. doi: 10.1016/j.puhe.2013.01.004. [DOI] [PubMed] [Google Scholar]
- 30.Rahnema S, Sedaghathoor S, Allahyari MS, Damalas CA, El Bilali H. Preferences and emotion perceptions of ornamental plant species for green space designing among urban park users in Iran. Urban For Urban Green. 2019;39:98–108. doi: 10.1016/j.ufug.2018.12.007. [DOI] [Google Scholar]
- 31.Cohen DA, McKenzie TL, Sehgal A, Williamson S, Golinelli D, Lurie N. Contribution of public parks to physical activity. Am J Public Health. 2007;97(3):509–514. doi: 10.2105/AJPH.2005.072447. [DOI] [PMC free article] [PubMed] [Google Scholar]
- 32.Tinker A, Finn K, Epp J. Improving women’s health issues and interventions, the international bank for reconstruction and development. Washington; 2005. DC 20433.
- 33.D’Alessandro D, Buffoli M, Capasso L, Fara GM, Rebecchi A, Capolongo S. Green areas and public health: improving wellbeing and physical activity in the urban context. Epidemiol Prev. 2015;39(4):8–13. [PubMed] [Google Scholar]
- 34.Maas J, Verheij RA, de Vries S, Spreeuwenberg P, Schellevis FG, Groenewegen PP. Morbidity is related to a green living environment. J Epidemiol Community Health. 2009:jech–2008. [DOI] [PubMed]
- 35.Schipperijn J, Ekholm O, Stigsdotter UK, Toftager M, Bentsen P, Kamper-Jørgensen F, et al. Factors influencing the use of green space: results from a Danish national representative survey. Landsc Urban Plan. 2010;95(3):130–137. doi: 10.1016/j.landurbplan.2009.12.010. [DOI] [Google Scholar]
- 36.Hami A, Maruthaveeran S. Public perception and perceived landscape function of urban park trees in Tabriz, Iran. Landscape online. 2018;62:1–16. doi: 10.3097/LO.201862. [DOI] [Google Scholar]
- 37.Backholer K, Peters SA, Bots SH, Peeters A, Huxley RR, Woodward M. Sex differences in the relationship between socioeconomic status and cardiovascular disease: a systematic review and meta-analysis. J Epidemiol Community Health. 2017;71(6):550–557. doi: 10.1136/jech-2016-207890. [DOI] [PubMed] [Google Scholar]
- 38.Wendel HE, Zarger RK, Mihelcic JR. Accessibility and usability: green space preferences, perceptions, and barriers in a rapidly urbanizing city in Latin America. Landsc Urban Plan. 2012;107(3):272–282. doi: 10.1016/j.landurbplan.2012.06.003. [DOI] [Google Scholar]
- 39.Moore LV, Roux AV, Evenson KR, McGinn AP, Brines SJ. Availability of recreational resources in minority and low socioeconomic status areas. Am J Prev Med. 2008;34(1):16–22. doi: 10.1016/j.amepre.2007.09.021. [DOI] [PMC free article] [PubMed] [Google Scholar]
- 40.Weiss CC, Purciel M, Bader M, Quinn JW, Lovasi G, Neckerman KM, et al. Reconsidering access: park facilities and neighborhood disamenities in New York City. J Urban Health. 2011;88(2):297–310. doi: 10.1007/s11524-011-9551-z. [DOI] [PMC free article] [PubMed] [Google Scholar]
- 41.Vaughan CA, Colabianchi N, Hunter GP, Beckman R, Dubowitz T. Park use in low-income urban neighborhoods: who uses the parks and why? J Urban Health. 2018;95(2):222–231. doi: 10.1007/s11524-017-0221-7. [DOI] [PMC free article] [PubMed] [Google Scholar]
- 42.Nielsen TS, Hansen KB. Do green areas affect health? Results from a Danish survey on the use of green areas and health indicators. Health Place. 2007;13(4):839–850. doi: 10.1016/j.healthplace.2007.02.001. [DOI] [PubMed] [Google Scholar]
- 43.Bixby H, Hodgson S, Fortunato L, Hansell A, Fecht D. Associations between green space and health in English cities: an ecological, cross-sectional study. PLoS One. 2015;10(3):e0119495. doi: 10.1371/journal.pone.0119495. [DOI] [PMC free article] [PubMed] [Google Scholar]
- 44.Wüstemann H, Kalisch D, Kolbe J. Access to urban green space and environmental inequalities in Germany. Landsc Urban Plan. 2017;164:124–131. doi: 10.1016/j.landurbplan.2017.04.002. [DOI] [Google Scholar]
- 45.Coombes E, Jones AP, Hillsdon M. The relationship of physical activity and overweight to objectively measured green space accessibility and use. Soc Sci Med. 2010;70(6):816–822. doi: 10.1016/j.socscimed.2009.11.020. [DOI] [PMC free article] [PubMed] [Google Scholar]
- 46.Jennings V, Gaither CJ. Approaching environmental health disparities and green spaces: an ecosystem services perspective. Int J Environ Res Public Health. 2015;12(2):1952–1968. doi: 10.3390/ijerph120201952. [DOI] [PMC free article] [PubMed] [Google Scholar]
- 47.Kondo M, Fluehr J, McKeon T, Branas C. Urban green space and its impact on human health. Int J Environ Res Public Health. 2018;15(3):445. doi: 10.3390/ijerph15030445. [DOI] [PMC free article] [PubMed] [Google Scholar]
- 48.Gala D, Corroon M, Tirado C. Urban environment and health: food security. Asia Pac J Public Health. 2010;22(3):254–261. doi: 10.1177/1010539510372993. [DOI] [PubMed] [Google Scholar]
- 49.Rezaeian M. Application of geographical sciences and technologies to investigate health problems in the Eastern Mediterranean Region. East Mediterr Health J. 2009;15(6):1565. [PubMed] [Google Scholar]
- 50.Park SY, Kwak JM, Seo EW, Lee KS. Spatial analysis of the regional variation of hypertensive disease mortality and its socio-economic correlates in South Korea. Geospat Health. 2016;11(2) [DOI] [PubMed]
- 51.Kim D, Zhang Y, Lee CK. Understanding needs and barriers to using geospatial tools for public health policymaking in China. Geospat Health. 2018;13(1) [DOI] [PubMed]
- 52.Nykiforuk CI, Flaman LM. Geographic information systems (GIS) for health promotion and public health: a review. Health Promot Pract. 2011;12(1):63–73. doi: 10.1177/1524839909334624. [DOI] [PubMed] [Google Scholar]
- 53.Roberson S, Dutton M, Macdonald M. Does place of residence or time of year affect the risk of stroke hospitalization and death? A descriptive spatial and temporal epidemiologic study. PLoS One. 2016;11(1):e0145224. doi: 10.1371/journal.pone.0145224. [DOI] [PMC free article] [PubMed] [Google Scholar]
- 54.Paquet C, Chaix B, Howard NJ, Coffee NT, Adams RJ, Taylor AW, et al. Geographic clustering of cardiometabolic risk factors in metropolitan centers in France and Australia. Int J Environ Res Public Health. 2016;13(5):519. doi: 10.3390/ijerph13050519. [DOI] [PMC free article] [PubMed] [Google Scholar]
- 55.Stewart K, Cao Y, Hsu MH, Artigiani E, Wish E. Geospatial analysis of drug poisoning deaths involving heroin in the USA, 2000–2014. J Urban Health. 2017;94(4):572–586. doi: 10.1007/s11524-017-0177-7. [DOI] [PMC free article] [PubMed] [Google Scholar]
- 56.Li F, Zhang F, Li X, Wang P, Liang J, Mei Y, et al. Spatiotemporal patterns of the use of urban green spaces and external factors contributing to their use in central Beijing. Int J Environ Res Public Health. 2017;14(3):237. doi: 10.3390/ijerph14030237. [DOI] [PMC free article] [PubMed] [Google Scholar]
- 57.Ford MM, Desai PS, Maduro G, Laraque F. Neighborhood inequalities in hepatitis C mortality: spatial and temporal patterns and associated factors. J Urban Health. 2017;94(5):746–755. doi: 10.1007/s11524-017-0174-x. [DOI] [PMC free article] [PubMed] [Google Scholar]
- 58.Laohasiriwong W, Puttanapong N, Singsalasang A. Prevalence of hypertension in Thailand: hotspot clustering detected by spatial analysis. Geospat Health. 2018;13(1) [DOI] [PubMed]
- 59.Rodrigues PC, Santos ES, Ignotti E, Hacon SS. Space-time analysis to identify areas at risk of mortality from cardiovascular disease. Bio Med research international. 2015;2015 [DOI] [PMC free article] [PubMed]
- 60.Astell-Burt T, Feng X, Kolt GS. Mental health benefits of neighbourhood green space are stronger among physically active adults in middle-to-older age: evidence from 260,061 Australians. Prev Med. 2013;57(5):601–606. doi: 10.1016/j.ypmed.2013.08.017. [DOI] [PubMed] [Google Scholar]
- 61.Li W, Saphores JD, Gillespie TW. A comparison of the economic benefits of urban green spaces estimated with NDVI and with high-resolution land cover data. Landsc Urban Plan. 2015;133:105–117. doi: 10.1016/j.landurbplan.2014.09.013. [DOI] [Google Scholar]
- 62.Reklaitiene R, Grazuleviciene R, Dedele A, Virviciute D, Vensloviene J, Tamosiunas A, et al. The relationship of green space, depressive symptoms and perceived general health in urban population. Scand J Public Health. 2014;42(7):669–676. doi: 10.1177/1403494814544494. [DOI] [PubMed] [Google Scholar]
- 63.Derose KP, Han B, Williamson S, Cohen DA. Racial-ethnic variation in park use and physical activity in the City of Los Angeles. J Urban Health. 2015;92(6):1011–1023. doi: 10.1007/s11524-015-9994-8. [DOI] [PMC free article] [PubMed] [Google Scholar]
- 64.Comber AJ, Brunsdon C, Radburn R. A spatial analysis of variations in health access: linking geography, socio-economic status and access perceptions. Int J Health Geogr. 2011;10(1):44. doi: 10.1186/1476-072X-10-44. [DOI] [PMC free article] [PubMed] [Google Scholar]
- 65.Delamater PL, Messina JP, Shortridge AM, Grady SC. Measuring geographic access to health care: raster and network-based methods. Int J Health Geogr. 2012;11(1):15. doi: 10.1186/1476-072X-11-15. [DOI] [PMC free article] [PubMed] [Google Scholar]
- 66.Lee AC, Jordan HC, Horsley J. Value of urban green spaces in promoting healthy living and wellbeing: prospects for planning. Risk management and healthcare policy. 2015;8:131. doi: 10.2147/RMHP.S61654. [DOI] [PMC free article] [PubMed] [Google Scholar]
- 67.Sander HA, Ghosh D, van Riper D, Manson SM. How do you measure distance in spatial models? An example using open-space valuation. Environment and Planning B: Planning and Design. 2010;37(5):874–894. doi: 10.1068/b35126. [DOI] [Google Scholar]
- 68.Kapwata T, Manda S. Geographic assessment of access to health care in patients with cardiovascular disease in South Africa. BMC Health Serv Res. 2018;18(1):197. doi: 10.1186/s12913-018-3006-0. [DOI] [PMC free article] [PubMed] [Google Scholar]
- 69.Wang Y, Yang Y, Shi X, Mao S, Shi N, Hui X. The spatial distribution pattern of human immunodeficiency virus/acquired immune deficiency syndrome in China. Geospat Health. 2016;11(2) [DOI] [PubMed]
- 70.Marotta P. Assessing spatial relationships between race, inequality, crime, and gonorrhea and chlamydia in the United States. J Urban Health. 2017;94(5):683–698. doi: 10.1007/s11524-017-0179-5. [DOI] [PMC free article] [PubMed] [Google Scholar]
- 71.Saadatifard E, Javadipour M, Honari H, Saffari M, Zareian H. The context of recreational sports for women in Iran. Annals of Applied Sport Science. 2019;7(1):83–95. doi: 10.29252/aassjournal.7.1.83. [DOI] [Google Scholar]
- 72.Villeneuve PJ, Jerrett M, Su JG, Burnett RT, Chen H, Wheeler AJ, et al. A cohort study relating urban green space with mortality in Ontario, Canada. Environ Res. 2012;115:51–58. doi: 10.1016/j.envres.2012.03.003. [DOI] [PubMed] [Google Scholar]
- 73.Mitchell R, Popham F. Greenspace, urbanity and health: relationships in England. J Epidemiol Community Health. 2007;61(8):681–683. doi: 10.1136/jech.2006.053553. [DOI] [PMC free article] [PubMed] [Google Scholar]
- 74.Soltanifard H, Jafari E. A conceptual framework to assess ecological quality of urban green space: a case study in Mashhad city, Iran. Environ Dev Sustain. 2018:1–28.
- 75.World Health Organisation(n.d.). Geneva, Switzerland. eGender. 2011. Available @ http://www.who.int/topics/gender/en/. Accessed Dec 2018.
- 76.Sliwa K, Acquah L, Gersh BJ, Mocumbi AO. Impact of socioeconomic status, ethnicity, and urbanization on risk factor profiles of cardiovascular disease in Africa. Circulation. 2016;133(12):1199–1208. doi: 10.1161/CIRCULATIONAHA.114.008730. [DOI] [PubMed] [Google Scholar]
- 77.Ford MM, Highfield LD. Exploring the spatial association between social deprivation and cardiovascular disease mortality at the neighborhood level. PLoS One. 2016;11(1):e0146085. doi: 10.1371/journal.pone.0146085. [DOI] [PMC free article] [PubMed] [Google Scholar]
- 78.Pedigo A, Aldrich T. Neighborhood disparities in stroke and myocardial infarction mortality: a GIS and spatial scan statistics approach. BMC Public Health. 2011;11(1):644. doi: 10.1186/1471-2458-11-644. [DOI] [PMC free article] [PubMed] [Google Scholar]
- 79.Giles-Corti B, Broomhall MH, Knuiman M, Collins C, Douglas K, Ng K, et al. Increasing walking: how important is distance to, attractiveness, and size of public open space? Am J Prev Med. 2005;28(2):169–176. doi: 10.1016/j.amepre.2004.10.018. [DOI] [PubMed] [Google Scholar]
- 80.Baran PK, Smith WR, Moore RC, Floyd MF, Bocarro JN, Cosco NG, et al. Park use among youth and adults: examination of individual, social, and urban form factors. Environ Behav. 2014;46(6):768–800. doi: 10.1177/0013916512470134. [DOI] [Google Scholar]


