

Abstract
Synthesis of gold nanoparticles (AuNPs) with plant extracts has gained great interest in the field of biomedicine due to its wide variety of health applications. In the present work, AuNPs were synthesized with Mimosa tenuiflora (Mt) bark extract at different metallic precursor concentrations. Mt extract was obtained by mixing the tree bark in ethanol-water. The antioxidant capacity of extract was evaluated using 2,2-diphenyl-1-picrylhydrazyl and total polyphenol assay. AuNPs were characterized by transmission electron microscopy, X-ray diffraction, UV-Vis and Fourier transform infrared spectroscopy, and X-ray photoelectron spectrometry for functional group determination onto their surface. AuMt (colloids formed by AuNPs and molecules of Mt) exhibit multiple shapes with sizes between 20 and 200 nm. AuMt were tested on methylene blue degradation in homogeneous catalysis adding sodium borohydride. The smallest NPs (AuMt1) have a degradation coefficient of 0.008/s and reach 50% degradation in 190s. Cell viability and cytotoxicity were evaluated in human umbilical vein endothelial cells (HUVEC), and a moderate cytotoxic effect at 24 and 48 h was found. However, toxicity does not behave in a dose-dependent manner. Cellular internalization of AuMt on HUVEC cells was analyzed by confocal laser scanning microscopy. For AuMt1, it can be observed that the material is dispersed into the cytoplasm, while in AuMt2, the material is concentrated in the nuclear periphery.
Keywords: Gold, Nanoparticles, Catalysis, Cellular uptake
Introduction
Plant-mediated biosynthesis of nanomaterials is an ecologically friendly method that allows NP synthesis in one-pot process. That is because the same bio-reducing agents of plant extracts act as stabilizing agents for the formed particles with a low rate of toxic compounds [1–3]. In this sense, Mimosa tenuiflora (Mt) bark has a high content of condensed tannins that have a structure of four flavonoid units [4], saponins, glucose, alkaloids (N,N-dimethyltryptamine), and starch [5–8]. These compounds (condensed tannins) can act as metal ion-reducing agents, but particularly, the flavonoid has been associated with metal complexation [4].
Mt ethanolic extract has been used as an antibacterial agent for gram negatives, gram positives, and yeast [9]. Also, as antiprotozoal (using flavonoids of leaves and flowers of Mt) [10] and on skin regeneration [6]. In addition, it has the potential to heal severe skin ulcers, whose properties were attributed to molecules and polyphenols of Mt bark [11]. Plant extracts show properties like antioxidants and particularly contain polyphenols that are used in green synthesis of metallic NPs such as Au, Ag, Fe, Pt, Pd, Cu, their alloys, and oxides [12, 13]. Optical properties of NP systems, as resonance frequency of surface plasmon resonance (SPR), are dependent of not only nanomaterials’ intrinsic characteristics (size, shape, dielectric constant), but also environment properties that surround to NPs, as the solvent where they are dispersed or nature of stabilizing molecules, that cover to NPs. These parameters are decisive to define the peak position of SPR in NP systems [14–16].
On the one hand, AuNPs catalytic properties have been reported in several works, related to organic compounds degradation such as pesticides, phenolic compounds, and dyes [17–19] and are used in catalytic processes related to environment remediation, for example, as cleaning contaminated water [20]. Several reports have emerged in recent years about AuNPs synthesized with plant extracts as black cardamom [21] and catalytic activity evaluations in dye degradation used in the industry, such as methylene blue (MB) [22], methyl orange [19], or Rhodamine B [23]. However, in the opposite direction, some papers have reported that NPs coated with stabilizing molecules showed poor catalytic activity due to sites available for catalysis on NP surface that was occupied by organic molecules [24, 25]. Also, AuNPs have been used as molecular sensors, such as colorimetric detection of toxic metal ions [7] and theragnostic (therapeutic and diagnostic) applications [26].
Functionalized AuNPs with molecules onto the surface show optical and biological properties associated with composition, thickness, organization, and conformation that define their features [27]. Nanotechnology has various challenges, such as aggregation of AuNPs on bloodstream [28]. AuNPs at concentration less of 20 μg/mL and with a size around 20 nm do not show cytotoxic effects in healthy and cancerous cell lines, and their use has allowed to analyze the interaction between NPs and cells [13, 29, 30]. Then, nanotechnology offers a possibility to interact at the same scale of cellular receptors [31] that allow to learn about cellular processes [32, 33] and antimicrobial properties [34], for example, in oxidative stress which generate a cascade of signaling for different effects, such as cytotoxicity or antioxidant defense response [35]. Further, functionalized AuNPs act as transporter vehicle of drugs, gene, or protein [36] and biomedical applications [37, 38]. Even more, AuNPs ligands as proteins and polymers generate a chemical environment that favors NPs internalization to reach the cytoplasm, nucleus, or keep out over the membrane [39].
In this work, AuNPs were synthesized using a rich polyphenolic Mt bark extract. AuMt cytotoxicity was evaluated in HUVEC cells, and cellular internalization was monitored by confocal microscopy at 24 h. AuMt catalytic activity on MB degradation, in the presence of sodium borohydride (NaBH4) at room temperature, was evaluated. Our results were compared with respect to similar works of catalysis with AuNPs synthesized by “green” methods.
Materials and Methods
Materials and Chemicals
For AuMt synthesis, 15 g of Mt tree bark was cut into pieces and placed in a 100-mL flask. Seventy milliliters of ethanol (Fermont, 99% pure) and 30 mL of ultrapure water (18 MΩ, Millipore) were added, then it was covered with aluminum and left at room temperature for 15 days. The solution was filtered using Whatman filter paper (8 μm) and later with an acrodisc (0.20 μm). The obtained solution was used as a reducing agent (Mt extract) for AuMt synthesis. A portion of the filtrate was rotoevaporated and then lyophilized for DPPH and total polyphenol assay and to construct a calibration curve of Mt extract. The concentration of Mt extract was 32.5 mg/mL, determined from a calibration curve. Tetrachloroauric acid (HAuCl4, Sigma-Aldrich 99% pure) was used as a metallic precursor. Concentrations of precursors used in synthesis were 5.3 mM for AuMt1 and 2.6 mM for AuMt2. The reducing agent volume was kept constant (1.6 mL), and the total volume sample was completed to 6 mL with ultrapure water. Additional file 1: Table S1 shows formulations used in AuMt1 and AuMt2 synthesis as well as the pH values for each reactant. The synthesis was performed at 25 °C under laboratory lighting conditions. The protocol used was as follows. In a 50-mL tube, the Mt extract solution is added followed by the ultrapure water, and finally, the gold precursor solution, stirring immediately in the vortex at 3000 rpm for 10 s. The synthesis of the AuMtNPs was visually confirmed within a few minutes by the change in coloration of the mixture. NPs clean process consists of centrifuging of suspension at 14,000 rpm for 1 h, discarding supernatant, adding water, and dispersing by sonication, repeating the process twice. After adding ethanol, AuMt are dispersed again by sonication and centrifuged at 14,000 rpm for 1 h. The supernatant is discarded and precipitated and is dried in an oven at a temperature of 40 °C. Then, the nanocomposite obtained is composed of AuNPs with Mt extract molecules on the surface.
Time-Dependent pH Change of AuMtNP Synthesis
The pH of AuMtNP synthesis was measured as the reaction was carried out. For this, a multi-parameter pH/Conductivity Benchtop Meter (Orion™ VERSA STAR™) was used. The instrument was calibrated at 25 °C using a buffer reference standard solution for calibration at pH = 4.01. A recirculation bath was used to control the temperature of the samples at 25 °C (± 0.1 °C) in all measurements. pH was measured as the reaction was carried out for 180 s immediately after mixing the reagents. The same device was used in pH measurement of reactants.
UV-Vis Spectra, 2,2-Diphenyl-1-Picrylhydrazyl (DPPH), and Total Polyphenol Assay
A double-beam Perkin-Elmer Lambda 40 UV/Vis spectrometer was used to obtain the extract’s UV-Vis spectrum, in a measurement range of 200–400 nm, with a scan rate of 240 nm/min. AuMt SPR was monitored between 250 and 875 nm.
AuMt formation kinetics was determined by measuring the absorbance at 550 nm every second while NP synthesis reaction was developed inside the quartz cell under magneto stirring.
For DPPH assays, all the tests were done by triplicate. Different Mt extract concentrations (25, 12.5, 6.25, and 3.125 μg/mL) were tested. One hundred microliters of ethanol was added to 100 μL of each concentration, in addition to the DPPH solution (300 μM). Subsequently, the samples were incubated for 2 h in the dark before measuring the absorbance at 517 nm. The results were compared with vitamin C and catechins (70 μmol/L), and both molecules were used as controls. For scavenging activity, DPPH radical dissolved on ethanol was used as a blank [40, 41]. The percentage of scavenging activity was computed with Eq. (1).
| 1 |
where A sample is the sample absorbance and A control is the blank absorbance. Data were analyzed using analysis of variance (ANOVA) with Tukey multiple comparison tests.
For total polyphenol assay, the same concentrations were used by adding Folin-Ciocalteu at 0.25 N and sodium carbonate at 5% with a 1-h incubation in the absence of light. Absorbance was measured at 750 nm. The results are expressed as gallic acid equivalents [42, 43].
Zeta Potential and DLS Size Determination
Zeta potential (ζ) of NPs was measured with Zetasizer NS (Malvern, PA), and sizes were measured by dynamic light scattering (DLS) of Zetasizer NS (resolution of 0.5 nm). The instrument calculates the ζ by determining the electrophoretic mobility (μe) using Henry Eq. (2) [44]:
| 2 |
where ε, η, and f(ka) denote the dielectric constant of the media, viscosity of media, and Henry’s function, respectively. Two values are generally used as approximations for the f(ka) determination, either 1.5 or 1.0. The electrophoretic determinations of ζ are the most commonly made in an aqueous solvent and moderate electrolyte concentration. f(ka), in this case, takes the value of 1.5 and is referred to as the classical Smoluchowski approximation, Eq. (3) [45].
| 3 |
The samples were placed into a U-shaped folded capillary cell for ζ measurements. Each sample was measured at room temperature (25 °C) in triplicate.
Evaluation of NP Stability in Supplemented Culture Medium (s-DMEM)
AuMtNP stability was evaluated in s-DMEM by DLS and ζ. The hydrodynamic diameter (2RH) of AuMt1 and AuMt2 was measured at 37 °C in ultrapure water and s-DMEM at concentrations between 25 and 200 μg/mL. For AuMt1 and AuMt2 in s-DMEM, ζ was measured at 37 °C to establish if the culture media modifies the NP surface charge. Nanoparticles were added to an Eppendorf tube with s-DMEM previously thermalized and stirred in the vortex at 3000 rpm for 30 s. Incubation at 37 °C is kept for 15 min before taking the measurements at the same temperature.
Fourier Transform Infrared Spectroscopy (FTIR)
Mt extract and the AuMt FTIR were obtained by a Perkin-Elmer Frontier FTIR using a solid sample. The spectrum was obtained on transmittance mode at a resolution of 2 cm− 1, from 4500 to 500 cm−1.
X-ray Photoelectron Spectroscopy (XPS)
XPS experiment was carried out using a Perkin-Elmer (Model PHI 5100, resolution based on the FWHM of the Ag3d5/2 peak 0.80 eV, XR source dual-standard anode (Mg/Al), and 15 kV, 300 W, 20 mA). Survey scan analyses were carried out with a scan rate of 0.5 eV/s. For high-resolution analyses, a scan rate of 0.025 eV/s was used.
Transmission Electron Microscopy (TEM)
For TEM, 10 μL of the sample was deposited on copper grids covered with a fomvar-carbon film (Electron Microscopy Sciences, 300 Mesh). Grids are left to dry for 1 h and placed in a vacuum chamber for 12 h. The electron microscopy equipment is a field emission Jeol 2010 F operated at 200 keV. Energy dispersive X-rays spectroscopy (EDS) is a detector Bruker Quantax 200, peltier cooled, and coupled to TEM system. Interplanar spacings of crystal planes revealed by high-resolution TEM (HRTEM) were determined by micrograph digital analysis (3.0 Gatan Version).
X-ray Diffraction
Data were collected using a Bruker D8 QUEST diffractometer system, equipped with a multilayer mirror monochromator, and a CuKα Microfocus sealed tube (λ = 1.54178 Å). Frames were collected at T = 300 K via scans.
AuMt Cytotoxic Effect
AuMt cytotoxic effect was evaluated in HUVEC cells using 3-(4,5-dimethylthiazolyl-2)-2,5-diphenyltetrazolium bromide (MTT) assay. Cells were grown on Dulbecco’s modified Eagle medium (DMEM, Sigma-Aldrich), supplemented with 10% fetal bovine serum (GibcoBRL) at 37 °C and 5% of CO2. HUVEC cells were counted in a Neubauer chamber, and viability was determined by trypan blue exclusion test (Sigma-Aldrich).
For MTT assay, cells were adjusted to 100,000 cells/mL, and 100 μL per well was placed in 96-well plates. AuMt1 and AuMt2 were evaluated at concentrations of 200, 100, 50, and 25 μg/mL. Treated cells were incubated for 24 and 48 h at 37 °C, 5% of CO2. After the incubation time, the plate was washed with phosphate-buffered saline (PBS) and MTT solution was added and incubated for 4 h. Dimethyl sulfoxide (DMSO) was added to disolve MTT crystals. Absorbance was measured at 570 nm on a multimode plate reader (Synergy HTX, BioTek), using the Gen5 software. Cell viability was computed using Eq. (4):
| 4 |
where A sample is the absorbance of the sample and A control is the absorbance of blank [46, 47].
Statistical Analysis
Data are expressed as means ± standard deviations (SD). Significant differences between groups were analyzed by Tukey test, one-way ANOVA as appropriate. P values less than 0.05 were considered to be statistically significant. Origin Pro 9.1 software is used for data management, statistical analysis, and graph generation. The signs used are *p < 0.05. The performance with the treatment (AuMt1 and AuMt2) and the control group for 24 and 48 h was compared.
For live/dead assay, HUVEC cells were seeded on glass slides and treated with AuMt1 and AuMt2. After 24 h of incubation slides, these were stained using live/dead viability/cytotoxicity kit (ThermoFisher) under the manufacturer’s recommendation. The samples were observed by confocal laser scanning microscopy (CLSM800, Carl Zeiss).
Confocal Laser Scanning Microscopy: Fluorescence of AuMt
Confocal microscopy analysis was carried out in a LSM 800 device (Carl Zeiss, Jena Germany) mounted on an inverted microscope Axio Observer.Z1 (Carl Zeiss, Jena Germany). Three lasers of 405, 488, and 640 nm, with a respective maximum power of 5, 10, and 5 mW, were used for the study. The fluorescence was collected using highly sensitive GaAsP detectors. Bright-field images were obtained by a collection of transmitted laser light on Photo Multiplier Tube (PMT). For AuMt fluorescence, live/dead assay, and NP distribution on HUVEC cell study, a Plan-Apochromatic × 40/0.95 dry objective was used. For 3D reconstruction cells with AuMt, a Plan-Aprochromatic × 63/1.40 oil objective was used.
For AuMt fluorescence characterization, a drop of 20 μL of NP colloidal dispersion was deposited in a cover glass and dried at room temperature before an analysis by CLSM. A 640-nm laser was employed as an excitation source at 0.5% of power, and the fluorescence was collected between 650 and 670 nm. Bright field AuMt images were formed using a 488-nm laser (0.2% of power) on transmitted light mode. The fluorescence and bright field were collected on separate tracks.
Cellular Internalization
For AuMt internalization on HUVEC cells, the nucleus was stained with 4′,6-diamidino-2-fenilindol (DAPI) and the actin fibers with anti-β actin antibody coupled to fluorescein-5-isothiocynate (FITC) to delimit the cell border. DAPI was excited with a 405 nm laser at 1.0% of power and FITC with a 488-nm laser at 0.20%. Emissions of DAPI and anti-β actin antibody were collected between 410 and 500 nm and 500–700 nm, respectively. AuMt were excited with a 640 nm laser (0.50% power), and emission was collected between 650 and 700 nm.
3D cell-AuMt reconstructions and orthogonal projections were made from 30 images on Z-stack mode (total Z length = 8 μm), collecting fluorescence from DAPI, FITC, and AuMt as described above. Fluorescent signals were collected on separate tracks for each Z position. For clarity, the FITC signal was omitted on a 3D reconstruction.
A relative comparison of nanoparticle cellular uptake was realized. For this, the mean fluorescence intensity of AuMt1 and AuMt2 in HUVEC cells was determined from confocal images analysis using ImageJ software [48].
Catalysis
Catalytic activity on MB, at a concentration of 3.33 × 10⁻⁵ M, was analyzed by UV-Vis spectroscopy. In homogeneous catalysis, 90 μL of NPs (2 mg/mL) was added directly in the quartz cell that contains MB and 200 μL of NaBH4 at a concentration of 100 mM. The sample was homogenized by magnet stirring inside of the spectrophotometer cell. The reaction was carried out at 25 °C.
Results and Discussions
Synthesis
By visual inspection, it was detected that NPs synthesis is very fast in both systems. The most intense color of AuMt1 system shown in the inset of Additional file 1: Figure S1 indicates a higher content of NPs from this synthesis. This is because AuMt1 has a double concentration of metallic precursor compared to AuMt2. In Additional file 1: Table S1, reagents used in nanoparticle synthesis have acidic pH. Additional file 1: Figure S1 shows the changes in pH of the reactions as AuMtNPs syntheses are carried out. Reactions start in an acidic environment (pH < 2.65), and as NPs synthesis develops, acidity grows. This is due to deprotonation of hydroxyl groups present in polyphenolic molecules of Mt extract. In fact, this is the first step of an oxide-reduction process that results in the transfer of electrons from deprotonated hydroxyl group to Au3+ ions. As products of oxide-reduction reaction, Au3+ ions are reduced to metal atoms Au0 and polyphenolic ring that contributes 2 electrons is oxidized. The process is described in the inset of Additional file 1: Figure S1.
UV-Vis Spectra, DPPH, and Total Polyphenol Assays
Mt bark extract UV-Vis spectrum is shown in Fig. 1a, where signal consists in a well-defined band with a maximum in 280 nm and broad of 50 nm. This spectrum is very similar to reported for Rumex hymenosepalus root extract, which has a high content of polyphenolic compounds [49]. Determinating the polyphenolic content in Mt bark extract is important because these molecules can contribute significantly as reducing agents in AuNPs synthesis, providing the necessary electrons for reduction of Au3+ ion to metallic gold (Au0). Once NPs are formed, polyphenolic compounds are absorbed on their surface providing stability to nanomaterials.
Fig. 1.

Characterization of Mt Extract. a Mt extract UV-Vis spectrum and b DPPH inhibition with one-way ANOVA analysis (*p < 0.05)
For DPPH assay, it was observed that for 12.5 mg/L of Mt extract, we obtained a 50% inhibition (L50), alike the values reported for Vitamin C and catechins (46 and 58%, respectively). This indicates that Mt extract possesses an antioxidant capacity very similar to pure compounds used as controls, Fig. 1b where significant differences (*p < 0.05) from control values are marked with an asterisk. The value of 425 mg/g obtained from total polyphenols assay indicates that almost half of the extracted mass is equivalent to gallic acid. The high antioxidant capacity and the high polyphenolic content in Mt extract suggest that it can be used as a good reducing and stabilizing agent nanomaterial synthesis within the framework of sustainable chemistry [50, 51].
Characterization
Kinetic of Formation and UV-Vis Spectra AuMt
Figure 2a shows a temporal evolution of absorbance on a SPR peak of AuNPs (550 and 560 nm for AuMt1 and AuMt2, respectively) as nanomaterial synthesis reaction takes place. Experimental data are fitting with Boltzmann’s sigmoidal function [52], where at least three stages of growth are observed. In the first one, absorbance grows slowly at the start of the synthesis reaction when Au3+ ions are reduced to Au0 and form aggregates of a few atoms that join to form small NPs. In the second stage, the small NPs increase their size by autocatalytic growth and absorbance grows in a fast way. In the last stage, in NP recrystallization, absorbance reaches its stationary phase. As can be seen in Fig. 2, a maximum absorbance is reached in 60 s for AuMt1 and 120 s for AuMt2. Interestingly, the first stage of growth is 20 s for AuMt1, while it is almost null (less of 1 s) for AuMt2, which is explained due to the higher proportion of reducing molecules (Mt extract) with respect to the metallic precursor. This favors the fast formation of the nucleus in NPs of AuMt2 respect to AuMt1; nevertheless, the next stage of growth of the NPs is low for AuMt2, and NPs with larger size are obtained. It has been reported that AuNPs synthesis, using maltose and tween80 as stabilizing, shows a growth kinetic with a reaction time very similar for the reported in this work [53]. In another green synthesis report [54], it is pointed out that the lowest proportion of reducing/precursor agents generates smaller size NPs.
Fig. 2.

UV-Vis characterization of AuMt1 and AuMt2. a Kinetic formation and b UV-Vis spectra
Figure 2b shows the characteristic absorption spectra of AuMt in the region comprised of 250–875 nm. SPR for AuMt1 shows a symmetric band with a maximum absorption in 550 nm and broad of 200 nm. AuMt2 plasmon peak suffers a slight red shift localized now in 560 nm with an asymmetric band and a larger width than 300 nm, which is due to the difference in sizes between the two nanomaterials (dAuMt1 < dAuMt2)1 2. A similar behavior has been reported in AuNPs synthesis with sodium citratum as reducing agent, where the red shift and plasmon broadening are attributed to higher oscillation modes that affect the extinction cross section by increasing the NP size [55]. Additionally, both spectra show the absorption band at 280 nm corresponding to the polyphenolic molecules of the extract, which suggests that Mt extract acts as a stabilizer of the AuMtNPs.
Size, Zeta Potential, and Stability of AuMtNPs
AuMtNP sizes by DLS and Z-potential were tested at different conditions for one concentration (50 μg/mL) as shown in Table 1. AuMt1 and AuMt2 shown high negative values (≤ 30 mV) in water, which favor electrostatic stability of both nanoparticle systems. According to Qu et al. [56], ζ value gradually increases with NP size; in our case, AuMt1 has a smaller size than AuMt2 in water, a size which is controlled by NP synthesis. These size values match with NP ζ values, where the higher ζ corresponds to NP higher size. Zeta potentials (ζ) of AuMtNPs dispersed in s-DMEM show less negative values with respect to those obtained in ultrapure water (Table 1). This reduction can be attributed to DMEM present cations and FBS present proteins that cover AuMtNP surfaces which cause a decrease in electrostatic interactions. Despite this ζ reduction, the value remains close to − 25 mV for both systems which indicate that nanoparticles preserve their electrostatic stability after s-DMEM incubation [57]. Additionally, Table 1 shows the results obtained by DLS for AuMtNP hydrodynamic diameters (2RH) measured at 37 °C in ultrapure water and culture media. In s-DMEM, the size of both systems increased due to protein adsorption on the nanoparticle surface [58]. For AuMt1, the growth of 2RH due to protein corona is 33.8 nm and for AuMt2 is 42.9 nm. It is expected that the greater the nanoparticle size will be greater than the surface for protein absorption [59]. This could explain the slightly smaller value on ζ for AuMt2 compared to AuMt1 in s-DMEM. For AuMt1 and AuMt2, the interaction with s-DMEM proteins is due to the extract molecules that are attached to the nanoparticle surface. These molecules differ slightly between AuMt1 and AuMt2, as shown on XPS results. We also measured the pH of solutions in the same concentration range. It was found that there is not a change in pH and whose mean value was around of 7.5 for both AuMt in ultrapure water and 7.2 in s-DMEM (Table 1).
Table 1.
Size (PdI), zeta potential, and pH
| Size (nm) | PdI | Zeta potential (mV) | pH | |
|---|---|---|---|---|
| AuMt1 in water (25 °C) | 117.3 ± 1.07 | 0.195 | − 35.3 ± 1.12 | 7.56 ± 0.16 |
| AuMt1 in water (37 °C) | 145.1 ± 8.67 | 0.389 | – | – |
| AuMt1 DMEM (37 °C) | 178.9 ± 7.69 | 0.288 | − 26.5 ± 2.19 | 7.2 ± 0.51 |
| AuMt2 in water (25 °C) | 314.13 ± 3.00 | 0.172 | − 42.66 ± 1.08 | 7.51 ± 0.35 |
| AuMt2 in water (37 °C) | 330.7 ± 11.4 | 0.194 | – | – |
| AuMt2 DMEM (37 °C) | 373.5 ± 9.85 | 0.258 | − 24.8 ± 2.37 | 7.18 ± 0.43 |
Additional file 1: Figure S2 shows AuMtNP hydrodynamic diameters when dispersed in ultrapure water and s-DMEM at 37 °C, in a concentration range between 25 and 200 μg/mL. For each studied system, the hydrodynamic diameter does not change with nanoparticle concentration, and only for, AuMt2 s-DMEM at 100 μg/mL, the particle size increases with respect to the lowest evaluated concentration, which may indicate NP aggregation processes at these concentrations [32].
Fourier Transform Infrared Spectroscopy (FTIR)
FTIR spectrum, shown in Fig. 3, corresponds to Mt extract, AuMt1, and AuMt2. The characteristic broad bands centered around 3250 cm−1 are associated with phenolic OH from tannins and flavonoids mainly. Peaks at 1594 cm−1 correspond to N-H bending vibration, at 1705 cm−1 to ketone acyclic stretch and region between 1000 and 1300 cm−1 to C–O stretch. Peaks in the range from 1600 to 500 cm−1 are identified with polyphenols, signals at 1235 and 1160 cm−1 are related with aromatic C–O bond stretching, and at 1020 cm−1 to aliphatic C–O band stretching and at 1235 cm−1 are specifically related with the characteristic of the cyclic nature of ether. These signals can be associated to the most abundant compounds in Mt extract as Mimosa tannin, flavone sakuranetin, triterpenoids saponins, chalcones, and the N,N-dimethyltryptamine alkaloid (Additional file 1: Figure S3). The samples AuMt1 and AuMt2 show the same characteristic peaks in the region of polyphenols confirming that NPs are stabilized by Mt extract molecules [60]. We observe a change of 1331 cm−1 in the width band and a decrease in peak intensity for the AuMt1 and AuMt2 corresponds with the bond between AuNPs and C-H group of polyphenols; 1723 cm−1 is shifted by oxidation of polyphenolic into carboxylic compounds during the reduction of Au3+ to Au0 [51, 61, 62].
Fig. 3.
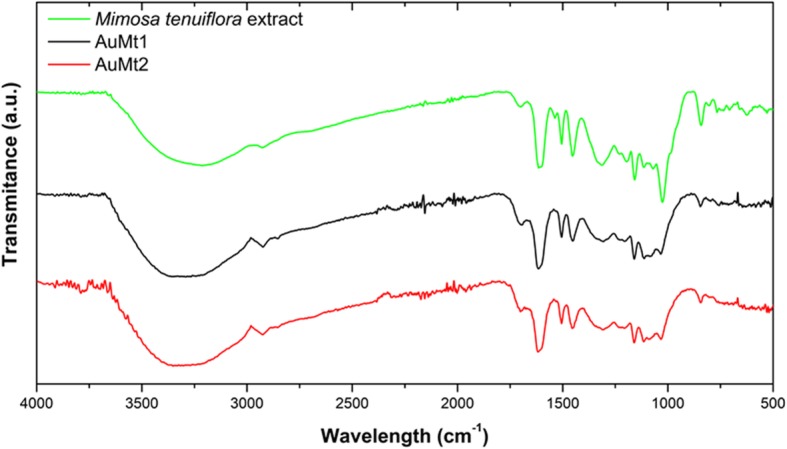
FTIR spectra. Mt extract (green), AuMt1 (black) and AuMt2 (red)
X-ray Photoelectron Spectroscopy (XPS)
In the XPS survey scan analysis for AuMt1 and AuMt2, the samples have clearly shown the presence of oxygen (O 1s), carbon (C 1s) and gold (Au 4f), whose peaks are centered around of 532, 284, and 85 eV, respectively, as shown in Fig. 4a, b. High-resolution XPS experiments were made to establishing a relative abundance of different functional groups of molecules that coat AuNP surfaces. Au4f high-resolution XPS spectra for AuMt1 and AuMt2 consist of two symmetric peaks separated by 3.7 eV (Fig. 4b, e). Peaks associated with 4f5/2 spin-orbital coupling are located on binding energy (BE) of 88.6 and 87.7 eV for AuMt1 and AuMt2, respectively. For 4f7/2, spin-orbital coupling peaks are located on 84.9 and 84.0 eV. The link of intensities (I4f7/2 > I4f5/2) and location and separation (ΔBE = 3.7 eV) between peaks confirm that gold ions (Au3+) are reduced completely to metallic gold Au0 [63]. Au4f signals, for AuMt1, are slightly shifted (~ 0.9 eV) at higher energies with respect to sample AuMt2. This can be explained in terms of NP size differences between samples. AuMt1 has a half population of NPs with size less to 40 nm, while AuMt2 NPs have a mean diameter of 150 nm, determined by TEM. Peak shift for Au4f signals, due to the presence of small NPs, has been reported by other authors who relate the Au4f BE increase with decreasing NP size [64, 65]. Also, the shift effect could be due to the interaction of functional groups capped on surfaces of AuNPs [66]. In Fig. 4c, f, the high-resolution XPS spectra of C1s are shown for AuMt1 and AuMt2. Spectra were deconvoluted by 3 Gaussian bands associated with C=O, C–O, and C–C or C=C. For AuMt1, peaks are centered on 286.9, 286.1, and 284.5 eV, for AuMt2 on 287.0, 286.3, and 284.7 eV, respectively. Comparing the experimental XPS curves for C 1s, we see appreciable differences between AuMt1 and AuMt2. The main difference comes from a significant decrease in AuMt1 of the signal associated with C–O group. Comparing the percentage contributions of each group, obtained from the deconvolutions (Additional file 1: Table S2), we see that in AuMt2 contribution of C–O signal is 27.8% while in AuMt1 is 16.6%. This difference can be explained in terms of the oxide-reduction reaction that gives rise to the process of AuNP formation. The synthesis of AuMt1 is added twice the metal precursor (HAuCl4 is 0.01 M) than in synthesis of AuMt2. In both cases, the same amount of extract is used as a reducing agent, so in AuMt1, more hydroxyl groups (−C–OH) are consumed to reduce a greater number of Au3+ ions. Thus, a decrease of C–O signal in AuMt1 confirms that hydroxyl groups participate in the synthesis reaction. High-resolution XPS of O 1s revealed that carbonyl C=O is the most abundant group (Additional file 1: Figure S4 and Table S2). In addition, the content of the C=O group is higher in the AuMt1 sample, which confirms what was previously discussed.
Fig. 4.

XPS spectra of AuMt1 and AuMt2. a, d Survey spectra, b, e Au4f high resolution, and c, f C1s high resolution
XPS and FTIR indicate that AuMtNPs interact mainly with carbonyl groups (ketones) in addition to hydroxyl groups of Mimosa tannins, saponins, and other molecules that participate in the reduction of Au3+ to Au0 and stabilization of AuMtNPs [63, 67, 68].
Transmission Electron Microscopy
AuMt1 TEM micrographs are shown in Fig. 5a, b and AuMt2 in Fig. 5d, e showing products’ shape distribution. AuMt1 has the biggest diversity in shapes. AuMt shape is determined by the relationship between the variation of metal precursor concentration and Mt extract at a fixed concentration. In this case, NPs were observed without cleaning the extract to observe the interaction that forms around the AuMt. As observed in the micrographs, an extract is placed on the surface; however, NPs are kept dispersed and no aggregation is shown. Figure 5c, f show size distribution for each sample, and AuMt1 have an average size dispersion of 40 nm and AuMt2 of 150 nm.
Fig. 5.

Size distributions by TEM. a, b, c AuMt1 and d, e, f AuMt2
In Fig. 6a, AuMt TEM micrographs were also analyzed by EDS (Fig. 6b), which showed Au presence. Other chemical elements such as Cl, O, and Ca, on EDS spectrum, come from the extract that surrounds NPs. According to the crystallographic tab (JCPDS file: 04-0784), the obtained distances between 2.35 and 2.03 Å (Fig. 6c) correspond to Au crystalline planes (111) and (200).
Fig. 6.
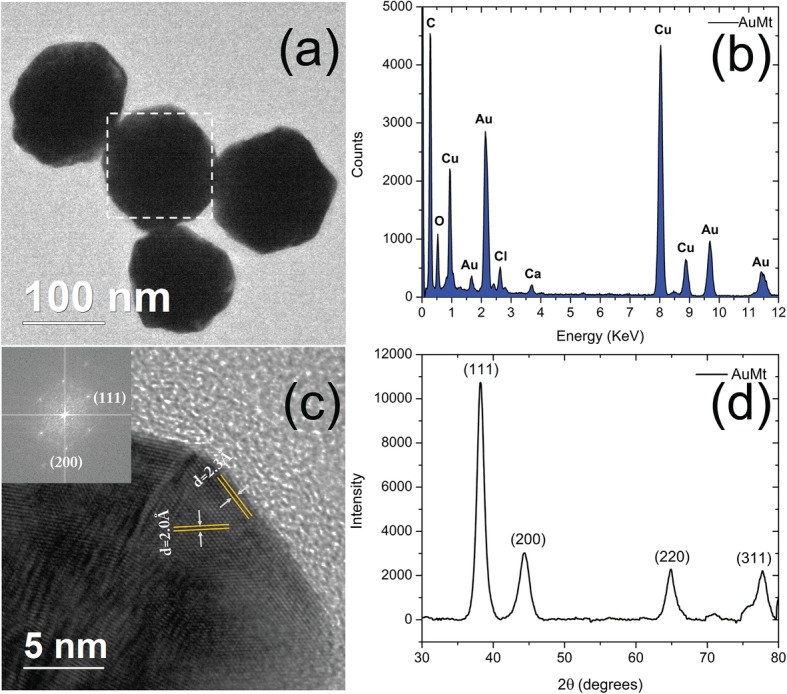
Nanostructural characterization of AuMt. a TEM, b EDS, c single HRTEM, and FFT and d XRD
X-ray Diffraction (XRD)
Figure 6d shows the characteristic AuMt XRD diffraction peak at 2Ɵ, which are in 38.17, 44.37, 64.81, and 77.66o corresponding with the planes (111), (200), (220), and (311), respectively; these planes correspond with the face-centered cubic Au (space group Fm3m, JCPDS File No. 89-3722). High Score Plus and Origin software were used for the analysis [69].
Biological Tests
Cytotoxicity by MTT and Live/Dead Assay
To evaluate AuMt1 and AuMt2 toxicity, tests were performed on HUVEC cells using MTT. Four concentrations and two times for both materials were evaluated. In Fig. 7a, it is observed that at 24 h for AuMt1, cell viability decreases between 10 and 20%, only in concentrations higher than 25 μg/mL. For AuMt2, a similar effect is obtained in cell viability; however, the concentration of 100 μg/mL seems to have no effect on these tests. In Fig. 7b, MTT tests at 48 h for AuMt1 and AuMt2 are shown. For AuMt1, it is easy to notice that concentration with the greatest effect is 50 μg/mL, where the viability drops almost 30% compared to the control. The concentration of 50 μg/mL seems to be the concentration with the highest toxic effect; however, when the obtained data were analyzed, it is found that there is no significant difference between the obtained data on 24 and 48 h, a similar result obtained for 100 and 200 μg/mL, Fig. 7c. For AuMt2, a toxic effect between 20 and 30% is observed only on 100 and 200 μg/mL, while 25 and 50 μg/mL show no significant difference, compared to the observed effect at 24 h, Fig. 7d. This seems to correlate with AuMt2 size growth in s-DMEM (Additional file 1: Figure S2) where at a concentration of 100 μg/mL, they begin to aggregate. In the work published by Chandran et al. [70], they used gold nanoparticles coated with branched polyethyleneimine (BPEI), lipoic acid (LA), and polyethylene glycol (PEG), where they see an important toxicity in HUVEC cells by nanoparticles coated with BPEI, which have sizes of 40 and 80 nm, where viability is between 20 and 30%. When these particles are covered with human serum proteins, it is found that toxicity decreases; this is due to the corona effect. Recently, Zhaleh et al. [71] have reported the biogenic synthesis of 40-nm gold nanoparticles using leaf extracts from Gundelia tournefortii L. plant. Interestingly and in contrast to our results, the authors indicate that MTT cell viability tests for these particles in HUVEC, the cell viability was 95% at 1000 μg/mL; however, they do not establish if the low cytotoxicity is due to the fact that there is no material internalization or if the particles are harmless due to protein corona. In this sense, bioreductive compounds present in Gundelia tournefortii L extract are different from those reported for Mimosa tenuiflora extract (Additional file 1: Figure S3). Thus, the interactions of these two nanoparticle systems with proteins present in FBS are very different, which may explain the differences in cytotoxic responses.
Fig. 7.

Viability assay using MTT in HUVEC cell. a For 24 h and b 48 h. 0ne-way ANOVA analysis with (*p < 0.05). Comparison between 24 and 48 h for c AuMt1 and d AuMt2 with ANOVA analysis with Tukey tests (n.s. no significance and (*p < 0.05))
As mentioned above, AuMt1at a 50-μg/mL concentration shows the highest toxicity and cellular uptake. We believe that toxicity may be due to the fact that the nanomaterial has a low affinity to s-DMEM proteins, since it has only 16.6% of hydroxyl groups on the surface to promote hydrogen bonding with S-DMEM proteins. The fact that the material toxicity decreases as AuMt1 concentration increases may be due to a cellular detoxification response, like an exocytosis caused by high intracellular content of gold [70]. For AuMt2, the toxicity effect at 100 and 200 μg/mL may be due to nanomaterial agglomeration, which could be attaching to the membrane causing adverse effects for the cells; however, more experiments are required to confirm this hypothesis.
Only one concentration (50 μg/mL) was chosen to be evaluated by live/dead fluorescent dye; this is due to the purpose of confirming the MTT results and later analyzing the metallic NP internalization in HUVEC cells, avoiding a field saturation by NPs. When cells were stained with live/dead fluorescent dye kit, it was found that a large part of the cell population favorably marked for calcein and just a few for ethidium homodimer, indicating that cell culture is viable, as shown in Fig. 8.
Fig. 8.
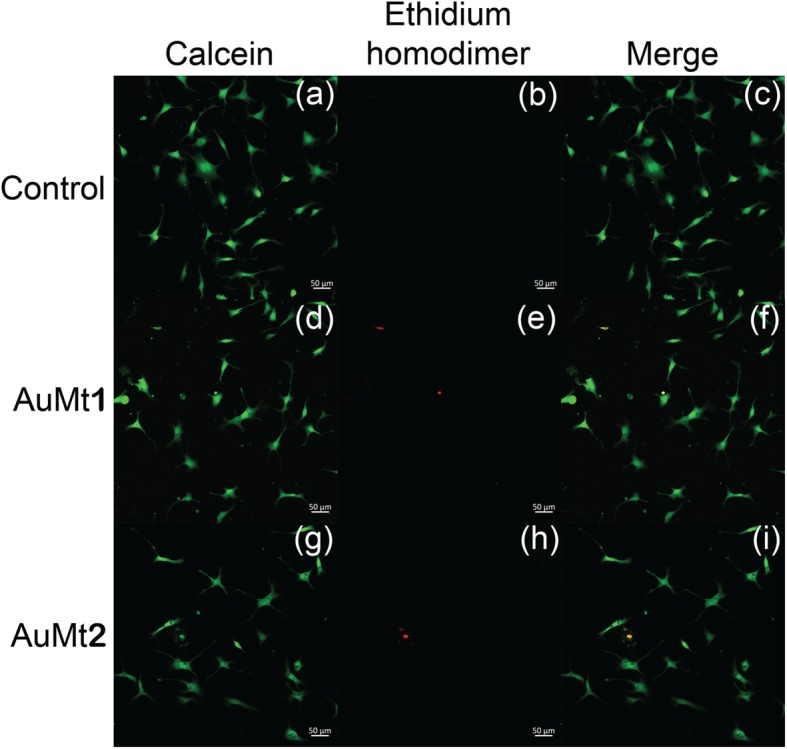
Live/dead assay in HUVEC cells. a, d, and g with calcein; b, e, and h with ethidium homodimer; and c, f, and i merge by confocal microscopy
Confocal Laser Scanning Microscopy: Fluorescence of AuMt
In Fig. 9a, d are shown micrographs of AuMt1 and AuMt2 in bright field and in Fig. 9b, e, their corresponding fluorescence, captured by confocal microscopy. Red fluorescence of AuMt (collected emission 650–700 nm) was excited employing 640 nm diode laser, and a mayor size of NPs can be appreciated in AuMt2 sample than AuMt1. In the merge images in Fig. 9c, f, it can be observed how the luminescence comes exclusively from the dark points associated with the NPs. This indicates that the cleaning process effectively removed the extract that is not complexed to the nanomaterial, so there is no background emission. It is interesting to observe that an intense fluorescence of the NPs captured by the confocal system is achieved at a very low excitation power of the laser (below 0.5 mW). So, this NPs system can be fluorescently traced efficiently in cellular systems with little risk of phototoxicity. Some authors have reported fluorescent emission about 610 nm, suggesting intrinsic Au fluorescence [72, 73]. AuNPs emission is related to the core size confinement effect that generates discreet electronic states [74]. However, in our case, the metal surface is covered with flavonoids, which show fluorescence, and when complexing with AuNPs, the fluorescence of both is enhanced. Different authors have reported that fluorescence is largely enhanced by charge transfer from the surface ligands to the metal core via S–Au bonds [75]. It has also been reported that ligands (thiol molecules, DNA oligonucleotides, dendrimers, polymers, peptides, and proteins) affect AuNPs optical and electronic properties since its fluorescent properties can be significantly affected by their surface chemistry [76].
Fig. 9.
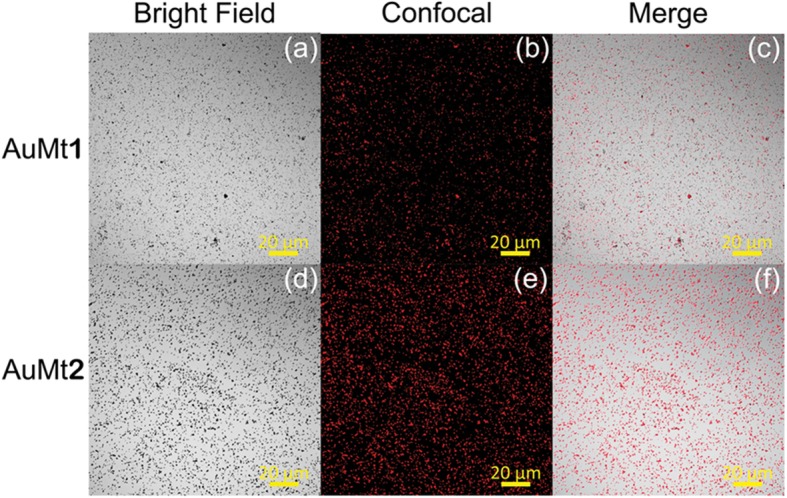
AuMt1 and AuMt2 fluorescence. a, d Bright field. b, e Confocal. c, f Merge
Cellular Internalization
Cells were also analyzed, by confocal microscopy, after 24 h incubation, with AuMt1 and AuMt2 at a concentration of 50 μg/mL. The nucleus is shown in blue color using DAPI Fig. 10a, and the cytoskeleton structure was stained with anti-beta actin in green color Fig. 10b and merge Fig. 10c. The observed micrographs were obtained through 3 different channels on separate tracks, where the excitation wavelengths were 405, 488, and 640 nm for DAPI, anti-beta actin, and AuMt, respectively.
Fig. 10.
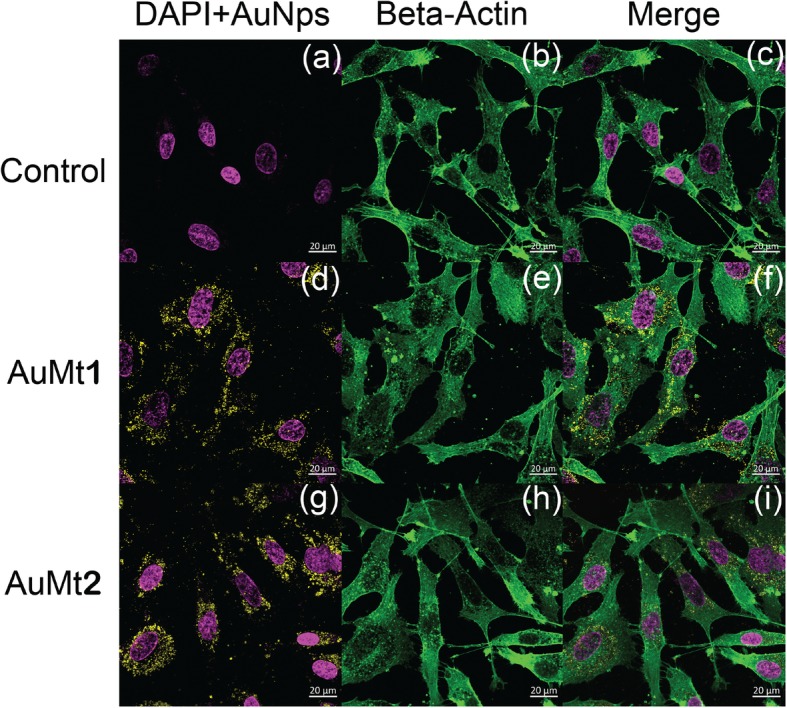
AuMt1 and AuMt2 cellular internalization. a, d, and g with DAPI; b, e, and h with beta-actin; and c, f, and i merge by confocal microscopy
As previously described, cells were also analyzed by confocal microscopy, for AuMt1 and AuMt2 internalization, at a concentration of 50 μg/mL. Confocal micrographs show that AuMt are internalized in HUVEC cells cytosolic space, and many of these particles are surrounding the nucleus, without being internalized in it. When not observing particles in the nucleus, a more meticulous analysis was carried out, by cell orthogonal projection and a 3-D reconstruction. Observing the micrographs of both reconstructions, it is possible to notice that AuMt is distributed differentially. In Fig. 11a, b for AuMt1, it can be observed that a material is dispersed in the cytoplasm, while in AuMt2, the material is concentrated in the nuclear periphery, as shown in Fig. 11c, d. We were not able to find NPs in the nucleus, and this suggests that the nanomaterial has little or no genotoxic potential, since it has no way of interacting with nuclear DNA, which is a quality for a nanocarrier. Efficient cellular uptake depends on NP size, shape, charge, and coating, the parameters that can affect their interactions with cell proteins. The fact that polyphenolic compounds are found on AuMt surface could facilitate the nanomaterial internalization, which would make it a candidate as a possible pharmacological nanocarrier [77–79].
Fig. 11.

Orthogonal projections and 3-D images. a, c AuMt1 and AuMt2 cellular internalization analysis through orthogonal projection and b, d 3-D reconstruction by confocal microscopy
The obtained results for an AuMtNP cellular uptake in HUVEC by a confocal microscopy at 50 μg/mL suggests that AuMt1 interacts with the cells in a greater quantity than AuMt2 in a 3:1 ratio, as seen in Additional file 1: Figures S5–S7. If we consider that protein corona in AuMt1 is 9.1 nm smaller than in AuMt2, we can suggest that AuMt1-efficient internalization by HUVEC cells is given by a combination of factors such as AuMt1 smaller size, the highest absolute value of z potential and the lower thickness of protein corona. This indicates a poor protein coverage that allows partial exposure of the nanoparticle surface, which is rich in extract molecules. Therefore, nanoparticles can interact by means of extract molecules with surface-specific membrane receptors that facilitate the internalization of AuMt1.
Catalytic Tests
Catalysis
Analysis of catalytic reaction was realized to calculate the degradation percentage (%D) using the Eq. (5):
| 5 |
using the A0 absorbance at t = 0 and A is the absorbance at time t. Langmuir-Hinshelwood equation was used to calculate the slope of the regression plot versus irradiation time [80], which is expressed in Eq. (6) and K is the first-order rate constant of the degradation ratio:
| 6 |
For the analysis of catalytic activity on MB degradation, the absorbance at 660 nm was monitored. Figure 12 shows the AuMt1 and AuMt2 catalytic activity, where a decrease on maximum absorption of MB is observed as time progresses Fig. 12a, d. MB degradation and its conversion to leucomethylene is confirmed by progressive decreases of the absorbance at 292, 614, and 660 nm correspond to MB and by the increase in time of the absorbance at 256 nm associated with leucomethylene. Homogeneous catalysis reaches a 50% MB degradation at 190 s Fig. 12b, while the degradation ratio K for the total process is 8.24 × 10⁻³s to AuMt1 Fig. 11c. AuMt2 reaches a 50% of MB degradation in 400 s, Fig. 12e, and K takes the value of 3.54 × 10⁻³/s, Fig. 12f.
Fig. 12.

AuMt1 and AuMt2 Catalysis. a, d UV-Vis spectra. b, e Percentage. c, f Ratio of MB degradation
On this way, AuMt1 have a more efficient response than AuMt2. We observed a size-dependent effect (AuMt) in degradation ratio [81], and a total surface area of NPs is inversely proportional to the NP size [37]. Table 2 shows a comparison between different green syntheses of AuNPs and their K obtained in size function.
Table 2.
Comparison of K for degradation of MB using AuNPs as a size function
Conclusions
In this work, we show for the first time that the extracts of bark of Mimosa tenuiflora allow the production at room temperature of gold nanoparticles by means of one-pot synthesis. AuNP sizes are easily controlled by regulating a metal precursor/reducing an extract ratio. It was observed that AuMt1 and AuMt2 cellular uptakes generate a moderate cytotoxic effect at 24 and 48 h post exposition. However, toxicity does not behave in a dose-dependent manner, which suggests different action mechanisms for AuMt1 and AuMt2. XPS and FTIR indicate that AuMtNPs interact mainly with carbonyl groups (ketones) in addition to hydroxyl groups of Mimosa tannins, saponins, and other molecules that participate in the reduction of Au3+ to Au0 and stabilization of nanomaterials. Polyphenols adsorbed on AuMtNPs facilitate nanoparticle internalization. AuMt2 were located near the nuclear periphery, but for AuMt1, it was observed that nanoparticles distribute on the whole cell and present a 3 fold uptake in comparison to AuMt2. Due to the fluorescence property at low excitation power and a high cellular uptake, AuMtNPs synthesized with Mt bark extracts are candidates for its implementation as drug nanocarriers and fluorescent probes in cells. However, other strategies must be addressed, in order to reduce the nanomaterial toxicity. Finally, it was observed that AuMtNPs showed a relevant catalytic activity on MB degradation using NaBH4 as a reducing agent.
Supplementary information
Additional file 1: Table S1. Formulations used in AuMt1 and AuMt2 synthesis. Figure S1. Time-dependent pH change of AuMtNPs synthesis. The inset shows mechanism for the reduction of gold ions into Au0 in presence of polyphenolics groups. Figure S2. DLS of AuMt1 and AuMt2 in water and sDMEM at 37 oC. Figure S3. Main reported compounds of Mimosa tenuiflora. Figure S4. Deconvolution signal of XPS O 1s of AuMt1 and AuMt2. Table S2. XPS Peak fitting gaussian parameters. Figure S5. Region of Interest (ROI) of AuMt1 in HUVEC for Uptake NPs in cells. Figure S6. ROI of AuMt2 in HUVEC for Uptake NPs in cells. Figure S7. Fluorescence Intensity for AuMt1 and AuMt2 in HUVEC cells obtained for confocal microscopy.
Acknowledgements
Authors would like to thank Laboratorio de Microscopía Electrónica de Transmisión and Laboratorio de Biomateriales of the University of Sonora.
Abbreviations
- ANOVA
Analysis of variance
- AuMt
Colloids formed by AuNPs and molecules of Mt
- AuNPs
Gold nanoparticles
- CLSM
Confocal laser scanning microscopy
- DLS
Dynamic light scattering
- DMEM
Dulbecco’s modified Eagle medium
- DMSO
Dimethyl sulfoxide
- DPPH
2,2-Diphenyl-1-picrylhydrazyl
- EDS
Energy dispersive X-rays spectroscopy
- FTIR
Fourier transform infrared spectroscopy
- HAuCl4
Tetracloroauric acid
- HRTEM
High-resolution TEM
- HUVEC
Human umbilical vein endothelial cells
- MB
Methylene blue
- Mt
Mimosa tenuiflora
- MTT
3-(4,5-Dimethylthiazolyl-2)-2,5-diphenyltetrazolium bromide
- NaBH4
Sodium borohydride
- PBS
Phosphate-buffered saline
- PdI
Polydispersity index
- PMT
Photomultiplier tube
- ROI
Region of interest
- SD
Standard deviations
- SPR
Surface plasmon resonance
- TEM
Transmission electron microscopy
- UV-Vis
Ultraviolet-visible
- XPS
X-ray photoelectron spectroscopy
- XRD
X-ray diffraction
Authors’ Contributions
RIP contributed to the formal analysis. ERL, BER, AMH, REN, CRB, ELR, RLE, and RIP contributed to the investigation. REN contributed to the methodology section of the study. ERL, CRB, and RIP contributed to the writing—original manuscript. All authors read and approved the final manuscript.
Funding
Authors would like to thank CONACYT Mexico for grant INFR-2014-01-225455 to acquire the X-ray single crystal diffractometer Bruker D8 QUEST used in this work. AMH would like to thank Conacyt for Post-Doctoral Fellowship (2018-000005-01NACV-01367).
Availability of Data and Materials
All datasets are presented in the main paper.
Ethics Approval and Consent to Participate
This work complies with the ethical standard.
Competing Interests
The authors declare that they have no competing interests.
Footnotes
Publisher’s Note
Springer Nature remains neutral with regard to jurisdictional claims in published maps and institutional affiliations.
Contributor Information
Ericka Rodríguez-León, Email: ericka.rodriguezleon@gmail.com.
Blanca E. Rodríguez-Vázquez, Email: brdgz16@gmail.com
Aarón Martínez-Higuera, Email: aaronmartinezh@gmail.com.
César Rodríguez-Beas, Email: cesaragosto@ciencias.uson.mx.
Eduardo Larios-Rodríguez, Email: elariosg@gmail.com.
Rosa E. Navarro, Email: rnavarro@guaymas.uson.mx
Ricardo López-Esparza, Email: ricardo.lopez@unison.mx.
Ramón A. Iñiguez-Palomares, Email: ramonalfonso.iniguez@gmail.com
Supplementary information
Supplementary information accompanies this paper at 10.1186/s11671-019-3158-9.
References
- 1.Ahmed S, Ahmad M, Swami BL, Ikram S. A review on plants extract mediated synthesis of silver nanoparticles for antimicrobial applications: a green expertise. J Adv Res. 2016;7(1):17–28. doi: 10.1016/j.jare.2015.02.007. [DOI] [PMC free article] [PubMed] [Google Scholar]
- 2.Prasad R. Synthesis of silver nanoparticles in photosynthetic plants. J Nanopart. 2014;2014:1–8. doi: 10.1155/2014/963961. [DOI] [Google Scholar]
- 3.Govindarajan M, AlQahtani FS, AlShebly MM, Benelli G. One-pot and eco-friendly synthesis of silver nanocrystals using Adiantum raddianum: toxicity against mosquito vectors of medical and veterinary importance. J Appl Biomed. 2017;15(2):87–95. doi: 10.1016/j.jab.2016.10.004. [DOI] [Google Scholar]
- 4.La Torre A, Caradonia F, Gianferro M, Molinu MG, Battaglia V. Activity of natural products against some phytopathogenic fungi. Commun Agric Appl Biol Sci. 2014;79(3):439–449. [PubMed] [Google Scholar]
- 5.Martel-Estrada SA, Olivas-Armendáriz I, Santos-Rodríguez E, Martínez-Pérez CA, García-Casillas PE, Hernández-Paz J, Rodríguez-González CA, Chapa-González C. Evaluation of in vitro bioactivity of Chitosan/Mimosa tenuiflora composites. Mat Lett. 2014;119:146–149. doi: 10.1016/j.matlet.2014.01.004. [DOI] [Google Scholar]
- 6.Valencia-Gómez LE, Martel-Estrada SA, Vargas-Requena C, Rivera-Armenta JL, Alba-Baena N, Rodríguez-González C, Olivas-Armendáriz I. Chitosan/Mimosa tenuiflora films as potential cellular patch for skin regeneration. Int J Biol Macromol. 2016;93:1217–1225. doi: 10.1016/j.ijbiomac.2016.09.083. [DOI] [PubMed] [Google Scholar]
- 7.Priyadarshini E, Pradhan N. Gold nanoparticles as efficient sensors in colorimetric detection of toxic metal ions: a review. Sens Actuator B Chem. 2017;238:888–902. doi: 10.1016/j.snb.2016.06.081. [DOI] [Google Scholar]
- 8.Souza RSOD, Albuquerque UPD, Monteiro JM, Amorim ELCD. Jurema-Preta (Mimosa tenuiflora [Willd.] Poir.): a review of its traditional use, phytochemistry and pharmacology. Braz Arch Biol Technol. 2008;51(5):937–947. doi: 10.1590/S1516-89132008000500010. [DOI] [Google Scholar]
- 9.de Morais Leite SC, Medeiros CASI, Maia PCGGS, Magalhães MIS, Freitas FOR, Pessôa HDLF, Nogueira TBSS, de Morais AMB, Mazzaro VDM, Brustein VP, de Almeida Filho GG. Antibacterial and hemolytic activities of Mimosa tenuiflora (Willd) Poir.(Mimosoidea) Afr J Microbiol Res. 2015;9(42):2166–2171. [Google Scholar]
- 10.Bautista E, Calzada F, Ortega A, Yépez-Mulia L. Antiprotozoal activity of flavonoids isolated from Mimosa tenuiflora (Fabaceae-Mimosoideae) J Mex Chem Soc. 2011;55(4):251–253. [Google Scholar]
- 11.Jiang Y, Massiot G, Lavaud C, Teulon JM, Guéchot C, Haag-Berrurier M, Anton R. Triterpenoid glycosides from the bark of Mimosa tenuiflora. Phytochem. 1991;30(7):2357–2360. doi: 10.1016/0031-9422(91)83648-5. [DOI] [PubMed] [Google Scholar]
- 12.Kharissova OV, Dias HR, Kharisov BI, Pérez BO, Pérez VMJ. The greener synthesis of nanoparticles. Trends Biotechnol. 2013;31(4):240–248. doi: 10.1016/j.tibtech.2013.01.003. [DOI] [PubMed] [Google Scholar]
- 13.Hanan N, Chiu H, Ramachandran M, Tung W, Mohamad Zain N, Yahaya N, Lim V. Cytotoxicity of plant-mediated synthesis of metallic nanoparticles: a systematic review. Int J Mol Sci. 2018;19(6):1725. doi: 10.3390/ijms19061725. [DOI] [PMC free article] [PubMed] [Google Scholar]
- 14.Amendola V, Pilot R, Frasconi M, Marago OM, Iati MA. Surface plasmon resonance in gold nanoparticles: a review. J Phys: Condens Matter. 2017;29(20):203002. doi: 10.1088/1361-648X/aa60f3. [DOI] [PubMed] [Google Scholar]
- 15.Ogarev VA, Rudoi VM, Dement’eva OV. Gold nanoparticles: synthesis, optical properties, and application. Inorganic Materials: Appl Res. 2018;9(1):134–140. doi: 10.1134/S2075113318010197. [DOI] [Google Scholar]
- 16.Ghosh SK, Pal T. Interparticle coupling effect on the surface plasmon resonance of gold nanoparticles: from theory to applications. Chem Rev. 2007;107(11):4797–4862. doi: 10.1021/cr0680282. [DOI] [PubMed] [Google Scholar]
- 17.Pattanayak S, Chakraborty S, Biswas S, Chattopadhyay D, Chakraborty M. Degradation of methyl parathion, a common pesticide and fluorescence quenching of Rhodamine B, a carcinogen using β-d glucan stabilized gold nanoparticles. J Saudi Chem Soc. 2018;22(8):937–948. doi: 10.1016/j.jscs.2018.02.004. [DOI] [Google Scholar]
- 18.Anand K, Gengan RM, Phulukdaree A, Chuturgoon A. Agroforestry waste Moringa oleifera petals mediated green synthesis of gold nanoparticles and their anti-cancer and catalytic activity. J Ind Eng Chem. 2015;21:1105–1111. doi: 10.1016/j.jiec.2014.05.021. [DOI] [Google Scholar]
- 19.Bogireddy NKR, Anand KKH, Mandal BK. Gold nanoparticles—synthesis by Sterculia acuminata extract and its catalytic efficiency in alleviating different organic dyes. J Mol Liq. 2015;211:868–875. doi: 10.1016/j.molliq.2015.07.027. [DOI] [Google Scholar]
- 20.Liu L, Corma A. Metal catalysts for heterogeneous catalysis: from single atoms to nanoclusters and nanoparticles. Chem Rev. 2018;118(10):4981–5079. doi: 10.1021/acs.chemrev.7b00776. [DOI] [PMC free article] [PubMed] [Google Scholar]
- 21.Singh AK. Srivastava ON (2015) one-step green synthesis of gold nanoparticles using black Cardamom and effect of pH on its synthesis. Nanoscale Res Lett. 2015;10:353. doi: 10.1186/s11671-015-1055-4. [DOI] [PMC free article] [PubMed] [Google Scholar]
- 22.Paul B, Bhuyan B, Purkayastha DD, Dey M, Dhar SS. Green synthesis of gold nanoparticles using Pogestemon benghalensis (B) O. Ktz. leaf extract and studies of their photocatalytic activity in degradation of methylene blue. Mat Lett. 2015;148:37–40. doi: 10.1016/j.matlet.2015.02.054. [DOI] [Google Scholar]
- 23.Baruah D, Goswami M, Yadav RNS, Yadav A, Das AM. Biogenic synthesis of gold nanoparticles and their application in photocatalytic degradation of toxic dyes. J Photochem Photobiol B Biol. 2018;186:51–58. doi: 10.1016/j.jphotobiol.2018.07.002. [DOI] [PubMed] [Google Scholar]
- 24.Ansar SM, Kitchens CL. Impact of gold nanoparticle stabilizing ligands on the colloidal catalytic reduction of 4-nitrophenol. ACS Catal. 2016;6(8):5553–5560. doi: 10.1021/acscatal.6b00635. [DOI] [Google Scholar]
- 25.Metz KM, Sanders SE, Pender JP, Dix MR, Hinds DT, Quinn SJ, Ward AD, Duffy P, Cullen RJ, Colavita PE. Green synthesis of metal nanoparticles via natural extracts: the biogenic nanoparticle corona and its effects on reactivity. ACS Sustain Chem Eng. 2015;3(7):1610–1617. doi: 10.1021/acssuschemeng.5b00304. [DOI] [Google Scholar]
- 26.Gharatape A, Salehi R. Recent progress in theranostic applications of hybrid gold nanoparticles. Eur J Med Chem. 2017;138:221–233. doi: 10.1016/j.ejmech.2017.06.034. [DOI] [PubMed] [Google Scholar]
- 27.Colangelo E, Comenge J, Paramelle D, Volk M, Chen Q, Levy R. Characterizing self-assembled monolayers on gold nanoparticles. Bioconjug Chem. 2016;28(1):11–22. doi: 10.1021/acs.bioconjchem.6b00587. [DOI] [PubMed] [Google Scholar]
- 28.Jia YP, Ma BY, Wei XW, Qian ZY. The in vitro and in vivo toxicity of gold nanoparticles. Chin Chem Lett. 2017;28(4):691–702. doi: 10.1016/j.cclet.2017.01.021. [DOI] [Google Scholar]
- 29.Fratoddi I, Venditti I, Camettib C, Russo MV. The puzzle of toxicity of gold nanoparticles. The case-study of HeLa cells. Toxicol Res. 2015;4:796–800. doi: 10.1039/C4TX00168K. [DOI] [Google Scholar]
- 30.Bodelon G, Costas C, Perez-Juste J, Pastoriza-Santos I, Liz-Marzan LM. Gold nanoparticles for regulation of cell function and behavior. Nano Today. 2017;13:40–60. doi: 10.1016/j.nantod.2016.12.014. [DOI] [Google Scholar]
- 31.Eman HI, Aliyah MA, Eman A, Arshi N, Rawda MO. Successful green synthesis of gold nanoparticles using a Corchorus olitorius extract and their antiproliferative effect in cancer cells. Int J Mol Sci. 2018;19:2612. doi: 10.3390/ijms19092612. [DOI] [PMC free article] [PubMed] [Google Scholar]
- 32.Rossi A, Donati S, Fontana L, Porcaro F, Battocchio C, Proietti E, Venditti I, Bracci L, Fratoddi I. Negatively charged gold nanoparticles as a dexamethasone carrier: stability in biological media and bioactivity assessment in vitro. RSC Adv. 2016;6:99016–99022. doi: 10.1039/C6RA19561J. [DOI] [Google Scholar]
- 33.Aljabali AA, Akkam Y, Al Zoubi MS, Al-Batayneh KM, Al-Trad B, Abo-Alrob O, Alkilany AM, Benarama M, Evans DJ. Synthesis of gold nanoparticles using leaf extract of Ziziphus zizyphus and their antimicrobial activity. Nanomater. 2018;8:174. doi: 10.3390/nano8030174. [DOI] [PMC free article] [PubMed] [Google Scholar]
- 34.Hossen MN, Murphy B, Garcia-Hevia L, Bhattacharya R, Mukherjee P. Probing cellular processes using engineered nanoparticles. Bioconjug Chem. 2018;29(6):1793–1808. doi: 10.1021/acs.bioconjchem.8b00026. [DOI] [PMC free article] [PubMed] [Google Scholar]
- 35.Her S, Jaffray DA Allen C. Gold nanoparticles for applications in cancer radiotherapy: mechanisms and recent advancements. Adv Drug Del Rev. 2017;109:84–101. doi: 10.1016/j.addr.2015.12.012. [DOI] [PubMed] [Google Scholar]
- 36.Cabuzu D, Cirja A, Puiu R, Grumezescu AM. Biomedical applications of gold nanoparticles. Curr Top Med Chem. 2015;15(16):1605–1613. doi: 10.2174/1568026615666150414144750. [DOI] [PubMed] [Google Scholar]
- 37.Venditti I, Hassanein TF, Fratoddi I, Fontana L, Battocchio C, Rinaldi F, Carafa M, Marianecci C, Diociaiuti M, Agostinelli E, Cametti C, Russo MV. Bioconjugation of gold-polymer core–shell nanoparticles with bovine serum amine oxidase for biomedical applications. Colloids Surf B Biointerfaces. 2015;134:314–321. doi: 10.1016/j.colsurfb.2015.06.052. [DOI] [PubMed] [Google Scholar]
- 38.Dykman LA, Khlebtsov NG. Immunological properties of gold nanoparticles. Chem Sci. 2017;8(3):1719–1735. doi: 10.1039/C6SC03631G. [DOI] [PMC free article] [PubMed] [Google Scholar]
- 39.Ajnai G, Chiu A, Kan T, Cheng CC, Tsai TH, Chang J. Trends of gold nanoparticle-based drug delivery system in cancer therapy. J Exp Clin Med. 2014;6(6):172–178. doi: 10.1016/j.jecm.2014.10.015. [DOI] [Google Scholar]
- 40.Kumar B, Smita K, Cumbal L, Camacho J, Hernández-Gallegos E, de Guadalupe C-LM, Grijalva M, Andrade K. One pot phytosynthesis of gold nanoparticles using Genipa americana fruit extract and its biological applications. Mater Sci Eng C. 2016;62:725–731. doi: 10.1016/j.msec.2016.02.029. [DOI] [PubMed] [Google Scholar]
- 41.Markus J, Wang D, Kim YJ, Ahn S, Mathiyalagan R, Wang C, Yang DC. Biosynthesis, characterization, and bioactivities evaluation of silver and gold nanoparticles mediated by the roots of Chinese herbal Angelica pubescens Maxim. Nanoscale Res Lett. 2017;12(1):46. doi: 10.1186/s11671-017-1833-2. [DOI] [PMC free article] [PubMed] [Google Scholar]
- 42.Conde-Hernández LA, Guerrero-Beltrán JÁ. Total phenolics and antioxidant activity of Piper auritum and Porophyllum ruderale. Food Chem. 2014;142:455–460. doi: 10.1016/j.foodchem.2013.07.078. [DOI] [PubMed] [Google Scholar]
- 43.de Camargo AC, Regitano-d’Arce MAB, Biasoto ACT, Shahidi F. Low molecular weight phenolics of grape juice and winemaking byproducts: antioxidant activities and inhibition of oxidation of human low-density lipoprotein cholesterol and DNA strand breakage. J Agric Food Chem. 2014;62(50):12159–12171. doi: 10.1021/jf504185s. [DOI] [PubMed] [Google Scholar]
- 44.Hunter RJ. Foundations of colloid science. 2. New York: Oxford university press; 2001. [Google Scholar]
- 45.Hunter RJ. Zeta potential in colloid science: principles and applications. 3. San Diego: Academic press; 2013. [Google Scholar]
- 46.Gunduz N, Ceylan H, Guler MO, Tekinay AB. Intracellular accumulation of gold nanoparticles leads to inhibition of macropinocytosis to reduce the endoplasmic reticulum stress. Sci Rep. 2017;7:40493. doi: 10.1038/srep40493. [DOI] [PMC free article] [PubMed] [Google Scholar]
- 47.Lee YJ, Ahn EY, Park Y. Shape-dependent cytotoxicity and cellular uptake of gold nanoparticles synthesized using green tea extract. Nanoscale Res Lett. 2019;14(1):129. doi: 10.1186/s11671-019-2967-1. [DOI] [PMC free article] [PubMed] [Google Scholar]
- 48.Wang K, Zhang Y, Wang J, Yuan A, Sun M, Wu J, Hu Y. Self-assembled IR780-loaded transferrin nanoparticles as an imaging, targeting and PDT/PTT agent for cancer therapy. Sci Rep. 2016;6:27421. doi: 10.1038/srep27421. [DOI] [PMC free article] [PubMed] [Google Scholar]
- 49.Rodríguez-León E, Iñiguez-Palomares R, Navarro RE, Herrera-Urbina R, Tánori J, Iñiguez-Palomares C, Maldonado A. Synthesis of silver nanoparticles using reducing agents obtained from natural sources (Rumex hymenosepalus extracts) Nanoscale Res Lett. 2013;8(1):1–9. doi: 10.1186/1556-276X-8-318. [DOI] [PMC free article] [PubMed] [Google Scholar]
- 50.Sathishkumar G, Jha PK, Vignesh V, Rajkuberan C, Jeyaraj M, Selvakumar M, et al. Cannonball fruit (Couroupita guianensis, Aubl.) extract mediated synthesis of gold nanoparticles and evaluation of its antioxidant activity. J Mol Liq. 2016;215:229–236. doi: 10.1016/j.molliq.2015.12.043. [DOI] [Google Scholar]
- 51.Muthuvel A, Adavallan K, Balamurugan K, Krishnakumar N. Biosynthesis of gold nanoparticles using Solanum nigrum leaf extract and screening their free radical scavenging and antibacterial properties. Biomed Prev Nutr. 2014;4(2):325–332. doi: 10.1016/j.bionut.2014.03.004. [DOI] [Google Scholar]
- 52.Watzky MA, Finke RG. Gold nanoparticle formation kinetics and mechanism: a critical analysis of the “redox crystallization” mechanism. ACS Omega. 2018;3(2):1555–1563. doi: 10.1021/acsomega.7b01772. [DOI] [PMC free article] [PubMed] [Google Scholar]
- 53.Suchomel P, Kvitek L, Prucek R, Panacek A, Halder A, Vajda S, Zboril R. Simple size-controlled synthesis of Au nanoparticles and their size-dependent catalytic activity. Sci Rep. 2018;8(1):4589. doi: 10.1038/s41598-018-22976-5. [DOI] [PMC free article] [PubMed] [Google Scholar]
- 54.Sivaraman SK, Elango I, Kumar S, Santhanam V. A green protocol for room temperature synthesis of silver nanoparticles in seconds. Curr Sci. 2009;97(7):1055–1059. [Google Scholar]
- 55.Rahme K, Holmes JD. Gold nanoparticles: synthesis, characterization, and bioconjugation. In: Lyshevski SE editors. Dekker Encyclopedia of Nanoscience and Nanotechnology. London: CRC Press; Taylor & Francis; 2015. p.1–11.
- 56.Qu H, Linder SW, Mudalige TK. Surface coating and matrix effect on the electrophoretic mobility of gold nanoparticles: a capillary electrophoresis-inductively coupled plasma mass spectrometry study. Anal Bioanal Chem. 2017;409(4):979–988. doi: 10.1007/s00216-016-0012-0. [DOI] [PubMed] [Google Scholar]
- 57.Aljabali A, Akkam Y, Al Zoubi M, Al-Batayneh K, Al-Trad B, Abo Alrob O, Alkilany AM, Benamara M, Evans DJ. Synthesis of gold nanoparticles using leaf extract of Ziziphus zizyphus and their antimicrobial activity. Nanomaterials. 2018;8(3):174. doi: 10.3390/nano8030174. [DOI] [PMC free article] [PubMed] [Google Scholar]
- 58.Van Hong N, Lee B-J. Protein corona: a new approach for nanomedicine design. Int J Nanomedicine. 2017;12:3137. doi: 10.2147/IJN.S129300. [DOI] [PMC free article] [PubMed] [Google Scholar]
- 59.García-Álvarez R, Hadjidemetriou M, Sánchez-Iglesias A, Liz-Marzán LM, Kostarelos K. In vivo formation of protein corona on gold nanoparticles. The effect of their size and shape. Nanoscale. 2018;10(3):1256–1264. doi: 10.1039/C7NR08322J. [DOI] [PubMed] [Google Scholar]
- 60.Erkan G, Şengül K, Kaya S. Dyeing of white and indigo dyed cotton fabrics with Mimosa tenuiflora extract. J Saudi Chem Soc. 2014;18(2):139–148. doi: 10.1016/j.jscs.2011.06.001. [DOI] [Google Scholar]
- 61.Ahmad Tausif, Bustam Mohamad Azmi, Irfan Muhammad, Moniruzzaman Muhammad, Asghar Hafiz Muhammad Anwaar, Bhattacharjee Sekhar. Mechanistic investigation of phytochemicals involved in green synthesis of gold nanoparticles using aqueous Elaeis guineensis leaves extract: Role of phenolic compounds and flavonoids. Biotechnology and Applied Biochemistry. 2019;66(4):698–708. doi: 10.1002/bab.1787. [DOI] [PubMed] [Google Scholar]
- 62.Gajendiran M, Jo H, Kim K, Balasubramanian S. Green synthesis of multifunctional Peg-carboxylate π back-bonded gold nanoconjugates for breast cancer treatment. Int J Nanomedicine. 2019;14:819. doi: 10.2147/IJN.S190946. [DOI] [PMC free article] [PubMed] [Google Scholar]
- 63.Ganaie SU, Abbasi T, Abbasi SA. Rapid and green synthesis of bimetallic Au–Ag nanoparticles using an otherwise worthless weed Antigonon leptopus. J Exp Nanosci. 2016;11(6):395–417. doi: 10.1080/17458080.2015.1070311. [DOI] [Google Scholar]
- 64.Wang Q, Zhao X, Lee YI, Liu HG. A new and facile way to fabricate catalytically active block copolymer/Au nanoparticle multilayer thin films at the air/liquid interface. RSC Adv. 2015;5(105):86564–86571. doi: 10.1039/C5RA16370F. [DOI] [Google Scholar]
- 65.Alegria E, Ribeiro A, Mendes M, Ferraria A, do Rego A, Pombeiro A. Effect of phenolic compounds on the synthesis of gold nanoparticles and its catalytic activity in the reduction of nitro compounds. Nanomaterials. 2018;8(5):320. doi: 10.3390/nano8050320. [DOI] [PMC free article] [PubMed] [Google Scholar]
- 66.Ahmad T, Bustam MA, Irfan M, Moniruzzaman M, Asghar HMA, Bhattacharjee S. Green synthesis of stabilized spherical shaped gold nanoparticles using novel aqueous Elaeis guineensis (oil palm) leaves extract. J Mol Struct. 2018;1159:167–173. doi: 10.1016/j.molstruc.2017.11.095. [DOI] [Google Scholar]
- 67.Li J, Tian B, Li T, Dai S, Weng Y, Lu J, Xu X, Jin Y, Pang R, Hua Y. Biosynthesis of Au, Ag and Au–Ag bimetallic nanoparticles using protein extracts of Deinococcus radiodurans and evaluation of their cytotoxicity. Int J Nanomedicine. 2018;13:1411. doi: 10.2147/IJN.S149079. [DOI] [PMC free article] [PubMed] [Google Scholar]
- 68.Shabestarian H, Homayouni-Tabrizi M, Soltani M, Namvar F, Azizi S, Mohamad R, Shabestarian H. Green synthesis of gold nanoparticles using Sumac aqueous extract and their antioxidant activity. Mat Res. 2017;20(1):264–270. doi: 10.1590/1980-5373-mr-2015-0694. [DOI] [Google Scholar]
- 69.Paul B, Bhuyan B, Purkayastha DD, Dhar SS. Photocatalytic and antibacterial activities of gold and silver nanoparticles synthesized using biomass of Parkia roxburghii leaf. J Photochem Photobiol B Biol. 2016;154:1–7. doi: 10.1016/j.jphotobiol.2015.11.004. [DOI] [PubMed] [Google Scholar]
- 70.Chandran P, Riviere JE, Monteiro-Riviere NA. Surface chemistry of gold nanoparticles determines the biocorona composition impacting cellular uptake, toxicity and gene expression profiles in human endothelial cells. Nanotoxicology. 2017;11(4):507–519. doi: 10.1080/17435390.2017.1314036. [DOI] [PubMed] [Google Scholar]
- 71.Zhaleh M, Zangeneh A, Goorani S, Seydi N, Zangeneh MM, Tahvilian R, Pirabbasi E. In vitro and in vivo evaluation of cytotoxicity, antioxidant, antibacterial, antifungal, and cutaneous wound healing properties of gold nanoparticles produced via a green chemistry synthesis using Gundelia tournefortii L. as a capping and reducing agent. Appl Organometallic Chem. 2019;33:e5015. doi: 10.1002/aoc.5015. [DOI] [Google Scholar]
- 72.He H, Xie C, Ren J. Nonbleaching fluorescence of gold nanoparticles and its applications in cancer cell imaging. Anal Chem. 2008;80(15):5951–5957. doi: 10.1021/ac8005796. [DOI] [PubMed] [Google Scholar]
- 73.Geddes CD, Parfenov A, Gryczynski I, Lakowicz JR. Luminescent blinking of gold nanoparticles. Chem Phys Lett. 2003;380(3–4):269–272. doi: 10.1016/j.cplett.2003.07.029. [DOI] [PMC free article] [PubMed] [Google Scholar]
- 74.Cantelli A, Battistelli G, Guidetti G, Manzi J, Di Giosia M, Montalti M. Luminescent gold nanoclusters as biocompatible probes for optical imaging and theranostics. Dyes and Pigm. 2016;135:64–79. doi: 10.1016/j.dyepig.2016.06.019. [DOI] [Google Scholar]
- 75.Wu Z, Jin R. On the ligand’s role in the fluorescence of gold nanoclusters. Nano Lett. 2010;10(7):2568–2573. doi: 10.1021/nl101225f. [DOI] [PubMed] [Google Scholar]
- 76.Zheng Y, Lai L, Liu W, Jiang H, Wang X. Recent advances in biomedical applications of fluorescent gold nanoclusters. Adv Coll Interf Sci. 2017;242:1–16. doi: 10.1016/j.cis.2017.02.005. [DOI] [PubMed] [Google Scholar]
- 77.Liu X, Wu F, Tian Y, Wu M, Zhou Q, Jiang S, Niu Z. Size dependent cellular uptake of rod-like bionanoparticles with different aspect ratios. Sci Rep. 2016;6:24567. doi: 10.1038/srep24567. [DOI] [PMC free article] [PubMed] [Google Scholar]
- 78.Zhao F, Zhao Y, Liu Y, Chang X, Chen C, Zhao Y. Cellular uptake, intracellular trafficking, and cytotoxicity of nanomaterials. Small. 2011;7(10):1322–1337. doi: 10.1002/smll.201100001. [DOI] [PubMed] [Google Scholar]
- 79.Xie X, Liao J, Shao X, Li Q, Lin Y. The effect of shape on cellular uptake of gold nanoparticles in the forms of stars, rods, and triangles. Sci Rep. 2017;7(1):1–9. doi: 10.1038/s41598-016-0028-x. [DOI] [PMC free article] [PubMed] [Google Scholar]
- 80.Rodríguez-León E, Larios-Rodríguez E, Rodríguez-Beas C, Plascencia-Villa G, Iñiguez-Palomares RA. Study of methylene blue degradation by gold nanoparticles synthesized within natural zeolites. J Nanomater. 2016;2016:1–10. [Google Scholar]
- 81.Zhou X, Xu W, Liu G, Panda D, Chen P. Size-dependent catalytic activity and dynamics of gold nanoparticles at the single-molecule level. JACS. 2009;132(1):138–146. doi: 10.1021/ja904307n. [DOI] [PubMed] [Google Scholar]
- 82.Suvith VS, Philip D. Catalytic degradation of methylene blue using biosynthesized gold and silver nanoparticles. Spectrochim Acta Part A Mol Biomol Spectrosc. 2014;118:526–532. doi: 10.1016/j.saa.2013.09.016. [DOI] [PubMed] [Google Scholar]
- 83.Ganapuram BR, Alle M, Dadigala R, Dasari A, Maragoni V, Guttena V. Catalytic reduction of methylene blue and Congo red dyes using green synthesized gold nanoparticles capped by salmalia malabarica gum. Int Nano Lett. 2015;5(4):215–222. doi: 10.1007/s40089-015-0158-3. [DOI] [Google Scholar]
Associated Data
This section collects any data citations, data availability statements, or supplementary materials included in this article.
Supplementary Materials
Additional file 1: Table S1. Formulations used in AuMt1 and AuMt2 synthesis. Figure S1. Time-dependent pH change of AuMtNPs synthesis. The inset shows mechanism for the reduction of gold ions into Au0 in presence of polyphenolics groups. Figure S2. DLS of AuMt1 and AuMt2 in water and sDMEM at 37 oC. Figure S3. Main reported compounds of Mimosa tenuiflora. Figure S4. Deconvolution signal of XPS O 1s of AuMt1 and AuMt2. Table S2. XPS Peak fitting gaussian parameters. Figure S5. Region of Interest (ROI) of AuMt1 in HUVEC for Uptake NPs in cells. Figure S6. ROI of AuMt2 in HUVEC for Uptake NPs in cells. Figure S7. Fluorescence Intensity for AuMt1 and AuMt2 in HUVEC cells obtained for confocal microscopy.
Data Availability Statement
All datasets are presented in the main paper.