

Abstract
There has recently been an increase in quantification and objective analysis of soccer performance due to improvements in technology using load indexes such as Player Load (PL) and Metabolic Power (MP). The objectives of this study were: (1) to describe the performance of PL and MP in competition according to the specific role, match‐to‐ match variation, periods of play, game location and match status according to game periods, and (2) to analyze the relationship between both indexes. Twenty‐one national‐level soccer players were distributed in the following specific positional roles: external defenders (ED) (n = 4), central defenders (CD) (n = 4), midfielders (M) (n = 5), external midfielders (EM) (n = 4) and attackers (A) (n = 4). A total of 12 matches played by a Spanish Third Division team during the 2016/2017 season were analyzed. WIMU PROTM inertial devices (RealTrack System, Almeria, Spain) were used for recording the data. The main results were: (1) a performance reduction in both variables over the course of match time, (2) significant differences in both variables based on the specific position, (3) differences in physical demands during the season matches, (4) winning during a game period and the condition of being the visitor team provoked higher demands, and (5) a high correlation between both variables in soccer. In conclusion, different contextual variables influence the external load demands; both indexes are related so they could be used for external load quantification, and it is necessary to analyze physical demands of the competition for a specific and individualized load design in training sessions.
Key words: physical demands, external load, inertial devices, team sports, performance, contextual variables
Introduction
Soccer is a team sport characterized by high‐intensity intermittent efforts during matches (McMillan et al., 2005), where repetitive sprinting efforts, rapid accelerations or decelerations, quick changes of direction, jumps, kicks and tackles are performed continuously with incomplete recovery (Arnason et al., 2004). These movements and skills are dynamic and unpredictable, with variable intensity and duration in competition (Bloomfield et al., 2007).
Due to the strong relationship with injury risk, the training load is one of the most important aspects for fitness coaches to consider (Eirale et al., 2013). Correct planning and monitoring of training demands is crucial to optimize performance of top‐level players (Gómez‐Díaz et al., 2013). The internal training load is the physical response to stress factors. Heart rate telemetry, oxygen consumption, rating of perceived exertion (RPE) or blood lactate are commonly used methods for assessing internal loads (Borresen and Lambert, 2009). The external training load is the objective measurement of the work performed by the players, and is classified in kinematical variables recorded with time‐motion analysis or global positioning systems (distance, acceleration, power output, Metabolic Power, etc.) and neuromuscular variables measured by accelerometry (Player Load, impacts, etc.) (Bourdon et al., 2016).
In soccer, the internal and external load could be affected by different situational variables. The accumulated fatigue during matches (differences between the first and the second half) produces a decreasing performance in total distance covered, high intensity activity or sprints (Di Salvo et al., 2009; Vigne et al., 2010). In addition, the specific roles produce differences in activity profiles and tactical requirements in relation to the game dynamics (Di Salvo et al., 2009; Rampinini et al., 2007). Rampinini et al. (2007) and Mohr et al. (2003) have analyzed the differences in physical requirements in relation to the period of the season, indicating that teams required greater effort (total distance, high intensity activity and sprints) at the end of the season with respect to the middle of the season. Moreover, congested fixtures also affected load demands and tactical behavior (Folgado et al., 2015). Other factors which also seem to be influential are: (a) the match status, with higher demands when the team is losing (Castellano et al., 2011; Sampaio et al., 2014); (b) the game location, where greater demands have been found at home (Castellano et al., 2011; Lago et al., 2009); or (c) the final score, an advantage in the score at the start of the game does not allow teams to perform at their maximal level during games (Miñano‐Espin et al., 2017).
To achieve performance enhancement, training loads are quantified and evaluated objectively, thanks to technological advances, which provide direct and immediate information (Jobson et al., 2009). GPS devices make it possible to quantify the kinematic demand in training and competition (Wisbey et al., 2010) in a constant and accurate way (Carling et al., 2008). These devices record the localization, covered distances and speed, through the latitude and longitude coordinates (Paul et al., 2010). The use of these devices has made it possible to understand the specific load demands in soccer (Carling et al., 2008). Furthermore, FIFA (International Federation of Association Football) has recently approved the use of electronic devices in official competitions (Laws of the Game 2015‐2016). More recently, the development of inertial devices has enabled internal and external training loads to be monitored with the same unit. These devices are composed of different sensors (accelerometer, gyroscope, magnetometer, GPS, etc.) and they have attained excellent validity and reliability (Barrett et al., 2016; Coutts and Duffield, 2010).
Nowadays, one of the most frequently used load indicators is Player Load (PL) (Barrett et al., 2016). This indicator shows the combination of the accelerations produced in the three main anatomical planes, leading to estimation of the total load (Cormack et al., 2013). PL has obtained strong correlations in validity analysis with variables like the heart rate and VO2max (Barrett et al., 2016), subjective ratings of perceived exertion (Casamichana et al., 2013), as well as high test‐ retest and inter and intra‐device reliability in continuous (Barrett et al., 2016) and intermittent efforts (Boyd et al., 2011). On the other hand, di Prampero et al. (2005) proposed another indicator called Metabolic Power (MP) to quantify physical activity. MP is calculated from the energy cost (EC) and the speed (s) of activities performed during a game (MP = EC · s) (Gaudino et al., 2014). Metabolic Power has been utilized in the estimation of the overall energy expenditure required (Osgnach et al., 2010). However, Buchheit et al. (2015) questioned the estimation of the energy expenditure of specific soccer actions through MP, partly because real demands are underestimated to a great extent, especially when changes in velocity are almost non‐existent or when started from a static position (jumps, changes of direction, charges, tackles, etc.).
In view of the above, it has been hypothesized that contextual variables could affect external load demands during official matches, and metabolic power that has been criticized in sport sciences as an energy expenditure index, could be useful to quantify external loads through the recording of travel speed. Therefore, the objectives of this study were: (1) to describe the performance of PL and MP during soccer competition and their relationship with the situational variables in soccer such as playing period, specific position, game fixture, match status and game location, and (2) to analyze the relationship between both indexes for external load quantification.
Methods
Participants
Twenty‐one national‐level soccer players participated in this research. The players included in the study met two basic criteria: (1) completion of the total match (at least three matches within the whole sample), and (2) the goalkeepers were not included in the study because their physical load differs from all field players. Participants were distributed in the following specific positional roles: external defenders (ED) (n = 4), central defenders (CD) (n = 4), midfielders (M) (n = 5), external midfielders (EM) (n = 4) and attackers (A) (n = 4) (Di Salvo et al., 2010). Twelve matches were recorded during the 2016/2017 season. The team analyzed participated in the Third Division, which is regulated by the Royal Spanish Football Federation (RFEF). The matches studied resulted in 4 wins, 5 draws, and 3 losses. The study followed the Ethics Code of the World Medical Association and the Recommendations Guiding Doctors in Clinical Research of the Declaration of Helsinki. Participants were informed about the research procedures and provided written informed consent. To ensure the team’s and playersʹ confidentiality, all performance data were anonymized before analysis.
Measures and variables
Player Load (PL): Accelerometer‐derived measurements of total body load in its 3 axes (vertical, anterior‐posterior and medial‐lateral) have been used to evaluate the neuromuscular load in different athletes (Gómez‐Carmona et al., 2019; Serrano García de Dionisio et al., 2019). It is represented in arbitrary units (a.u.) and is calculated from the following equation:
Metabolic Power (MP): is the product of speed (S) and energy cost of the activity (EC) derived from inclination and acceleration (Osgnach et al., 2010), calculated using the following equation:
Situational variables: other variables have been included in this research to identify their influence on PL and MP; (i) playing time was divided into six periods of 15 min each (Barrett et al., 2016; Carling and Dupont, 2010; Torreño et al., 2016), distributed as follows: (FH1) First Half 1, 0‐ 15 min; (FH2) First Half 2, 15‐30 min; (FH3) First Half 3, 30‐45 min; (SH1) Second Half 1, 45‐60 min; (SH2) Second Half 2, 60‐75 min; (SH3) Second Half 3, 75‐90 min; (ii) game location, whether playing at home or away; (iii) game‐to‐game variability, the change in performance in different games; (iv) match status, current result of the match: winning, losing or drawing; and (v) playing position, the specific position of each player on the field.
Design and Procedures
An inertial device (wireless inertial movement unit) called WIMU PROTM (RealTrack Systems, Almeria, Spain) was used to register the external load data of the players in official games. This device consists of different sensors (accelerometers, gyroscope, GPS and magnetometer, among others). Sampling frequency for the data collected from accelerometer, gyroscope and magnetometer sensors was 100 Hz, while the GPS data were measured at 10 Hz. The inertial devices were placed in a specially designed harness worn by each of the players. The GPS and the UWB technology of the WIMU PROTM inertial device have been analyzed previously (Bastida‐Castillo et al., 2018).
Fifteen minutes before the training sessions the players were fitted with the devices, and on match days they put them on before warming up. Prior to placement, the inertial devices were calibrated and synchronized. The calibration and starting process of the devices was performed manually according to the manufacturer’s recommendations: (i) to switch on the devices in a flat zone without contact with magnetic devices, (ii) not to move the devices for approximately 30 s after switching them on, (iii) once the operating system of the device was initialized, to press a button in order to start recording, (iv) the devices were then placed on every player. All data obtained from the devices were synchronized and extracted for their subsequent analysis with S PROTM software (RealTrack Systems, Almeria, Spain).
Statistical analysis
The descriptive statistics were calculated and reported as mean (M) ± standard deviations of the mean (SD) for each variable. Then, an exploratory analysis of the data was performed in order to check their distribution. A one‐way ANOVA was used to detect differences between player positions, match‐to‐match variation, 15‐ min game period and match status for the two load variables analyzed. The Bonferroni post‐hoc test was used to identify the source of any significant differences. The Student’s t‐test was used to identify differences between each half and game location. To identify the magnitude of differences, Cohen’s d effect size (d) was calculated and interpreted using the following values (Hopkins et al., 2009): very low (< 0.2), low (0.2 ‐ 0.6), moderate (0.6 ‐ 1.2), high (1.2 ‐ 2.0) and very high (> 2.0). Relationships between the external load variables were assessed using Pearson’s product‐moment correlation (r). The magnitude of the correlation coefficients was deemed as trivial (r2 < 0.1), small (0.1 < r2 < 0.3), moderate (0.3 < r2 < 0.5), high (0.5 < r2 < 0.7), very high (0.7 < r2 < 0.9), nearly perfect (r2 > 0.9) and perfect (r2 = 1) (Hopkins et al., 2009). Analyses and figures were completed and designed using IBM SPSS Statistics (release 24.0; SPSS Inc., Chicago IL, USA) and figures were created using GraphPad Prism (release 7; GraphPad Software, La Jolla CA, USA). Significance was established at p < 0.05.
Results
The external load indicators across playing positions, periods of match and match‐to‐ match variability are summarized in Figure 1. A decline in performance throughout the match can be seen in both variables PL (FH = 64.74 ± 11.88; SH = 54.30 ± 16.38; p < .001; d = ‐1.31) and MP (FH = 22050.39 ± 2654.52; SH = 17727.35 ± 4559.43; p < .001; d = ‐1.16). Besides, in the 15‐min period in each half comparison, significant differences with moderate effect sizes were found between the first and the third period in each half, both in PL (FH1 = 22.20 ± 4.52; FH3 = 20.12 ± 3.77; p < .001; d = ‐0.56; SH1 = 19.85 ± 4.43; SH3 = 17.41 ± 3.26; p < .001; d = ‐ 0.75) and MP (FH1 = 6646.05 ± 1005.23; FH3 = 6256.51 ± 823.34; p < .001; d = ‐0.47; SH1 = 6188.42 ± 954.32; SH3 = 5359.15 ± 838.76; p < .001; d = ‐0.98).
Figure 1.
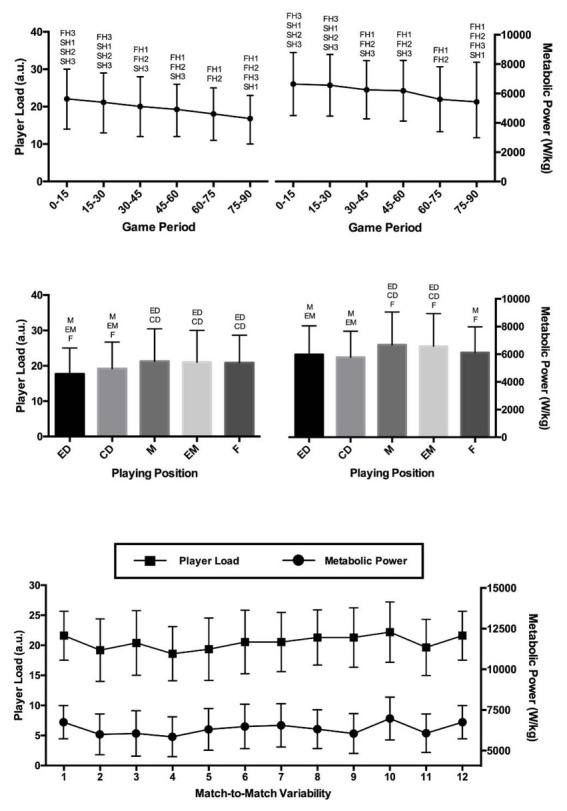
Player Load and Metabolic Power dynamics according to the 15‐min game period, playing position and match‐to‐match variability. FH1Significant differences with first half 1 (p < .05), FH2Significant differences with first half 2 (p < .05), FH3Significant differences with first half 3 (p < .05), SH1Significant differences with second half 1 (p < .05), SH2Significant differences with second half 2 (p < .05), SH3Significant differences with second half 3 (p < .05),EDSignificant differences with the external defenders (p < .05), CDSignificant differences with the central defenders (p < .05), MSignificant differences with the midfielders (p < .05), EMSignificant differences with the external midfielders (p < .05), FSignificant differences with the forwards (p < .05).
According to playing positions, different requirements in both variables were found (PL: p < .001; d = 1.67; MP: p < .001; d = 1.43). Midfielders and forwards recorded higher demands than defenders (center and external). Finally, in relation to match‐to‐match variability, the distribution of effort was irregular with a moderate effect size (PL: p < .001; d = 0.88; MP: p < .001; d = 0.97), showing lower values at the beginning and higher at the end of the season.
The comparison of external load demands in official matches as a function of the match status in each period and the game location is shown in Table 1. In comparison of match status, statistical differences were found in both variables (PL: p < .001; d = 1.71; MP: p < .001; d = 1.52), with the load being higher when the team was momentarily winning the match. Besides, differences were found in relation to game location (PL: p < .001; d = 0.98; MP: p < .001; d = 0.50). Higher demands were found in matches when the team played as the visitor.
Table 1.
External load variables analysis in relation to match status and game location
| PL (a.u.) | MP (W/Kg) | ||||||||
|---|---|---|---|---|---|---|---|---|---|
| Variable | p | d | p | d | |||||
| M | SD | M | SD | ||||||
| Match status | Winninga | 22.41c | 3.50 | 7569.09c | 988.36 | ||||
| Drawingb | 20.52c | 3.79 | <.001 | 1.71 | 7145.58c | 916.27 | <.001 | 1.52 | |
| Losingc | 17.81a,b | 4.08 | 6486.59a,b | 1142.75 | |||||
| Total | 20.25 | 4.03 | 7074.41 | 1064.29 | |||||
| Game location | Home | 18.75 | 3.65 | 6987.78 | 934.12 | ||||
| <.001 | .98 | <.001 | .50 | ||||||
| Away | 22.45 | 3.89 | 7462.40 | 975.23 | |||||
| Total | 20.68 | 3.62 | 7227.32 | 964.75 | |||||
Note. PL: Player Load; MP: Metabolic Power; M: Mean; SD: Standard deviation; p: p value; d: Cohen’s d effect size. aSignificant differences with winning (p < .05); bSignificant differences with drawing (p < .05); cSignificant differences with losing (p < .05).
Finally, Figure 2 presents a correlation plot between PlayerLoadTM and Metabolic Power showing a high correlation between both variables (r = 0.918; p < .001).
Figure 2.
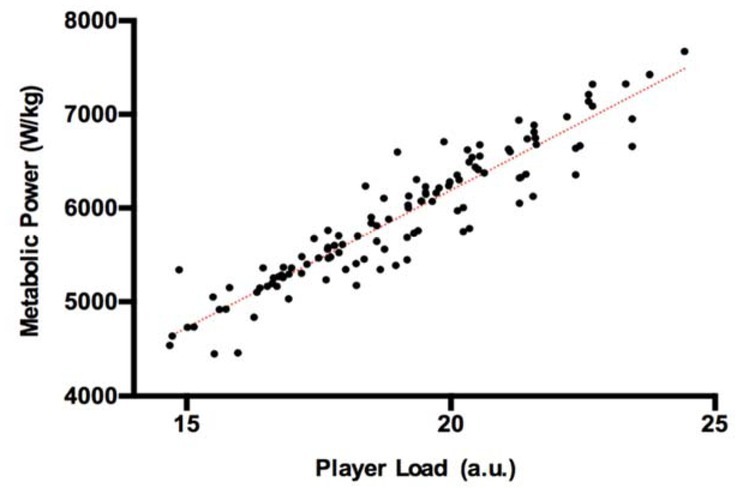
Relationship between Player Load (determined by accelerometry) and Metabolic Power (determined by GNSS) dynamics for the recordings in 12 matches (r = 0.918; p < 0.01). “a.u.” is arbitrary unit.
Discussion
The objectives of the study were to describe the relationship of PL and MP as external load variables during soccer competition and the influence of different situational variables in soccer such as periods of the match, game location, game‐to‐game variability, match status and playing position. This research is the first to analyze the relationship between PL and MP in official matches. The main results obtained in this investigation highlight that there are significant differences with moderate to high effect sizes (p < .001; d = 0.50 ‐ 1.71) in relation to the contextual variables analyzed. Besides, a very strong correlation was found between both external load indexes (r = 0.918; p < .001).
Analyses among halves of the game showed significant differences, with moderate to high effect sizes. Higher demands were found in the first half than in the second half of the game in PL (p < .001; d = 1.31) and MP (p < .001; d = 1.16). Mohr et al. (2003) stated that physical exhaustion a soccer player experiences towards the end of the match, as well as in certain moments throughout the game, may be caused by the drop in body temperature during half‐time. In addition, PL is connected with the total distance covered (Gabbett and Mulvey, 2008) and the distance covered per minute (Casamichana et al., 2013). It has been demonstrated that the total distance covered decreases in the second half in comparison to the first (Di Salvo et al., 2010). Moreover, a comparison between periods of time shows higher demands in the FH1 (0‐15 min) and in the SH1 (45‐60 min) than the third period of 15‐ min in both halves (FH3 and SH3) in the two external load indexes, PL and MP. Different investigations divided playing time in periods of 15 minutes, noticing a reduction in performance in the last two periods compared to the first two (Barrett et al., 2016; Carling et al., 2008; Carling and Dupont, 2010; Torreño et al., 2016). The results obtained in the present research point to the necessity of designing training to avoid the decrease in performance during official matches. Besides, a decreasing trend of dynamics is evident in both variables (PL and MP), PL being related to human‐body acceleration in the three planes, and MP related to travel speed and distance covered during a match. Both variables could be useful for detecting fatigue in soccer players´ performances during official matches and training sessions.
With regard to the playing position, differences were found between the attacking players in comparison with defenders with moderate to high effect sizes (PL: p < .001; d = 1.67; MP: p < .001; d = 1.43). In addition, PL and MP revealed similar dynamics in different positions, with midfielders bearing the highest (PL = 21.3 ± 3.45; MP = 6682.95 ± 786.23) and the external defenders the lowest demands (PL = 17.7 ± 3.76; MP = 5979.6 ± 567.79). Di Salvo et al. (2009) showed differences (p < .05) between specific field positions in total high intensity running (THIR) and total sprint distance (TSD), finding the lowest demands in central defenders and the highest in wide midfielders. Dellal et al. (2011) also found higher demands in total distance (TD), THIR and TSD between midfielders‐forwards and defenders in the English and Spanish First Divisions. Besides, differences in THIR and TSD between leagues were found. In the present research, it was found that EM and A had the same MP, but different PL, indicating higher PL in attackers. This may be due to the fact that despite covering the same distance, attackers experience more physical contact, such as tackling, pushing and jumping. The obtained results are different to those of Dalen et al. (2016) who found higher requirements in PL and TD in EM than A, which could be explained by the level of competition and players analyzed. The main results in the playing position comparison showed that each position was determined by an individualized physical profile of the player.
In relation to match status and game location, statistical differences were found in the two indexes, match status showing a high effect size (PL: p < .001; d = 1.71; MP: p < .001; d = 1.52) and game location a low‐to‐moderate effect size (PL: p < .001; d = 0.98; MP: p < .001; d = 0.50). The external load was higher when the team was winning the match and playing away. The results obtained are different from those of other studies (Castellano et al., 2011; Sampaio et al., 2014). Castellano et al. (2011) found differences in match status (F = 19.9; p < .001) and no differences in game location (F = 3.4; p = .066), showing higher demands when the team was losing compared to drawing or winning. Sampaio et al. (2014) analyzed 5‐a‐side soccer small‐sided games and obtained greater demands when the team was losing in a situation of numerical superiority with the aim of equaling the score and winning in a situation of numerical inferiority with the aim of maintaining their advantage. These differences were found in distance covered at different speeds (0‐6.9 km/h; 7‐9.9 km/h; 10‐12.9 km/h; 13‐ 15.9 km/h; 16‐17.9 km/h; >17.9 km/h) and TD.
Accordingly, match status could influence external load demands in official matches and small‐sided games during training sessions, but the effect of the game location is not clear, although in this research it was found to have an influence. The best elite‐level teams are able to maintain their style of play and external load demands without variation in relation to the level of the opponent, game location and match status (García‐Rubio et al., 2014; Miñano‐Espín et al., 2017). Conversely, the analyzed team, with a lower technical and tactical level (third quartile of the classification in the Spanish Third Division) showed irregular behavior (influenced by the opposite team), and a different strategy than elite‐ level teams due to increased external load demands when it was winning in order not to lose its advantage. Therefore, the specific effect of these variables on each team should be analyzed and taken into account to achieve a competitive advantage.
Concerning the analysis based on game‐ to‐game variability, there are significant differences between games in both variables with a moderate effect size (PL: p < .001; d = 0.88; MP: p < .001; d = 0.97), and the performance of PL and MP was irregular throughout the analyzed fixture (1st‐12th match). These results could be influenced by different contextual variables: (a) match status and game location analyzed in the present research and in other investigations (Castellano et al., 2011; Sampaio et al., 2014); (b) the style of play embraced by the coach to face the game or the technical and tactical level of the players chosen (Bradley et al., 2013); (c) the level of the opponent (Lago‐Peñas and Lago‐ Ballesteros, 2011), and (d) the playing field: size of the pitch that may affect the soccer players’ physical, physiological, perceptive and motor demands (Casamichana et al., 2013; Kelly and Drust, 2009), or the pitch surface that may affect perceived exertion and performance in the countermovement jump or repeated sprint ability (Brito et al., 2012; Sánchez‐Sánchez et al., 2014). Besides, in the match‐to‐match variability analysis the fixture characteristics (congested or not congested) are important for load quantification. Folgado et al. (2015) analyzed the effect of one or two matches per week and found a negative effect on external loads and tactical team synchronization in the team with a congested fixture. Conversely, Dupont et al. (2010) did not find a performance decrease in external load variables, yet found an increase in injury risk. All of the above‐mentioned different variables could produce the match‐to‐match variability in external loads, with different variables (fixture characteristics and game location) having unclear effects on performance.
Finally, when PL and MP correlation analysis was performed, both variables were significantly related (r > 0.9). Different researchers have analyzed the reliability and validity of the PL index in laboratory and field conditions, finding excellent results (Barrett et al., 2016; Boyd et al., 2011; Casamichana et al., 2013). On the other hand, MP has been criticized in research due to the underestimation of energy expenditure (Buchheit et al., 2015). However, if both variables present similar dynamics, this indicates that both could be used for external load quantification in soccer.
Limitations
Some limitations of the present study should be considered when interpreting the findings. Firstly, the number of participants was small (n = 18), which could influence the statistical power of the results. Secondly, participants were national‐level male soccer players and played in a team with a specific playing system. It is unclear whether these findings can be extrapolated to other teams/players. Finally, only external load variables were analyzed in relation to different contextual variables. Future researchers could investigate the dynamics of external and internal load variables and tactical behavior to obtain a global vision of load demands in relation to the different contextual variables analyzed.
Conclusions and Practical Applications
In conclusion, soccer players experience a decrease in performance during matches. Contextual variables such as fixture, game location, match status and specific roles modified the external load placed on the players. Therefore, it is necessary to design training sessions and prepare official matches taking the following aspects into account: (a) an individualized profile of each specific role, (b) training loads to achieve a smaller performance decrease during matches and throughout the season, and (c) physical, technical, tactical and psychological training in relation to game location, match status, playing system and the level of the opponent. Besides, a strong relationship was found between PL and MP. The similar dynamics in PL and MP offer the possibility to use them for external load quantification, with PL obtained through the body movements detected by accelerometry on the three axes; and MP, through the travel speed and distance covered recorded by tracking systems.
References
- Arnason A, Sigurdsson SB, Gudmundsson A, Holme I, Engebretsen L, Bahr R. Physical fitness, injuries, and team performance in soccer. Med Sci Sport Exer. 2004;36:278–285. doi: 10.1249/01.MSS.0000113478.92945.CA. [DOI] [PubMed] [Google Scholar]
- Bastida-Castillo A, Gomez-Carmona CD, De la Cruz Sanchez E, Pino-Ortega J. Accuracy, intra-and inter-unit reliability, and comparison between GPS and UWB-based position-tracking systems used for time–motion analyses in soccer. Eur J Sport Sci. 2018;18:450–457. doi: 10.1080/17461391.2018.1427796. [DOI] [PubMed] [Google Scholar]
- Barrett S, Midgley AW, Towlson C, Garrett A, Portas M, Lovell R. Within-match playerload™ patterns during a simulated soccer match: Potential implications for unit positioning and fatigue management. Int J Sport Physiol. 2016;11:135–140. doi: 10.1123/ijspp.2014-0582. [DOI] [PubMed] [Google Scholar]
- Bloomfield J, Polman R, O’Donoghue P. Physical demands of different positions in FA Premier League soccer. J Sports Sci Med. 2007;6:63–70. [PMC free article] [PubMed] [Google Scholar]
- Borresen J, Lambert MI. The quantification of training load, the training response and the effect on performance. Sports Med. 2009;39:779–795. doi: 10.2165/11317780-000000000-00000. [DOI] [PubMed] [Google Scholar]
- Bourdon PC, Cardinale M, Murray A, Gastin P, Kellmann M, Varley MC, Gabbett TJ, Coutts AJ, Burgess DJ, Gregson W, Cable NT. Monitoring Athlete Training Loads: Consensus Statement. Int J Sport Physiol. 2017;12:161–170. doi: 10.1123/IJSPP.2017-0208. [DOI] [PubMed] [Google Scholar]
- Boyd LJ, Ball K, Aughey RJ. The reliability of MinimaxX accelerometers for measuring physical activity in Australian football. Int J Sport Physiol. 2011;6:311–321. doi: 10.1123/ijspp.6.3.311. [DOI] [PubMed] [Google Scholar]
- Bradley PS, Carling C, Gomez Diaz A, Hood P, Barnes C, Ade J, Mohr M. Match performance and physical capacity of players in the top three competitive standards of English professional soccer. Hum Movement Sci. 2013;32:808–821. doi: 10.1016/j.humov.2013.06.002. [DOI] [PubMed] [Google Scholar]
- Brito J, Krustrup P, Rebelo A. The influence of the playing surface on the exercise intensity of small-sided recreational soccer games. Hum Movement Sci. 2012;31:946–956. doi: 10.1016/j.humov.2011.08.011. [DOI] [PubMed] [Google Scholar]
- Buchheit M, Manouvrier C, Cassirame J, Morin JB. Monitoring locomotor load in soccer: is metabolic power, powerful? Int J Sports Med. 2015;36:1149–1155. doi: 10.1055/s-0035-1555927. [DOI] [PubMed] [Google Scholar]
- Casamichana D, Castellano J, Calleja-Gonzalez J, San Roman J, Castagna C. Relationship between indicators of training load in soccer players. J Strength Cond Res. 2013;27:369–374. doi: 10.1519/JSC.0b013e3182548af1. [DOI] [PubMed] [Google Scholar]
- Castellano J, Blanco-Villaseñor A, Alvarez D. Contextual variables and time-motion analysis in soccer. Int J Sports Med. 2011;32:415–21. doi: 10.1055/s-0031-1271771. [DOI] [PubMed] [Google Scholar]
- Carling C, Dupont G. Are declines in physical performance associated with a reduction in skill-related performance during professional soccer match-play? J Sport Sci. 2011;29:63–71. doi: 10.1080/02640414.2010.521945. [DOI] [PubMed] [Google Scholar]
- Carling C, Bloomfield J, Nelsen L, Reilly T. The role of motion analysis in elite soccer. Sports Med. 2008;38:839–862. doi: 10.2165/00007256-200838100-00004. [DOI] [PubMed] [Google Scholar]
- Coutts AJ, Duffield R. Validity and reliability of GPS devices for measuring movement demands of team sports. J Sci Med Sport. 2010;13:133–135. doi: 10.1016/j.jsams.2008.09.015. [DOI] [PubMed] [Google Scholar]
- Dalen T, Jørgen I, Gertjan E, Havard HG, Ulrik W. Player load, acceleration, and deceleration during forty- five competitive matches of elite soccer. J Strength Cond Res. 2016;30:351–359. doi: 10.1519/JSC.0000000000001063. [DOI] [PubMed] [Google Scholar]
- Dellal A, Chamari K, Wong DP, Ahmaidi S, Keller D, Barros R, Bisciotti GN, Carling C. Comparison of physical and technical performance in European soccer match-play: FA Premier League and La Liga. Eur J Sport Sci. 2011;11:51–59. [Google Scholar]
- Di Prampero PE, Fusi S, Sepulcri L, Morin JB, Belli A, Antonutto G. Sprint running: a new energetic approach. J Exp Biol. 2005;208:2809–2816. doi: 10.1242/jeb.01700. [DOI] [PubMed] [Google Scholar]
- Di Salvo V, Baron R, Gonzalez-Haro C, Gormasz C, Pigozzi F, Bachl N. Sprinting analysis of elite soccer players during European Champions League and UEFA Cup matches. J Sport Sci. 2010;28:1489–1494. doi: 10.1080/02640414.2010.521166. [DOI] [PubMed] [Google Scholar]
- Di Salvo V, Gregson W, Atkinson G, Tordoff P, Drust B. Analysis of high intensity activity in Premier League soccer. J Sports Med. 2009;30:205–212. doi: 10.1055/s-0028-1105950. [DOI] [PubMed] [Google Scholar]
- Drust B, Green M. Science and football: evaluating the influence of science on performance. J Sport Sci. 2013;31:1377–1382. doi: 10.1080/02640414.2013.828544. [DOI] [PubMed] [Google Scholar]
- Dupont G, Nedelec M, McCall A, McCormack D, Berthoin S, Wisløff U. Effect of 2 soccer matches in a week on physical performance and injury rate. Am J Sport Med. 2010;38:1752–1758. doi: 10.1177/0363546510361236. [DOI] [PubMed] [Google Scholar]
- Eirale C, Tol JL, Farooq A, Smiley F, Chalabi H. Low injury rate strongly correlates with team success in Qatari professional football. Brit J Sport Med. 2013;47:807–808. doi: 10.1136/bjsports-2012-091040. [DOI] [PMC free article] [PubMed] [Google Scholar]
- Federation Internationale de Football Association, 2015-2016. http://es.fifa.com/mm/Document/FootballDevelopment/Refereeing/02/36/01/11/LawsofthegamewebES_Spanish.pdf. http://es.fifa.com/mm/Document/FootballDevelopment/Refereeing/02/36/01/11/LawsofthegamewebES_Spanish.pdf Available at. accessed on 05.06.2017.
- Folgado H, Duarte R, Marques P, Sampaio J. The effects of congested fixtures period on tactical and physical performance in elite football. J Sport Sci. 2015;33:1238–1247. doi: 10.1080/02640414.2015.1022576. [DOI] [PubMed] [Google Scholar]
- Gabbett TJ, Mulvey M. Time-Motion analysis of small sided training games and competition in elite women soccer players. J Strength Cond Res. 2008;22:543–552. doi: 10.1519/JSC.0b013e3181635597. [DOI] [PubMed] [Google Scholar]
- Garcia-Rubio J, Gomez MA, Cañadas M, Ibáñez SJ. Offensive Rating-Time coordination dynamics in basketball. Complex systems theory applied to Basketball. Int J Perf Anal Spor. 2015;15:513–526. [Google Scholar]
- Gaudino P, Iaia FM, Alberti G, Hawkins RD, Strudwick AJ, Gregson W. Systematic bias between running speed and metabolic power data in elite soccer players: influence of drill type. Int J Sports Med. 2014;35:489–493. doi: 10.1055/s-0033-1355418. [DOI] [PubMed] [Google Scholar]
- Gomez-Carmona CD, Bastida-Castillo A, Gonzalez-Custodio A, Olcina G, Pino-Ortega J. Using an Inertial Device (WIMU PRO) to Quantify Neuromuscular Load in Running: Reliability, Convergent Validity, and Influence of Type of Surface and Device Location. J Strength Cond Res. 2019. Epub: ahead of print. [DOI] [PubMed]
- Gomez-Diaz AJ, Bradley PS, Diaz A, Pallares JG. Rate of perceived exertion in professional soccer: importance of the physical and psychological factors for training and competition. An Psicol. 2013;29:656–661. [Google Scholar]
- Hopkins WG, Marshall SW, Batterham AM, Hanin J. Progressive Statistics for Studies in Sports Medicine and Exercise Science. Med Sci Sports Exerc. 2009;41:3–13. doi: 10.1249/MSS.0b013e31818cb278. [DOI] [PubMed] [Google Scholar]
- Jobson SA, Passfield L, Atkinson G, Barton G, Scarf P. The analysis and utilization of cycling training data. Sports Med. 2009;39:833–844. doi: 10.2165/11317840-000000000-00000. [DOI] [PubMed] [Google Scholar]
- Kelly DM, Drust B. The effect of pitch dimensions on heart rate responses and technical demands of small- sided soccer games in elite players. J Sci Med Sport. 2009;12:475–479. doi: 10.1016/j.jsams.2008.01.010. [DOI] [PubMed] [Google Scholar]
- Lago C, Casais L, Dominguez E, Lago J, Rey E. Influence of contextual variables on physical performance in high level football. Eur J Hum Movement. 2009;23:107–121. [Google Scholar]
- Lago-Peñas C, Lago-Ballesteros J. Game location and team quality effects on performance profiles in professional soccer. J Sports Sci Med. 2011;10:465–471. [PMC free article] [PubMed] [Google Scholar]
- Malone JJ, Di Michele R, Morgans R, Burgess D, Morton JP, Drust B. Seasonal training-load quantification in elite English premier league soccer players. Int J Sport Physiol. 2015;10:489–497. doi: 10.1123/ijspp.2014-0352. [DOI] [PubMed] [Google Scholar]
- McMillan K, Helgerud J, Macdonald R, Hoff J. Physiological adaptations to soccer specific endurance training in professional youth soccer players. Brit J Sport Med. 2005;39:273–277. doi: 10.1136/bjsm.2004.012526. [DOI] [PMC free article] [PubMed] [Google Scholar]
- Miñano-Espin J, Casáis L, Lago-Peñas C, Gómez-Ruano MÁ. High Speed Running and Sprinting Profiles of Elite Soccer Players. J Hum Kinet. 2017;58:169–176. doi: 10.1515/hukin-2017-0086. [DOI] [PMC free article] [PubMed] [Google Scholar]
- Mohr M, Krustrup P, Bangsbo J. Match performance of high-standard soccer players with special reference to development of fatigue. J Sport Sci. 2003;21:519–528. doi: 10.1080/0264041031000071182. [DOI] [PubMed] [Google Scholar]
- Osgnach C, Poser S, Bernardini R, Rinaldo R, Di Prampero PE. Energy cost and metabolic power in elite soccer: a new match analysis approach. Med Sci Sports Exerc. 2010;42:170–178. doi: 10.1249/MSS.0b013e3181ae5cfd. [DOI] [PubMed] [Google Scholar]
- Paul GM, David BP, Clare LM. The physical and physiological demands of basketball training and competition. Int J Sport Physiol. 2010;5:75–86. doi: 10.1123/ijspp.5.1.75. [DOI] [PubMed] [Google Scholar]
- Rampini E, Coutts A, Castagna C, Sassi R, Impellizzeri FM. Variation in top level soccer match performance. Int J Sports Med. 2007;28:1018–1024. doi: 10.1055/s-2007-965158. [DOI] [PubMed] [Google Scholar]
- Reilly T, Thomas VA. A motion analysis of work-rate in different positional roles in professional football match-play. J Hum Movement Stud. 1976;2:87–97. [Google Scholar]
- Sampaio JE, Lago C, Gonçalves B, Maçãs VM, Leite N. Effects of pacing, status and unbalance in time motion variables, heart rate and tactical behaviour when playing 5-a-side football small-sided games. J Sci Med Sport. 2014;17:229–33. doi: 10.1016/j.jsams.2013.04.005. [DOI] [PubMed] [Google Scholar]
- Sanchez-Sanchez J, Garcia-Unanue J, Jiménez-Reyes P, Gallardo A, Burillo P, Felipe JL, Gallardo L. Influence of the mechanical properties of third-generation artificial turf systems on soccer players’ physiological and physical performance and their perceptions. Plos One. 2014;9:e111368. doi: 10.1371/journal.pone.0111368. [DOI] [PMC free article] [PubMed] [Google Scholar]
- Serrano García de Dionisio F, Gómez-Carmona CD, Bastida-Castillo A, Rojas-Valverde D, Pino-Ortega J. Slope influence on the trail runner’s physical load: a case study. Rev Int Med Cienc Ac. 2019. Epub: ahead of print.
- Torreño N, Munguia D, Coutts A, Villarreal ES, Asian J, Suarez L. Relationship between external and internal loads of professional soccer players during full matches in official games using global positioning systems and heart-rate technology. Int J Sport Physiol. 2016;11:940–946. doi: 10.1123/ijspp.2015-0252. [DOI] [PubMed] [Google Scholar]
- Vigne G, Gaudino C, Rogowski I, Alloatti G, Hautier C. Activity profile in elite Italian soccer team. Int J Sports Med. 2010;31:304–310. doi: 10.1055/s-0030-1248320. [DOI] [PubMed] [Google Scholar]
- Wisbey B, Montgomery PG, Pyne DB, Rattray B. Quantifying movement demands of AFL football using GPS tracking. J Sci Med Sport. 2010;13:531–536. doi: 10.1016/j.jsams.2009.09.002. [DOI] [PubMed] [Google Scholar]