Abstract
ALPK1 is associated with chronic kidney disease, gout and type 2 diabetes mellitus. Raised renal ALPK1 level in patients with diabetes was reported. Accelerated fibrotic nephropathies were observed in hyperglycaemic mice with up‐regulated ALPK1. The aim of this study was to identify the mediators contributing to ALPK1 effect involving in nephropathies induction. The haematoxylin and eosin staining, Masson's trichrome and immunohistochemical analysis of ALPK1, NFkB, CCL2 and CCL5 were performed in the mice kidney. Cytokine antibody array analysis was performed in streptozotocin‐treated wild‐type mice (WT‐STZ) and streptozotocin‐treated ALPK1 transgenic mice (TG‐STZ). The ALPK1 levels were measured in mice kidney and in cultured cells. We found that the higher levels of renal CCL2/MCP‐1, CCL5/Rantes and G‐CSF expression in TG‐STZ compared with the WT‐STZ. Glucose increased ALPK1 expressions in monocytic THP1 and human kidney‐2 cells. The protein expression of ALPK1, NFkB and lectin was up‐regulated in glucose‐treated HK‐2 cells. Knockdown of ALPK1 reduced CCL2 and CCL5 mRNA levels, whereas overexpressed ALPK1 increased CCL2 and CCL5 in cultured kidney cells. Taken together, these results show that high glucose increases ALPK1 and chemokine levels in the kidney. Elevated ALPK1 expression enhances renal CCL2 and CCL5 expressions in vivo and in vitro. ALPK1 is a mediator for CCL2 and CCL5 chemokine up‐regulation involving in diabetic nephropathies induction.
Keywords: ALPK1, CCL2, CCL5, chemokine, diabetic nephropathy
1. INTRODUCTION
Alpha‐kinase 1 (ALPK1), a member of the alpha‐kinase family, has been reported to be highly associated with cancer and chronic diseases such as chronic kidney disease (CKD), type 2 diabetes mellitus (type 2 DM) and gout.1, 2, 3 ALPK1 mutant has been reported to cause severe defects in motor co‐ordination in mice.4 Mice with overexpression of ALPK1 exhibited lower levels of testosterone and urate/anion exchanger URAT1.5, 6 ALPK1 is also known to be involved in the phosphorylation of myosin IA and myosin IIA, which might participate in apical protein transport and TNF‐α secretion.7, 8 ALPK1 enhances the expression of proinflammatory cytokines including IL‐1β, IL‐8 and TGF‐β1 in cultured human THP1 and human embryonic kidney 293 (HEK293) cells.9, 10 ALPK1 controls the formation of the TIFA complex, which acts in a sequential manner to activate the transcription factor nuclear factor‐kappaB (NFkB) and regulate the production of IL‐8 in response to infections with Shigella flexneri, Salmonella typhimurium, Neisseria meningitides and Helicobacter pylori.11, 12 These observations suggest a master regulatory role of ALPK1 in inflammation and innate immunity.
Kidney damage is one of the more common long‐term complications of chronic diseases such as diabetes and gout. Recently, accumulated evidence has suggested diabetic nephropathy (DN) as an inflammatory disease.13 DN, which is a common leading cause of end‐stage kidney failure worldwide, is characterized clinically by proteinuria and pathologically by excessive deposition of extracellular matrix (ECM) proteins and glomerulosclerosis and tubulointerstitial fibrosis.14 NFkB that is activated under hyperglycaemic conditions plays a prominent role in the pathogenesis of DN, regulating the production of proinflammatory cytokines, chemokines and intercellular adhesion molecule 1 (ICAM1).15 The proinflammatory cytokines and chemokines are known to play a critical role in inflammation, enhancing the ECM synthesis, and renal fibrosis in renal injury.16, 17, 18 Patients with diabetic glomerulosclerosis have been reported to exhibit enhanced ALPK1 expression in the renal tubular epithelial cells.2 In addition, streptozotocin (STZ)‐treated mice with ALPK1 overexpression exclusively showed severe hyperglycaemia and accelerated multiple early nephropathies in the kidney.10 Based on this evidence obtained from bacterial‐infected cell model, diabetic animal model and human studies of chronic diseases, ALPK1 has been proposed as a central player in the inflammatory response.
Monosodium urate (MSU) crystal is an inducer of inflammation whose deposition in articular and periarticular tissues is the common feature of acute gouty arthritis. We have demonstrated that MSU crystal can increase the levels of ALPK1 in cultured cells and is involved in the induction of proinflammatory cytokines, including IL‐1β, IL‐8, TGF‐β1 and TNF‐α.9, 10 In contrast, testosterone was found to induce a repressive effect on the production of proinflammatory cytokines upon ALPK1 inhibition.5
The aim of this study was to analyse the mediators contributing to the effect of ALPK1 in the inflammatory response causing renal injury. We detected a correlation between the expression levels of ALPK1 and NFkB in the same renal tubular cells of the mouse. Increased ALPK1 expression enhanced the expression levels of renal monocyte chemoattractant protein‐1 (MCP‐1/CCL2) and RANTES/CCL5 (RANTES, an acronym for ‘Regulated upon Activation, Normal T cell Expressed and Secreted’) both in vivo and in vitro. Further, we also discuss the regulation of chemokine by ALPK1 under high‐glucose condition and its importance in relation to renal inflammatory response.
2. MATERIALS AND METHODS
2.1. Animal procedure
In this study, animal procedures conformed to the guidelines published by the National Institute of Health (NIH Publication No. 85‐23) and were approved by the Institutional Animal Care and Use Committee (IACUC) of the China Medical University. TG mice development procedure has been mentioned in our previous paper.5 Wild‐type C57BL/6 mice were purchased from the National Laboratory Animal Center (NLAC, Taipei, Taiwan).Eight‐week‐old animals are used in our study. The mice group details are, C57BL/6 male animals (WT), hALPK1 transgenic mice (TG), streptozotocin (STZ)‐treated C57BL/6 mice (WT‐STZ) and streptozotocin‐treated hALPK1 transgenic mice (TG‐STZ). The diabetic condition was induced by five consecutive intraperitoneal injections of low‐dose STZ (40 mg/kg, dissolved in ice and 0.1 mol/L citrate buffer) daily. The treatment period is for about 3 weeks after STZ injection.10 After treatment, all animals were sacrificed and measured ALPK1 levels and cytokine transcripts by RT‐qPCR for kidney tissue.
2.2. Assessment of cytokine secretion from the mice kidneys
Whole kidney lysates were collected from WT‐STZ and TG‐STZ. Measurement of renal cytokines and chemokines for comparative analysis was performed with a Bio‐Plex Pro™ mouse cytokine 23‐plex assay kit (Bio‐Rad).
2.3. Immunohistochemistry analysis
The renal tissue samples from all animals were fixed with 4% paraformaldehyde for 3 days and embedded in paraffin. The 5 μm sections were stained with haematoxylin and eosin (H&E), specific antibodies and Masson's trichrome for histological evaluation and scoring. The protein signal was detected using the appropriate primary antibody amplifier, horseradish peroxidase (HRP)‐conjugated polymer and DAB chromogen/substrate. The slides were immunostained with anti‐NFkB p65 (50‐fold of dilution; Abcam), anti‐ALPK1 (100‐fold of dilution; GeneTex Inc), anti‐CCL2 (50‐fold of dilution; Abcam) and anti‐CCL5 (50‐fold of dilution; Abcam). The tubular injury was scored based on the degree of tubular necrosis, loss of brush border, cast formation and tubular dilatation, as in previous reports.19, 20 The scoring standard was as follows: 0‐normal kidney; 1‐minimal injury (<5% involvement); 2‐mild injury (5%‐25% involvement); 3‐moderate injury (25%‐75% involvement); and 4‐severe injury (>75% involvement).
2.4. Cell culture and transfection
Human kidney‐2 (HK‐2, normal proximal tubule cells), HEK293 and human monocytic leukaemia THP1 cells were obtained and maintained. In this study, the authentication of cell lines has been performed by STR analysis. Mouse primary kidney cell was isolated from male wild‐type (C57BL/6) mice. The ALPK1 plasmid was subcloned from pSportSfi vector containing ALPK1 cDNA. ALPK1 cDNA was amplified using the specific primers and ligated into the unique restriction sites, BglII/SalI, of the pEGFP‐C1 vector (Clontech). The resulting plasmid denoted pEGFP‐ALPK1‐C1 was confirmed by sequencing. Used human ALPK1 or non‐specific control siRNAs were purchased from Invitrogen (Stealth siRNA, Invitrogen). For examination of ALPK1 effects on CCL2 and CCL5 expressions, plasmid DNA or siRNA was transfected into cells using the Lipofetamine™ 2000 (Invitrogen) transfection reagents according to the manufacturer's protocol. After 48 hours of transfection, the cells were harvested for further analysis. The mRNA levels of ALPK1, CCL2 and CCL5 transcripts were measured by RT‐qPCR.
2.5. Real‐time quantitative PCR (RT‐qPCR)
Total RNA was isolated from treated cells and tissues using TRIzol reagent according to the manufacturer's protocol (Invitrogen, USA). The cDNA templates were produced by reverse transcription of the total RNA with random primer and a high capacity cDNA reverse transcription kit (Applied Biosystems). The qPCR analysis with specific primer pairs was performed with Power SYBR® Green PCR Master Mix (Life Technologies).
2.6. Western blotting
For detection of ALPK1, the cells were lysed with RIPA buffer containing protease inhibitors on ice for 10 minutes. The extracts were centrifuged at 14 500 g for 5 minutes at 4°C. Protein samples were separated by SDS‐PAGE gel electrophoresis and transferred to polyvinylidene fluoride membranes. The membranes were incubated with primary antibodies as indicated and peroxidase‐conjugated secondary antibodies and protein signals detected by enhanced chemiluminescence reagent. The primary antibodies used were as follows: anti‐ALPK1 (1000‐fold of dilution; GeneTex Inc), anti‐lectin (1000‐fold of dilution; Bioorbyt), anti‐NFkB (1000‐fold of dilution; Abcam) and anti‐Actin (3000‐fold of dilution; GeneTex Inc).
2.7. Immunofluorescence staining
HK‐2 cells were treated with high glucose (200 mg/dL) for 48 hours. After the treatment, cells were fixed with 4% paraformaldehyde for 15 minutes at room temperature and permeabilized with 0.5% triton X‐100 for 10 minutes at room temperature and then blocking for 1 hour. Add specific primary antibody and incubate at 4°C for overnight. Subsequently, the cells were washed and stained with Alexa 546 rabbit antimouse IgG secondary antibodies (Invitrogen) for 1 hour at room temperature. The cells were washed before nuclear staining with 1 μg/mL. Images were observed under a fluorescence microscope. The cell fluorescent intensity was measured using ImageJ software.
2.8. Statistical analysis
Quantitative data of mouse cytokines and chemokines levels were compared between the WT‐STZ and TG‐STZ using the Wilcoxon rank‐sum test. All data were expressed as mean ± standard deviation. Quantitative data were performed using unpaired Student's t test. Then, for cell culture experiments the statistical differences were evaluated using Student's t test. The level of significance was *P < .05, **P < .01, ***P < .001, ****P < .0001.
3. RESULTS
3.1. ALPK1 regulates STZ‐induced nephropathy through chemokine in transgenic mice
The TG‐STZ mice were employed for investigating the role of ALPK1 in diabetic nephropathy pathogenesis. Hyperglycaemia was found in both wild‐type and hALPK1‐TG mice after STZ injection. The microscopic examination of haematoxylin‐and‐eosin (H&E)–stained section reveals higher tubular cell necrosis, cytoplasmic vacuoles, loss of brush border and tubular dilation in TG and TG‐STZ mice compared with the WT mice (P < .0001) (Figure 1). Additionally, TG‐STZ mice showed higher collagen deposition compared with the WT mice significantly (P < .0001). Then, we found a higher significant difference between TG and TG‐STZ (P < .0001), WT and WT‐STZ (P < .0001), and WT‐STZ and TG‐STZ (P < .0001). Nonetheless, abundant ALPK1 and NFkB expressions were detected in renal tubular cells significantly (Figure 2). In addition, the chemokine CCL2 and CCL5 expressions were up‐regulated in WT‐STZ, TG and TG‐STZ compared with the control groups significantly (P < .0001) (Figure 3). Overall, the expression of target proteins was up‐regulated in TG‐STZ compared with the control groups.
Figure 1.
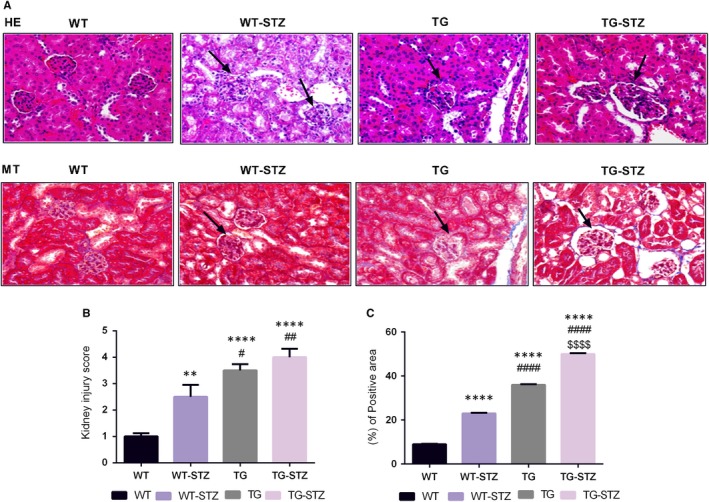
Histological examinations of kidney tissues from WT, WT‐STZ, TG and TG‐STZ (A). Haematoxylin and eosin staining and Masson's trichrome staining (B). Kidney injury score of four groups (C). Collagen deposition was higher in TG‐STZ. **P < .01 are compared to the WT; ****P < .0001 are compared to the WT; #P < .05 are compared to the WT‐STZ; ##P < .01 are compared to the WT‐STZ; ####P < .0001 are compared to the WT‐STZ; and $$$$P < .0001 are compared to the TG
Figure 2.
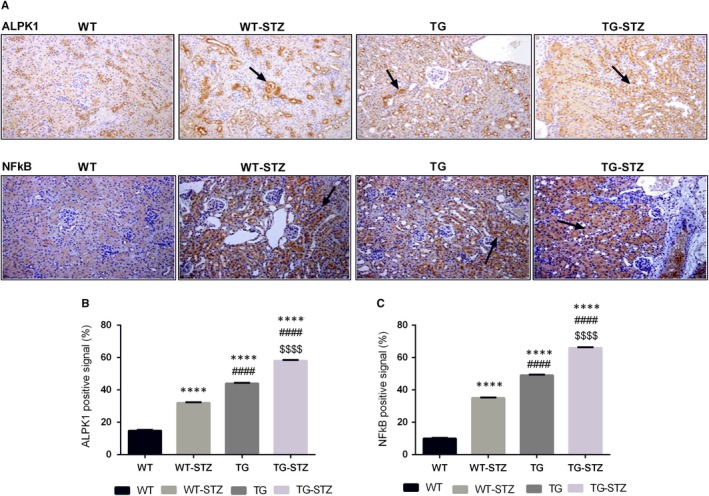
Immunohistochemical expression of ALPK1 and NFkB (A). The up‐regulation of ALPK1 and NFkB expression in STZ treated mice and overexpression of ALPK1 mice. Brown positive signals were predominantly distributed in renal tissues (B, C). ALPK1 and NFkB positive cells in renal tissue from the immunohistochemical analysis of WT, WT‐STZ, TG and TG‐STZ. These graphs represent mean ± SD. ****P < .0001 are compared to the WT; ####P < .0001 are compared to the WT‐STZ; and $$$$P < .0001 are compared to the TG
Figure 3.
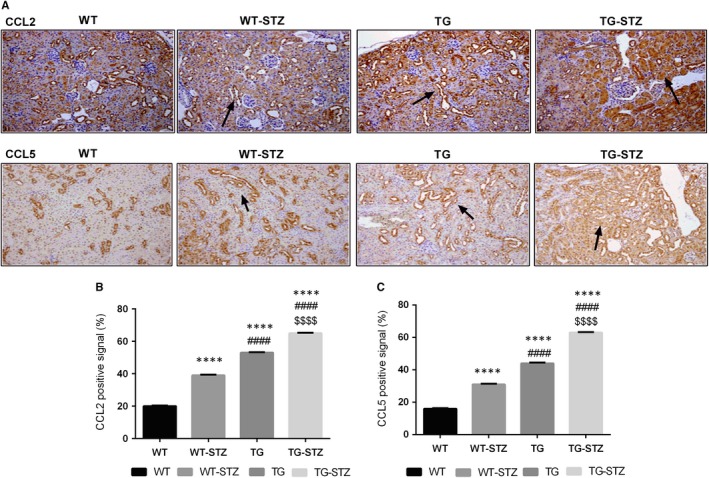
Immunohistochemical expression of CCL2 and CCL5 (A). The up‐regulation of CCL2 and CCL5 expression in STZ‐treated mice and overexpression of ALPK1 mice. Brown positive signals were predominantly distributed in renal tissues (B, C). CCL2 and CCL5 positive cells in renal tissue from the immunohistochemical analysis of WT, WT‐STZ, TG and TG‐STZ. These graphs represent mean ± SD. ****P < .0001 are compared to the WT; ####P < .0001 are compared to the WT‐STZ; $$$$P < .0001 are compared to the TG
3.2. Effects of ALPK1 on renal cytokine/chemokine release in STZ stimulated mice
Then, a selected 23 cytokines/chemokines antibody array analysis on the kidney lysate from TG‐STZ and WT‐STZ mice was performed. As shown in Figure 4A, TG‐STZ mice had significantly higher granulocyte colony‐stimulating factor (G‐CSF) (1.59‐fold, P = .023), MCP‐1/CCL2 (1.25‐fold, P = .046) and RANTES/CCL5 (1.51‐fold, P = .023) than WT‐STZ. Additionally, keratinocyte‐derived cytokine (KC/CXCL1/IL‐8) trended to up‐regulation in the TG‐STZ group compared with the WT‐STZ group (1.56‐fold, P = .064). These results suggest that the elevated ALPK1 expression enhances the renal levels of cytokine/chemokine protein in mice with a hyperglycaemic condition.
Figure 4.
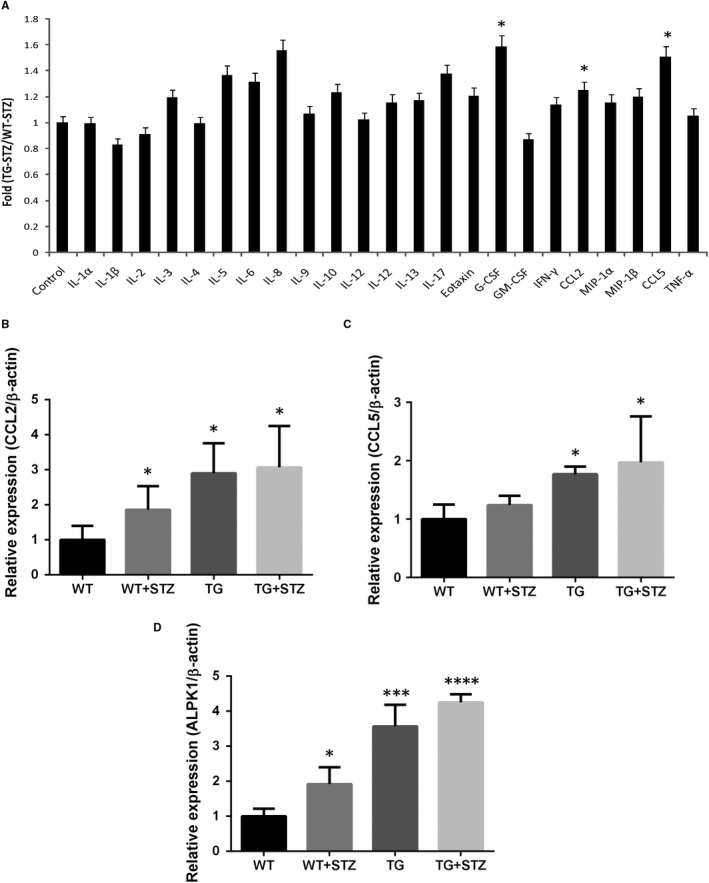
Cytokine and chemokine secretion increased in TG‐STZ mice (A). Bio‐Plex Pro™ mouse cytokine array was used to screen cytokine or chemokine secretion in kidney samples from WT‐STZ and TG‐STZ (B‐D). Transcripts of CCL2, CCL5 and ALPK1 were measured by RT‐qPCR. Results of RT‐qPCR were repeated three times. Higher ALPK1 levels correlate with increased cytokine and chemokine expression in STZ‐treated mice. Values shown in the graph are mean ± SD. *P < .05 are compared with the WT; ***P < .001 are compared with the WT; ****P < .0001 are compared with the WT
3.3. Higher renal levels of CCL2 and CCL5 mRNA expression in transgenic mice
We had compared the renal mRNA levels of ALPK1, CCL2, CCL5, G‐CSF and IL‐8 for all four groups. Higher mRNA levels of CCL2 and CCL5 in TG‐STZ mice were compared with the control mice (P < .05) (Figure 4B‐D). Nonetheless, we found significant lower levels of G‐CSF transcripts in TG mice compared with the control mice. In addition, there is no significant difference among the groups in IL‐8 transcripts. These results show that higher ALPK1 level correlates with higher levels of CCL2 and CCL5, indicating that ALPK1 may enhance the production of CCL2 and CCL5 in mice.
3.4. The up‐regulation of ALPK1 in cultured kidney cells by glucose stimulation
The glucose effects on ALPK1 induction in THP1 cells were evaluated using RT‐qPCR. Glucose stimulation significantly increased the levels of ALPK1 transcripts (Figure 5A). Then, we investigated whether glucose increased ALPK1 expression in cultured kidney cells. Confluent human kidney HK‐2 cells were cultured in the medium with raised glucose levels for 48 hours. Levels of ALPK1 mRNA and protein were measured. Glucose significantly increased both ALPK1 mRNA and protein levels (P < .05) (Figure 5B‐D). Then, the protein expression of NFkB and lectins (P < .05) was up‐regulated in glucose‐treated HK‐2 cells. Immunofluorescence staining showed a high level of ALPK1 (P < .01) and lectin (P < .05) expressions in glucose‐treated HK‐2 cells compared with the control cells (Figure 6). These results suggest that glucose enhances ALPK1 expression in cultured THP1 and HK‐2 cells.
Figure 5.
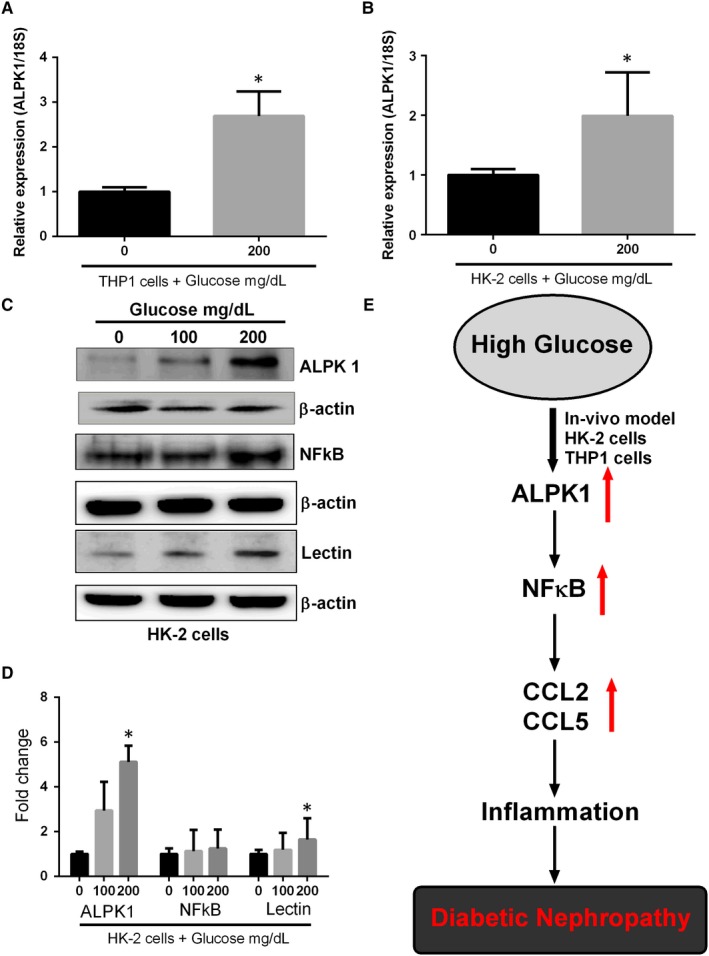
Up‐regulation of ALPK1 in cultured kidney cells by glucose stimulation. THP1 and HK‐2 cells were treated with glucose for 48 h. Transcripts of ALPK1 were measured by RT‐qPCR. Glucose increased ALPK1 mRNA levels in (A). THP1 (B). HK‐2 cells. Graphs represent mean ± SD values, and each experiment was performed in triplicate (C). The protein expression of ALPK1, NFkB, lectin and β‐actin was determined by Western blotting in HK‐2 cells (D). The enhanced effect of glucose on ALPK1, NFkB and lectin protein expressions was plotted on the bar graph. ALPK1 protein signal was quantified by densitometry analysis and expressed as a fold change in respective control cells from three independent experiments (E). Schematic model showing that the ALPK1 regulates glucose induced nephropathy through CCL2 and CCL5 expressions. ∗P < .05 compared with the THP1 or HK‐2 cells without glucose stimulation
Figure 6.
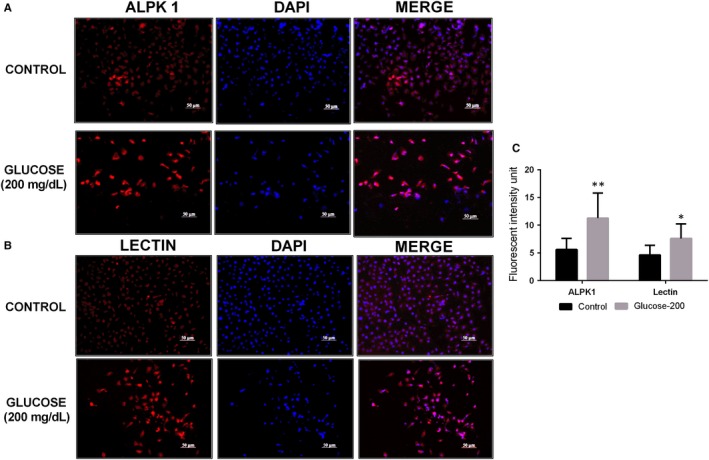
ALPK1 and lectin expression in HK‐2 cells. (A, B). Immunofluorescence staining showed a high level of ALPK1 and lectin expressions in HK‐2 cells treated with high glucose. Cell nuclei were stained with DAPI (Blue). (C). Quantification of cell fluorescent intensity. *P < .05 are compared with the control cells; **P < .01 are compared with the control cells
3.5. Overexpression and knockdown of ALPK1 in cultured kidney cells
To further elucidate the effect of ALPK1 on CCL2 and CCL5 expressions, we knock down the endogenous ALPK1 gene expression in HK‐2 cells. ALPK1 reduction decreased CCL2 and CCL5 mRNA expressions significantly (P < .05) (Figure 7A‐C). Endogenous ALPK1 expression is rarely shown in HEK293 cells.9 Therefore, we transfected pEGFP and pEGFP‐ALPK1 plasmids into HEK293 cells. The up‐regulation of CCL2 and CCL5 mRNA expression was observed in ALPK1‐overexpressed cells (Figure 7D‐F). Taken together, these results indicate positive association between ALPK1, CCL2 and CCL5 expressions.
Figure 7.
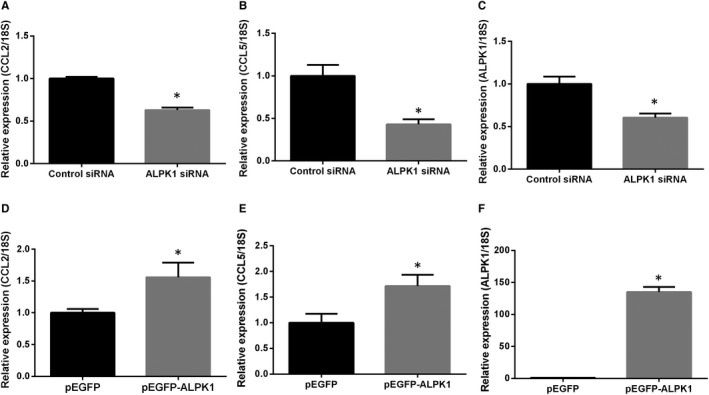
Effect of ALPK1 on CCL2 and CCL5 expression in cultured kidney cells (A‐C). HK‐2 cells were transfected with ALPK1 or control siRNA for 48h. Transcripts of ALPK1, CCL2 and CCL5 were measured by RT‐qPCR (D‐F). HEK293 cells were transfected with pEGFP‐ALPK1 or control pEGFP vectors for 48 h. ALPK1, CCL2 and CCL5 mRNA levels were measured by RT‐qPCR. Results of RT‐qPCR were repeated for three times. ∗P < .05 compared with cells transfected with control siRNA/pEGFP vectors.
4. DISCUSSION
Genetic epidemiological studies have identified ALPK1 as a susceptible gene responsible for causing gout.3, 9 Later studies indicated the associations between ALPK1 and many chronic diseases such as CKD, myocardial infarction, coronary artery disease and type 2 DM.2, 21, 22, 23, 24 Increasing evidence demonstrates that chronic inflammation is the major cause of these common diseases.25 Recent studies have demonstrated that ALPK1 is required for the phosphorylation‐dependent formation of TIFA complexes, with TRAF2 resulting in NFkB activation‐mediated secretion of inflammatory cytokines, including IL‐8, during bacterial infection.11, 12 Although the effects of MSU crystals and testosterone on TIFA complexes have not been reported, the regulation of the induction of proinflammatory cytokines might be through the TIFA pathway. Several studies have also demonstrated that high‐glucose levels can induce NFkB activation.26, 27 Therefore, regulation of the ALPK1‐TIFA‐NFkB pathway might play a predominant role in the pathogenesis of chronic diseases, in addition to its role in the cellular response against bacterial infections.
The chemokine CCL2, a member of C–C chemokine family, is ubiquitously expressed in various cell types and is responded to a wide variety of stimulation.28 Elevated levels of CCL2 in blood have been found in patients with type 2 DM.28 The CCL2 knockout mice show reduced macrophage accumulation in the kidney and the progression of renal injury in diabetic conditions.29, 30 CCL5 also belongs to the C–C chemokine family. It is secreted by various cell types including endothelial cells, smooth muscle cells, macrophages, platelets and activated T cells.31 High CCL5 levels in serum were measured in type 2 DM patients with hypertriglyceridaemia.32 CCL5 is reported to mediate acute renal injury in mice, whereas CCL5 knockout mice show better renal function during kidney ischaemia‐reperfusion injury.33 High levels of CCL2 were detected in tubular cells in biopsies from patients with type 2 DM and overt DN, correlating with NF‐kappaB activation in the same cells of kidney.34 Production of CCL5 by renal tubular cells during acute renal injury in mice is reported.33 We have demonstrated abundant expression of ALPK1 in renal tubular cells of mice.6 These shreds of evidence strongly suggest that ALPK1 enhances CCL2 and CCL5 expression through NFkB activation in hyperglycaemic conditions in renal tubular cells.
G‐CSF, a hematopoietic growth factor, showed protective effects in a variety of renal disease models including DN in rat.35 In the present study, the up‐regulation of G‐CSF in renal cell suffering high‐glucose stimulation might be a protective mechanism for preventing renal injury. Kidney deposition of urate crystals has been observed in patients with chronic gouty arthritis, which predisposes patients to renal fibrotic injury.36 The increased level of mannose‐binding lectin (MBL) regulates risk of developing microalbuminuria and DN.37, 38, 39 In addition, Axelgaard et al40 reported that MBL accumulates in the kidney during late DN. These results implicate the critical role of ALPK1 in the pathogenesis of renal injury in patients with chronic gout. NFkB pathway is activated in both human patients with kidney diseases and experimental animal models of renal inflammation and injury. Conventional therapies for DN targeting modulation of NFkB activation have been suggested and tested. Modulation of ALPK1 activation might also be a potential therapeutic target for DN.
In conclusion, high‐glucose stimulation enhances ALPK1 expression in the kidney in vitro and in vivo. Elevated ALPK1 expression up‐regulates the renal levels of CCL2 and CCL5 in cultured kidney cell and in mice model. Our data suggest that ALPK1 is a potential mediator for CCL2 and CCL5 chemokines induction involving in ALPK1‐mediated accelerated diabetic nephropathies.
CONFLICT OF INTEREST
The authors declare that they have no conflict of interest exists.
AUTHOR CONTRIBUTIONS
YCK conceived, designed and supervised the study. CPL and SN conducted the experiment, integrated the results and drafted the manuscript. TMK and SN analysed data and gave suggestion on experimental design. HTH and KTY involved in microscopic experiments. All the authors were involved in the discussion and reviewed the manuscript.
ACKNOWLEDGEMENTS
This study was supported by Ministry of Science and Technology MOST 106‐2314‐B‐039‐017‐MY3, and China Medical University Hospital DMR 106‐115, 107‐108 and 108‐222.
Lee C‐P, Nithiyanantham S, Hsu H‐T, Yeh K‐T, Kuo T‐M, Ko Y‐C. ALPK1 regulates streptozotocin‐induced nephropathy through CCL2 and CCL5 expressions. J Cell Mol Med. 2019;23:7699–7708. 10.1111/jcmm.14643
Chi‐Pin Lee and Srinivasan Nithiyanantham contributed equally to this work.
DATA AVAILABILITY STATEMENT
All data generated or analysed during this study are included in this manuscript.
REFERENCES
- 1. Yamada Y, Matsui K, Takeuchi I, Oguri M, Fujimaki T. Association of genetic variants of the alpha‐kinase 1 gene with type 2 diabetes mellitus in a longitudinal population‐based genetic epidemiological study. Biomed Rep. 2015;3(3):347‐354. [DOI] [PMC free article] [PubMed] [Google Scholar]
- 2. Yamada Y, Nishida T, Ichihara S, et al. Identification of chromosome 3q28 and ALPK1 as susceptibility loci for chronic kidney disease in Japanese individuals by a genome‐wide association study. J Med Genet. 2013;50(6):410‐418. [DOI] [PubMed] [Google Scholar]
- 3. Min‐Shan Ko A, Tu H‐P, Liu T‐T, et al. ALPK1 genetic regulation and risk in relation to gout. Int J Epidemiol. 2013;42(2):466‐474. [DOI] [PMC free article] [PubMed] [Google Scholar]
- 4. Chen M, Xu R. Motor coordination deficits in Alpk1 mutant mice with the inserted piggy Bac transposon. BMC Neurosci. 2011;12:1. [DOI] [PMC free article] [PubMed] [Google Scholar]
- 5. Kuo T‐M, Yeh K‐T, Hsu H‐T, et al. ALPK1 affects testosterone mediated regulation of proinflammatory cytokines production. J Steroid Biochem Mol Biol. 2015;154:150‐158. [DOI] [PubMed] [Google Scholar]
- 6. Kuo TM, Huang CM, Tu HP, et al. URAT1 inhibition by ALPK1 is associated with uric acid homeostasis. Rheumatology. 2017;56(4):654‐659. [DOI] [PubMed] [Google Scholar]
- 7. Lee CP, Chiang SL, Ko A, et al. ALPK1 phosphorylates myosin IIA modulating TNF‐alpha trafficking in gout flares. Sci Rep. 2016;6:25740. [DOI] [PMC free article] [PubMed] [Google Scholar]
- 8. Heine M, Cl C‐B, Ansari A, et al. Alpha‐kinase 1, a new component in apical protein transport. J Biol Chem. 2005;280(27):25637‐25643. [DOI] [PubMed] [Google Scholar]
- 9. Wang SJ, Tu HP, Ko AM, et al. Lymphocyte alpha‐kinase is a gout‐susceptible gene involved in monosodium urate monohydrate‐induced inflammatory responses. J Mol Med. 2011;89(12):1241‐1251. [DOI] [PubMed] [Google Scholar]
- 10. Kuo T‐M, Hsu H‐T, Chung C‐M, et al. Enhanced alpha‐kinase 1 accelerates multiple early nephropathies in streptozotocin‐induced hyperglycemic mice. Biochim Biophys Acta. 2016;1862(11):2034‐2042. [DOI] [PubMed] [Google Scholar]
- 11. Milivojevic M, Dangeard A‐S, Kasper CA, et al. ALPK1 controls TIFA/TRAF6‐dependent innate immunity against heptose‐1,7‐bisphosphate of gram‐negative bacteria. PLoS Pathog. 2017;13(2):e1006224. [DOI] [PMC free article] [PubMed] [Google Scholar]
- 12. Zimmermann S, Pfannkuch L, Al‐Zeer MA, et al. ALPK1‐ and TIFA‐dependent innate immune response triggered by the helicobacter pylori type IV secretion system. Cell Rep. 2017;20(10):2384‐2395. [DOI] [PubMed] [Google Scholar]
- 13. Duran‐Salgado MB, Rubio‐Guerra AF. Diabetic nephropathy and inflammation. World J Diabetes. 2014;5(3):393‐398. [DOI] [PMC free article] [PubMed] [Google Scholar]
- 14. Collins AJ, Foley RN, Chavers B, et al. US renal data system 2013 annual data report. Am J Kidney Dis. 2014;63(1):A7. [DOI] [PubMed] [Google Scholar]
- 15. Wada J, Makino H. Inflammation and the pathogenesis of diabetic nephropathy. Clin Sci. 2013;124(3):139‐152. [DOI] [PubMed] [Google Scholar]
- 16. Song KH, Park J, Park JH, Natarajan R, Ha H. Fractalkine and its receptor mediate extracellular matrix accumulation in diabetic nephropathy in mice. Diabetologia. 2013;56(7):1661‐1669. [DOI] [PMC free article] [PubMed] [Google Scholar]
- 17. Anders HJ, Vielhauer V, Schlondorff D. Chemokines and chemokine receptors are involved in the resolution or progression of renal disease. Kidney Int. 2003;63(2):401‐415. [DOI] [PubMed] [Google Scholar]
- 18. Lim AK, Tesch GH. Inflammation in diabetic nephropathy. Mediators Inflamm. 2012;2012:146154. [DOI] [PMC free article] [PubMed] [Google Scholar]
- 19. Gao J, Liu R, Wu J, et al. The use of chitosan based hydrogel for enhancing the therapeutic benefits of adipose‐derived MSCs for acute kidney injury. Biomaterials. 2012;33(14):3673‐3681. [DOI] [PubMed] [Google Scholar]
- 20. Hagiwara S, Koga H, Iwasaka H, et al. ETS‐GS, a new antioxidant, ameliorates renal ischemia‐reperfusion injury in a rodent model. J Surg Res. 2011;171(1):226‐233. [DOI] [PubMed] [Google Scholar]
- 21. Fujimaki T, Horibe H, Oguri M, Kato K, Yamada Y. Association of genetic variants of the alpha‐kinase 1 gene with myocardial infarction in community‐dwelling individuals. Biomed Rep. 2014;2(1):127‐131. [DOI] [PMC free article] [PubMed] [Google Scholar]
- 22. Shimokata S, Oguri M, Fujimaki T, Horibe H, Kato K, Yamada Y. Association between polymorphisms of the alpha‐kinase 1 gene and type 2 diabetes mellitus in community‐dwelling individuals. Biomed Rep. 2013;1(6):940‐944. [DOI] [PMC free article] [PubMed] [Google Scholar]
- 23. Yamada Y, Matsui K, Takeuchi I, Fujimaki T. Association of genetic variants with dyslipidemia and chronic kidney disease in a longitudinal population‐based genetic epidemiological study. Int J Mol Med. 2015;35(5):1290‐1300. [DOI] [PMC free article] [PubMed] [Google Scholar]
- 24. Yamada Y, Matsui K, Takeuchi I, Fujimaki T. Association of genetic variants with coronary artery disease and ischemic stroke in a longitudinal population‐based genetic epidemiological study. Biomed Rep. 2015;3(3):413‐419. [DOI] [PMC free article] [PubMed] [Google Scholar]
- 25. Hunter P. The inflammation theory of disease. The growing realization that chronic inflammation is crucial in many diseases opens new avenues for treatment. EMBO Rep. 2012;13(11):968‐970. [DOI] [PMC free article] [PubMed] [Google Scholar]
- 26. Wang J, Li G, Wang Z, et al. High glucose‐induced expression of inflammatory cytokines and reactive oxygen species in cultured astrocytes. Neuroscience. 2012;202:58‐68. [DOI] [PubMed] [Google Scholar]
- 27. Chen S, Feng B, Thomas AA, Chakrabarti S. miR‐146a regulates glucose induced upregulation of inflammatory cytokines extracellular matrix proteins in the retina and kidney in diabetes. PLoS ONE. 2017;12(3):e0173918. [DOI] [PMC free article] [PubMed] [Google Scholar]
- 28. Panee J. Monocyte Chemoattractant Protein 1 (MCP‐1) in obesity and diabetes. Cytokine. 2012;60(1):1‐12. [DOI] [PMC free article] [PubMed] [Google Scholar]
- 29. Chow FY, Nikolic‐Paterson DJ, Ma FY, Ozols E, Rollins BJ, Tesch GH. Monocyte chemoattractant protein‐1‐induced tissue inflammation is critical for the development of renal injury but not type 2 diabetes in obese db/db mice. Diabetologia. 2007;50(2):471‐480. [DOI] [PubMed] [Google Scholar]
- 30. Chow FY, Nikolic‐Paterson DJ, Ozols E, Atkins RC, Rollin BJ, Tesch GH. Monocyte chemoattractant protein‐1 promotes the development of diabetic renal injury in streptozotocin‐treated mice. Kidney Int. 2006;69(1):73‐80. [DOI] [PubMed] [Google Scholar]
- 31. Charo IF, Ransohoff RM. The many roles of chemokines and chemokine receptors in inflammation. N Engl J Med. 2006;354(6):610‐621. [DOI] [PubMed] [Google Scholar]
- 32. Feng X, Gao X, Jia Y, Zhang H, Xu Y, Wang G. PPAR‐alpha agonist fenofibrate decreased RANTES levels in type 2 diabetes patients with hypertriglyceridemia. Med Sci Monit. 2016;22:743‐751. [DOI] [PMC free article] [PubMed] [Google Scholar]
- 33. Yu TM, Palanisamy K, Sun KT, et al. RANTES mediates kidney ischemia reperfusion injury through a possible role of HIF‐1alpha and LncRNA PRINS. Sci Rep. 2016;6:18424. [DOI] [PMC free article] [PubMed] [Google Scholar]
- 34. Mezzano S, Aros C, Droguett A, et al. NF‐kappaB activation and overexpression of regulated genes in human diabetic nephropathy. Nephrol Dial Transplant. 2004;19(10):2505‐2512. [DOI] [PubMed] [Google Scholar]
- 35. Xu S, Hoglund M, Hakansson L, Venge P. Granulocyte colony‐stimulating factor (G‐CSF) induces the production of cytokines in vivo. Br J Haematol. 2000;108(4):848‐853. [DOI] [PubMed] [Google Scholar]
- 36. Richette P, Bardin T. Gout. Lancet. 2010;375(9711):318‐328. [DOI] [PubMed] [Google Scholar]
- 37. Hansen TK, Tarnow L, Thiel S, et al. Association between mannose binding lectin and vascular complications in type 1 diabetes. Diabetes. 2004;53(6):1570‐1576. [DOI] [PubMed] [Google Scholar]
- 38. Hovind P, Hansen TK, Tarnow L, et al. Mannose binding lectin as a predictor of microalbuminuria in type 1 diabetes: an inception cohort study. Diabetes. 2005;54(5):1523‐1527. [DOI] [PubMed] [Google Scholar]
- 39. Saraheimo M, Forsblom C, Hansen TK, et al. Increased levels of mannan binding lectin in type 1 diabetic patients with incipient and overt nephropathy. Diabetologia. 2005;48(1):198‐202. [DOI] [PubMed] [Google Scholar]
- 40. Axelgaard E, Østergaard JA, Thiel S, Hansen TK. Diabetes is associated with increased autoreactivity of mannan binding lectin. J Diabetes Res. 2017;6368780:1‐12. [DOI] [PMC free article] [PubMed] [Google Scholar]
Associated Data
This section collects any data citations, data availability statements, or supplementary materials included in this article.
Data Availability Statement
All data generated or analysed during this study are included in this manuscript.


