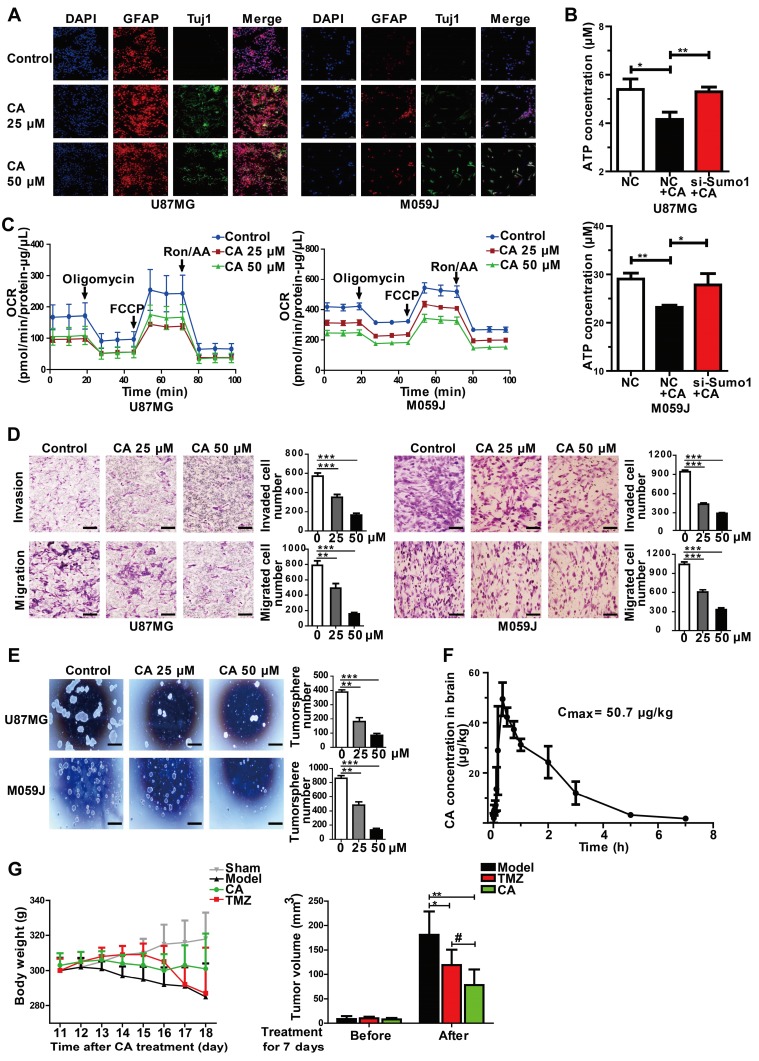
Figure 6.
CA is effective for glioma cells in vitro and in vivo. (A) Immunofluorescence assay was shown the expression of glioma cell differentiation markers, GFAP (the astrocyte marker) and Tuj1 (the neuron marker) in U87MG and M059J cells after exposure to CA (Bar = 50 μm). (B) Total ATP level was detected by measuring the luminescence in U87MG and M059J cells after respective treatment. (C) Mitochondrial stress test of U87MG and M059J cells after exposure to CA. Oxygen consumption rate (OCR) was calculated by the Seahorse XF-24 analysis. (D) Representative images of invasion (upper) and migration (lower) of U87MG and M059J cells after exposure to CA. Data are presented as mean ± SEM, ** p < 0.01, *** p < 0.001 (CA treated versus untreated control. Scale bars indicate 10 μm). (E) Glioma cell sphere formation of U87MG (upper) and M059J (lower) cells after exposure to CA stained with 0.4% Trypan blue, calculated and observed at 200 × magnifications under the microscope. Data are presented as mean ± SEM, ** p < 0.01, *** p < 0.001 (CA treated versus untreated control. Scale bars indicate 10 μm). (F) CA concentration in the brain was measured at consecutive time points post injection (ip) with 3 rats for each time point. (G) CA treatment (75 mg/kg, ip, bid, for 7 days) did not significantly reduce the body weight of the rats as compared to the sham group (left), and inhibited the C6 glioma tumor growth in rats with a higher inhibitory efficacy than that of temozolomide (right; 20 mg/kg/d, oral, for 5 days). Data are presented as mean ± SD, # p < 0.05, CA group versus TMZ group; * p < 0.05, ** p < 0.01, CA or TMZ group versus model group; n = 6 for each group).

