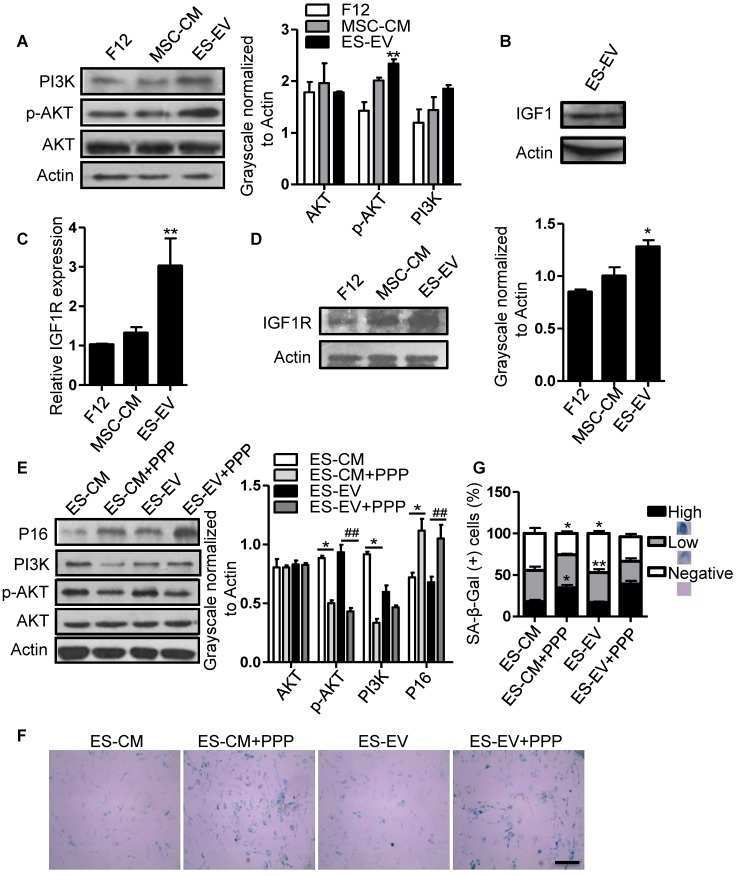
Figure 6.
ES-EVs activate the IGF1/PI3K/AKT pathway in senescent MSCs. (A) Expression levels of PI3K, AKT, and p-AKT in MSCs with different treatment were detected by western blot (left). Histogram showed the quantitative analysis of western blot (right). (B) IGF1 was detected in ES-EVs using western blot analysis. (C) RT-PCR analysis the expression of IGF1R in late-passaged MSCs treated with F12, MSC-CM, and ES-EVs for 48 hours. (D) Expression level of IGF1R in MSCs with ES-EVs treatment for 48 hours was detected by western blot. (E) Protein levels of P16, PI3K, AKT, and p-AKT in late-passaged MSCs treated with picropodophyllin (PPP: IGF1R inhibitor) were analyzed using western blot (left). Histogram showed the quantitative analysis of western blot (right). (F) Effect of PPP on SA-β-gal activity of late-passaged MSCs. Scale bar represents 100 μm. (G) Histogram showed the quantitative analysis of the percentage of SA-β-gal-positive cells. Data are presented as the Mean ± SEM. (n = 3; *p <.05, **p < .01).

