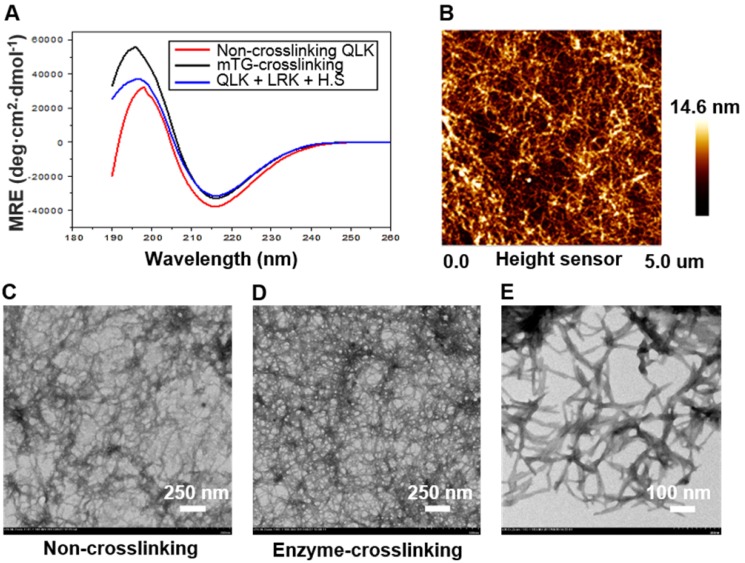
Figure 2.
(A) The CD spectroscopy displayed the typical peaks, indicating the appearance of β-sheet structure in QLK sequences (red), QLK sequences after mTG crosslinking (black), and QLK sequences mixed with LRK sequences and HS (blue). (B) The representative AFM image of a three-dimensional fiber entanglement network of crosslinked QLK SAP. (C) The representative TEM images of 0.05 % (w/v) QLK SAP solution without mTG crosslinking. (D, E) 0.05 % (w/v) QLK SAP solution after mTG (20 U/mL) crosslinking with different magnifications.

