

Abstract
Aims
Cardiac cachexia is a wasting syndrome characterized by chronic inflammation and high mortality. Fibroblast growth factor 21 (FGF‐21) and monocyte chemoattractant protein 1 (MCP‐1) are associated with cardiovascular disease and systemic inflammation. We investigated FGF‐21 and MCP‐1 in relations to cardiac function, inflammation, and wasting in patients with heart failure with reduced ejection fraction (HFrEF) and cardiac cachexia.
Methods and results
Plasma FGF‐21 and MCP‐1 were measured in a cross‐sectional study among the three study groups: 19 patients with HFrEF with cardiac cachexia, 19 patients with HFrEF without cachexia, and 19 patients with ischaemic heart disease and preserved ejection fraction. Patients with HFrEF and cardiac cachexia displayed higher FGF‐21 levels median (inter quantile range) 381 (232–577) pg/mL than patients with HFrEF without cachexia 224 (179–309) pg/mL and ischaemic heart disease patients 221 (156–308) pg/mL (P = 0.0496). No difference in MCP‐1 levels were found among the groups (P = 0.345). In a multivariable regression analysis, FGF‐21 (logarithm 2) was independently associated with interleukin 6 (logarithm 2) (P = 0.015) and lower muscle mass (P = 0.043), while no relation with N‐terminal pro‐hormone brain natriuretic peptide was observed.
Conclusions
Fibroblast growth factor 21 (FGF‐21) levels were elevated in patients with HFrEF and cardiac cachexia, which could be mediated by increased inflammation and muscle wasting rather than impaired cardiac function.
Keywords: Fibroblast growth factor 21, FGF‐21, Monocyte chemoattractant protein 1, Cardiac cachexia, Muscle wasting, Heart failure with reduced ejection fraction
Introduction
Cardiac cachexia is a wasting syndrome characterized by unintentional weight loss and a poor prognosis1. The wasting syndrome is prevalent in 15–20% of patients with heart failure (HF) with reduced ejection fraction (HFrEF).2, 3 Patients with cardiac cachexia present with symptoms such as anorexia, loss of muscle mass, and reduced functional capacity.4 The pathophysiology of cardiac cachexia has been described as a state of catabolic dysfunction characterized by insulin resistance and chronic inflammation, possibly mediated by increased neurohormonal activation.5, 6, 7 The mechanisms, however, in the development of cardiac cachexia are still not well understood. Biomarkers that could generate more knowledge of the pathophysiological mechanisms behind the progression of stable HFrEF into cardiac cachexia would thus be of great clinical importance. Fibroblast growth factor 21 (FGF‐21) is a novel regulator in glucose and lipid metabolism8 and notably has demonstrated cardio protective effects in experimental studies by reducing cardiac inflammation in response to cardiac stress.9 In humans, increased circulating FGF‐21 levels have been reported in several conditions related to cardiac cachexia, such as HF, systemic inflammation, insulin resistance, and myopathy, and high FGF‐21 is associated with impaired outcome.10, 11, 12, 13 Therefore, investigating the relationship between FGF‐21, inflammation, and muscle wasting in HFrEF with cardiac cachexia is of great clinical importance.
Monocyte chemoattractant protein 1 (MCP‐1) is one of the key chemokines regulating migration and infiltration of inflammatory cells essential for the cardiac remodelling and progressive impairment in HFrEF.14, 15 The impact of MCP‐1 in patients with HFrEF is controversial as both elevated and low circulating levels have been reported.16, 17, 18 Furthermore, the effect of cardiac cachexia on MCP‐1 levels has yet to be evaluated.
The aim of this study was to investigate plasma levels of circulating FGF‐21 and MCP‐1 in patients with HFrEF with and without cardiac cachexia, as compared with patients with ischaemic heart disease (IHD), and further to assess the relationship between these biomarkers and inflammation, muscle wasting, and cardiac function.
Methods
Study population
A total of 238 non‐diabetic patients with HFrEF were screened for cardiac cachexia at the HF outpatient clinic at Copenhagen University Hospital, Herlev and Gentofte, Denmark, from October 2008 to January 2011. We identified 29 patients with cardiac cachexia, four were excluded due to severe co‐morbidity (chronic obstructive pulmonary disease and cancer), and six declined to participate. Thus, 19 patients with HFrEF and cardiac cachexia were included in the study (the screening methods have previously been described in details2). Two control groups of equal size (n = 19) were recruited from the approximately 500 patients attending the HF outpatient clinic and the outpatient cardiology clinic at Copenhagen University Hospital, Herlev and Gentofte, Denmark: one control group with HFrEF without cachexia and a second control group (IHD) with prior myocardial infarction, preserved left ventricle ejection fraction (LVEF >45%) and without symptoms of HF. Each included patient with cardiac cachexia was individually matched by sex, age, and kidney function with the two controls. Patients with IHD were chosen as controls, because IHD was expected to be a significant co‐morbidity among patients with HFrEF; and IHD was seen as the most similar patient group according to underlying primary and metabolic disorders. To meet the inclusion criteria, patients with HFrEF should be clinically stable, with no recent hospital admission and on maximum tolerated dose of evidence‐based HF medicine within the last 6 months. Cardiac cachexia was defined as unintentional non‐oedematous weight loss above 5% within the last 6 months.19, 20 HFrEF was assessed at enrolment by echocardiography; all scans were performed by the same investigator. HFrEF was defined as LVEF <45% in combination with symptoms according to the New York Heart Association (NYHA) classification.
Ethics
The study was approved by the Capital Regional Committee on Health Research Ethics in Denmark. The investigations were conducted with respect to the principles outlined in the Declaration of Helsinki. Oral and written informed consent were obtained from all participants prior to study inclusion.
Laboratory assessments
Venous blood samples were drawn in the morning after a minimum of 8 h of overnight fast and stored in aliquots at −80°C until analysis. First void morning urine samples were collected. EDTA‐plasma levels of FGF‐21, MCP‐1, interleukin 6 (IL‐6), and mid‐regional pro‐atrial natriuretic peptide (MR‐proANP) were measured by enzyme‐linked immunosorbent assay [Quantikine, R&D Systems, Abingdon, UK, FGF‐21: intra‐assay and inter‐assay coefficient of variation (CV): <3.9%, 5.2–10.9%; MCP‐1: CV < 7.8%, 4.6–6.7%; IL‐6: CV < 7%; MR‐proANP: BRAHMS, Hennigsdorf, Germany, CV < 6.5%, 5–20%].21, 22 N‐terminal pro‐hormone brain natriuretic peptide (NT‐proBNP), high sensitive C‐reactive protein, lipids, plasma glucose, creatinine, and urine‐albumin and urine‐creatinine as albumin/creatinine ratio were determined by routine in‐house analyses at the Department of Biochemistry, Copenhagen University Hospital, Herlev and Gentofte, Denmark. Insulin resistance was estimated by fasting plasma glucose and insulin according to the Homeostasis Model Assessment Index .23 Estimated glomerular filtration rate (eGFR) was calculated as measurement of kidney function using the Modification of Diet in Renal Disease formula.24
Body composition measurements
Total fat mass, android, and gynoid fat mass and fat‐free mass were determined by dual‐energy X‐ray absorptiometry (Lunar Prodigy DXA scanner, software version 10.51, GE Medical Systems, Wisconsin, USA). The method is a previously validated method to determine body composition with high accuracy and reproducibility.25
Statistical analyses
Continuous variables are presented as mean ± standard deviation (SD) if assumptions of normal distribution were adequately fulfilled by evaluating linearity of residuals in quantile plots. Group comparisons were tested by ANOVA. Non‐parametric variables and variables not fulfilling homogeneity of variance between the groups (P < 0.05 in Levene's test) are presented as median (inter quantile range) with group comparisons by χ2/Kruskal–Wallis test. Post hoc comparisons among the three groups were tested with Bonferroni correction. Continuous variables with skewed distributions [FGF‐21, MCP‐1, NT‐proBNP, MR‐proANP, IL‐6, high sensitive C‐reactive protein, homeostatic model assessment of insulin resistance (HOMA‐IR), and albumin/creatinine ratio] were logarithmically transformed using logarithm 2 (log2) before entered in the linear regression analyses. Univariate linear regression analyses were performed to assess associations between FGF‐21 and MCP‐1, respectively, and markers of inflammation, wasting, cardiac function, lipid and glucose metabolism, and kidney function. Correction for multiple testing was performed by Benjamini–Hochberg's false discovery rate.26 Two multivariable linear regression analyses were created to evaluate parameters predictive of FGF‐21 and MCP‐1 levels and preformed with stepwise backward elimination. Adjusting for age and sex as well, parameters were included in the models if P < 0.10 in univariate regression analyses. Accordingly, in a model of predictors of FGF‐21 levels, the following parameters were included: age, sex, IL‐6, NT‐proBNP, total fat‐free mass, total cholesterol, and haemoglobin A1c (HbA1c). In the model of MCP‐1, the following variables were included: age, sex, eGFR, HbA1c, total cholesterol, total fat mass, and IHD. Patient Number 35 had a plasma FGF‐21 concentration of 8069 pg/mL, which exceeded the assay detection limit of 2000 pg/mL, why several dilutions were performed. This value varies greatly from the rest of the study participants with 1550 pg/mL as the second highest value measured and a 95% percentile of 1280 pg/mL. The outlier status was then tested: Cook's distance was 0.288 in a univariate regression analysis between FGF‐21 (log2) and IL‐6 (log2), which exceeds the recommended value of for identifying outliers.27 The measured concentration can thus be considered as an extreme outlier and has therefore been excluded from the FGF‐21 regression analyses. P‐values <0.05 were considered statistically significant. Statistical analyses were performed using SPSS version 22 and RStudio version 1.0.136.
Results
The main characteristics of the study participants are presented in Table 1. Mean (±SD) age across groups was 78.0 (±7.1) years with a male/female ratio of 15/4 in all groups. Patients with HFrEF and cardiac cachexia had lower LVEF (P < 0.001) than the two other groups and elevated biomarkers of inflammation and natriuretic peptides, measured as IL‐6 (P = 0.042), NT‐proBNP (P < 0.001), and MR‐proANP (P < 0.001) (Table 1). No difference in diastolic dysfunction, as assessed by E/e' ratio, was observed between the groups. As expected, body mass index (BMI) (P < 0.001) and total fat mass (P = 0.005) were markedly lower in the group with HFrEF and cardiac cachexia as compared with the two other groups. Lower fat‐free mass was observed among patients with HFrEF and cardiac cachexia (45.4 vs. 49.1 kg in patients with HFrEF without cachexia) although the difference was not statistically significant (P = 0.053 for index). No difference in parameters of glucose metabolism, as assessed by HbA1c or HOMA‐IR, was found among the groups (Table 1). Regarding the diagnostic criteria of cardiac cachexia, the group with cardiac cachexia had a mean (±SD) unintentional weight loss of 9.4 (±0.7) % equal to 6.7 (±0.6) kg within 6 months prior to enrolment.
Table 1.
Characteristics of participants
| HFrEF with cachexia (n = 19) | HFrEF with cachexia (n = 19) | IHD (n = 19) | P‐value | |
|---|---|---|---|---|
| Demographics | ||||
| Sex, F/M | 4/15 | 4/15 | 4/15 | 1.000d |
| Agea, years | 77.3 (6.7) | 78.9 (9.0) | 78.8 (7.2) | 0.760c |
| Smoking, n (%) | 13 (68) | 15 (79) | 14 (74) | 0.480d |
| Metabolism | ||||
| Total cholesterola, mmol/L | 4.2 (0.7) | 4.6 (0.9) | 4.0 (0.9) | 0.059c |
| LDL cholesterola, mmol/L | 2.2 (0.7) | 2.5 (0.8) | 2.2 (0.7) | 0.322c |
| HOMA‐IRb | 1.25 (0.74–2.07) | 1.15 (0.95–2.39) | 1.74 (0.97–2.44) | 0.480d |
| HbA1ca, mmol/L | 5.7 (0.5) | 6.0 (0.3) | 5.8 (0.3) | 0.135c |
| eGFRa, mL/min/1.73 m2 | 64 (20) | 64 (22) | 68 (16) | 0.742c, # |
| U‐Albumin/creatinineb, mg/mmol | 1.1 (0.6–2.3) | 1.0 (0.5–2.2) | 0.5 (0.2–1.7) | 0.086d |
| Cardiac measures | ||||
| HFrEF durationb, months | 12 (11–18) | 24 (15–36) | — | 0.033d |
| NYHA class I/II, n (%) | 17 (89) | 18 (95) | — | 0.310d |
| Ischaemic heart disease, n (%) | 14 (74)* | 17 (89) | 19 (100) | 0.045d |
| Atrial fibrillation, n (%) | 7 (37)* | 5 (26) | 0 | 0.016d |
| Systolic blood pressurea, mmHg | 126 (14)* | 138 (16) | 146 (16) | 0.001c |
| Pulsea, bpm | 70 (14) | 67 (14) | 62 (8) | 0.127c |
| LVEFa, % | 32 (8) | 38 (8) | 60 (9)** | <0.001c |
| E/e' ratioa | 7.22 (2.72) | 10.86 (10.26) | 9.24 (3.41) | 0.227c |
| Body composition | ||||
| BMIa, kg/m2 | 22.3 (2.7)** | 26.1 (3.7) | 26.3 (2.7) | <0.001c |
| Total fat massa, kg | 15.7 (6.8)** | 22.5 (9.0) | 23.9 (7.6) | 0.005c |
| Android fat massa, kg | 4.9 (3.3)** | 9.3 (5.7) | 10.2 (4.9) | 0.002c |
| Gynoid fat massa, kg | 5.4 (3.8) | 8.2 (5.2) | 8.7 (4.8) | 0.070c |
| Total fat‐free massa, kg | 45.4 (5.9) | 49.1 (7.3) | 49.4 (8.3) | 0.179c |
| Biomarkers | ||||
| NT‐proBNPb, ng/L | 2310 (1430–3860)** | 1090 (508–2110) | 423 (140–1100) | <0.001d |
| MR‐proANPb, pmol/L | 364 (316–500)** | 310 (152–394) | 186 (126–308) | <0.001d |
| hsCRPb, mg/L | 1.9 (0.8–3.9) | 1.6 (0.7–4.4) | 0.9 (0.7–2.0) | 0.296d |
| IL‐6b, pg/mL | 5.3 (2.8–6.8)* | 2.8 (2.0–6.9) | 2.6 (1.7–3.6) | 0.042d |
| FGF‐21b, pg/mL | 381 (232–577) | 224 (179–309) | 221 (156–308) | 0.0496d |
| MCP‐1b, pg/mL | 252 (205–310) | 229 (178–291) | 213 (196–251) | 0.345d |
| Medication | ||||
| Loop diuretics, n (%) | 18 (95) | 11 (58) | 2 (11) | 0.001d |
| ACE‐I/ARB, n (%) | 19 (100) | 19 (100) | 11 (58) | 0.001d |
| Beta‐blockers, n (%) | 19 (100) | 16 (84) | 15 (79) | 0.125d |
| Statins, n (%) | 16 (84) | 17 (89) | 19 (100) | 0.220d |
BMI, body mass index; eGFR, estimated glomerular filtration rate; E/e' ratio, early diastolic transmitral flow velocity/early diastolic mitral annular velocity; FGF‐21, fibroblast growth factor 21; HFrEF, heart failure with reduced ejection fraction; HOMA‐IR, homeostatic model assessment of insulin resistance; HbA1c, haemoglobin A1c; hsCRP, high sensitive C‐reactive protein; IHD, ischaemic heart disease; IL‐6, interleukin 6; LDL, low‐density lipoprotein; LVEF, left ventricle ejection fraction; MR‐proANP, mid‐regional pro‐atrial natriuretic peptide; MCP‐1, monocyte chemoattractant protein 1; NYHA, New York Heart Association; NT‐proBNP, N‐terminal pro‐brain natriuretic peptide.
Mean (SD).
Median (inter quantile range).
One‐way ANOVA
χ2/Kruskal–Wallis test.
P = 0.645 when calculated by the CKD‐EPI equation.
Different from the IHDgroup in pairwise comparisons (P<0.05).
Different from the two other groups in pairwise comparisons (P<0.05).
Fibroblast growth factor 21 and clinical characteristics of cardiac cachexia
Plasma FGF‐21 levels were elevated in patients with HFrEF and cardiac cachexia median (inter quantile range) 381 (232–577) pg/mL, as compared with patients with HFrEF without cachexia 224 (179–309) pg/mL and IHD patients 221 (156–308) pg/mL (P = 0.0496) (Table 1 and Figure 1 A). FGF‐21 (log2) was associated with increased IL‐6 (log2) (B = 0.454, P = 0.001) and with reduced fat‐free mass (B = –0.047, P = 0.006) (Figure 2 and Supporting Information, Table S1 ). There were no relations between FGF‐21 and cardiac function measured by LVEF (P = 0.165), E/e' ratio (P = 0.402), NYHA class (P = 0.274), or NT‐proBNP (log2) (P = 0.087) across groups (Supporting Information, Table S1 ). Notably, the high levels of FGF‐21 showed no association with impaired kidney function, as assessed by eGFR. With regard to lipid and glucose metabolism, FGF‐21 was univariate associated with total cholesterol (P = 0.017), whereas no associations with glucose metabolism, as assessed by HbA1c or HOMA‐IR, were found (HbA1c: P = 0.088, HOMA‐IR: P = 0.906) (Supporting Information, Table S1 ). After correction for multiple testing of the univariate regression analyses, only IL‐6 remained significantly univariate associated with FGF‐21 (Supporting Information, Table S1 ). The predictors of increased FGF‐21 levels were further evaluated in a multivariable linear regression model. In this model, higher IL‐6 (P = 0.015) and total cholesterol (P = 0.010), and lower fat‐free mass (P = 0.043) and HbA1c (P = 0.041) were independently associated with FGF‐21. No predictive value of NT‐proBNP was found (P = 0.993) (Table 2).
Figure 1.
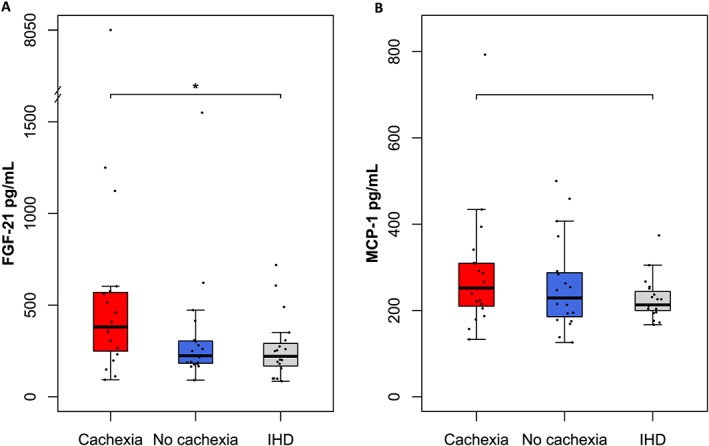
Plasma levels of FGF‐21 (A) and MCP‐1 (B) according to groups. (A) FGF‐21 levels were higher in patients with HFrEF and cardiac cachexia, as compared with patients with HFrEF without cachexia and patients with IHD (P = 0.0496). (B) No difference in MCP‐1 levels was found between the groups (P = 0.345). Range bars representing minimum and maximum value (outliers excluded). FGF‐21, fibroblast growth factor 21; IHD, ischaemic heart disease; MCP‐1, monocyte chemoattractant protein 1.
Figure 2.
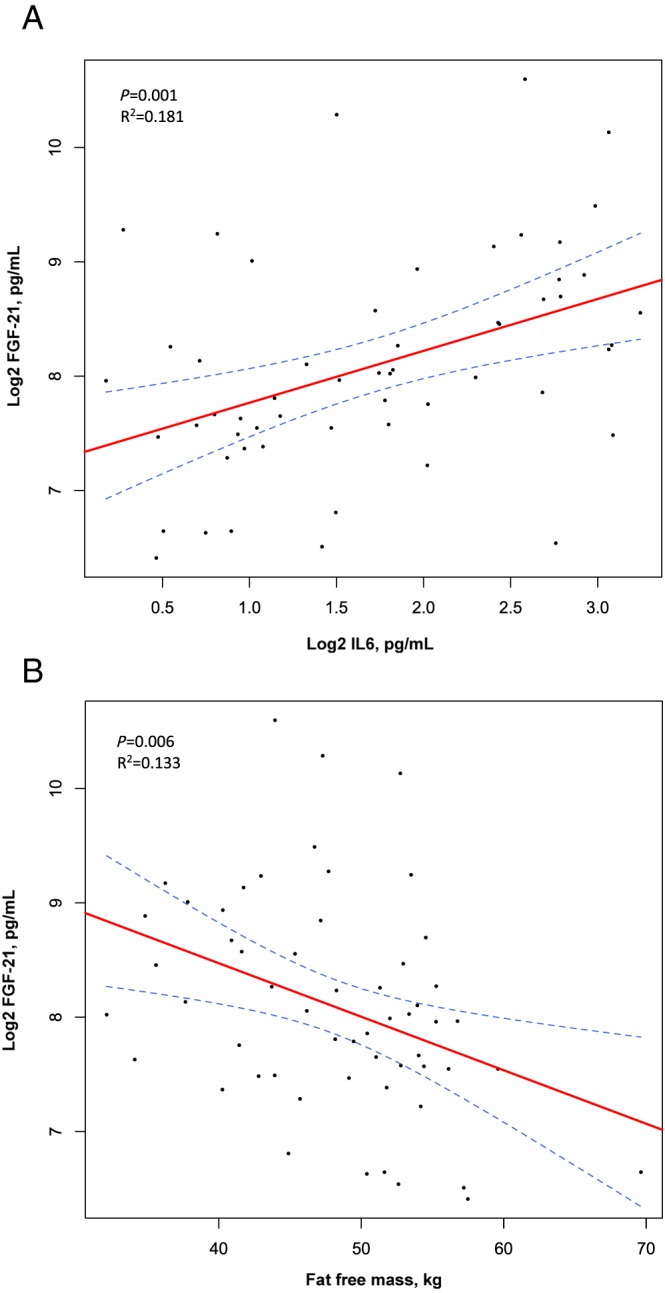
Scatter plots and regression lines with 95% confidence interval bands representing associations between FGF‐21 and IL‐6 (A) and fat‐free mass (B). FGF‐21 (log2) was univariate associated with inflammation biomarker IL‐6 (log2) (A) and reduced fat‐free mass (B). FGF‐21, fibroblast growth factor 21; IL‐6, interleukin 6; log2, logarithm 2.
Table 2.
Multivariable linear regression analyses assessing predictors of FGF‐21 and MCP‐1
| FGF‐21a, pg/mL | MCP‐1a, pg/mL | |||
|---|---|---|---|---|
| B (95% CI) | P‐value | B (95% CI) | P‐value | |
| Sex | –0.654 (–1.418; 0.110) | 0.092 | –0.038 (–0.375; 0.298) | 0.820 |
| Age, years | –0.022 (–0.056; 0.012) | 0.199 | 0.009 (–0.010; 0.028) | 0.344 |
| HD | — | — | –0.272 (–0.632; 0.088) | 0.135 |
| Metabolism | ||||
| Total cholesterol, mmol/L | 0.379 (0.094; 0.664) | 0.010 | 0.189 (0.052; 0.325) | 0.008 |
| HbA1c, mmol/L | –0.616 (–1.205; –0.027) | 0.041 | 0.250 (–0.054; 0.554) | 0.105 |
| eGFR, mL/min/1.73 m2 | — | — | –0.008 (–0.014; –0.002) | 0.011 |
| Body composition | ||||
| Total fat‐free mass, kg | –0.045 (–0.088; –0.001) | 0.043 | — | — |
| Total fat mass, kg | — | — | –0.022 (–0.036; –0.009) | 0.002 |
| Biomarkers | ||||
| IL‐6a, pg/mL | 0.315 (0.063; 0.567) | 0.015 | — | — |
| NT‐proBNPa, ng/L | –0.001 (–0.151; 0.149) | 0.993 | — | — |
B (95% CI), unstandardized regression coefficient (95% confidence interval); FGF‐21, fibroblast growth factor 21; HbA1c, haemoglobin A1c; IHD, ischaemic heart disease; IL‐6, interleukin 6; MCP‐1, monocyte chemoattractant protein 1; NT‐proBNP, N‐terminal pro‐brain natriuretic peptide.
Logarithm 2 transformed.
Monocyte chemoattractant protein 1 levels and clinical characteristics of cardiac cachexia
No difference in plasma MCP‐1 levels was found among the groups (P = 0.345) (Table 1 and Figure 1 B). Impaired kidney function, as assessed by eGFR (P = 0.014), HbA1c (P = 0.016), and lower total fat mass (P = 0.023), was univariate associated with MCP‐1 (log2) (Supporting Information, Table S1 ). MCP‐1 showed no relations to cardiac function, inflammation, or muscle wasting (Supporting Information, Table S1 ), although a trend towards an inverse association with IHD was observed (P = 0.057). After correction for multiple testing of the univariate regression analyses, no variables remained significantly univariate associated with MCP‐1 (Supporting Information, Table S1 ). In a multivariable linear regression analysis adjusted for sex and age, MCP‐1 (log2) was independently associated with total cholesterol (P = 0.008) and inversely associated with total fat mass (P = 0.002) and eGFR (P = 0.011) (Table 2).
Discussion
The main findings of the present study are that plasma FGF‐21 levels are elevated in patients with HFrEF and cardiac cachexia, as compared with patients with HFrEF without cardiac cachexia and patients with IHD. Higher FGF‐21 levels were independently associated with increased inflammation and with muscle wasting, as assessed by IL‐6 and fat‐free mass. Furthermore, an independent association with total cholesterol and lower HbA1c levels was found. No relationships between MCP‐1 and cardiac function or the presence of cardiac cachexia were observed.
We found no association between FGF‐21 and impaired cardiac function, as assessed by NYHA class, LVEF, E/e' ratio, or NT‐proBNP. Only a limited number of studies describe the clinical significance of FGF‐21 in HF. Planavila et al.28 found increased myocardial expression of FGF‐21 in failing human hearts, and an association of circulating FGF‐21 levels and left ventricular systolic dysfunction has been reported.10 Furthermore, circulating FGF‐21 levels have been linked with diastolic dysfunction in patients with HF with preserved ejection fraction .29 Although observing comparable FGF‐21 levels in the present study, our data did not support an association between FGF‐21 and systolic or diastolic dysfunction in patients with HFrEF, as assessed by LVEF and E/e' ratio. This discrepancy could be a power issue, as our sample size was smaller than the previous HF studies conducted, or be due to the difference in study population, as we only enrolled patients with HFrEF.
We are, to the best of our knowledge, the first to report elevated FGF‐21 levels in patients with cardiac cachexia and to suggest a possible mechanism of increased inflammation, as we found an independent association with the well‐established inflammatory biomarker IL‐6. The present clinical findings are supported by experimental studies, where increased FGF‐21 expression has been reported in response to inflammation.30 Further, increased FGF‐21 levels are present in sepsis with subsequent decreasing FGF‐21 levels with clinical remission.12 Thus, the present study suggests that the elevated FGF‐21 levels in HFrEF and cardiac cachexia are mediated by the increased inflammation rather than impaired cardiac function.
We found an independent association between elevated FGF‐21 levels and lower fat‐free mass, thus indicating a link with muscle wasting. Our findings are supported by several studies in patients with mitochondrial disease, including myopathy, where circulating FGF‐21 is associated with low BMI and muscle weakness, a significant symptom of muscle wasting.13, 31 In mice, FGF‐21 activates the SIRT I/AMPK/PGC‐α signalling pathway favouring the transition of larger anaerobe myofibers into smaller aerobic myofibers.32 Because hepatic FGF‐21 expression is elevated in the fasted state,33 the authors suggest FGF‐21 as a possible explanation of the muscle atrophy seen in conditions with fasting.32 Anorexia being a significant symptom of cardiac cachexia,4 decreased energy intake could be a possible mechanism behind the association between FGF‐21 and muscle wasting observed in the present study.
Notably, as FGF‐21 showed no association with NT‐proBNP, it may bear clinical implications as a biomarker in predicting cardiac cachexia in combination with natriuretic peptides. Currently, cardiac cachexia is first diagnosable after significant weight loss and muscle wasting have occurred, making it difficult to revers or slow down the wasting process with only limited treatment available.34 As cardiac cachexia effects up to 20% of patients with HFrEF, new diagnostic approaches are urgent.2, 3 Several new biomarkers in cachexia are investigated, including TGF‐ß and IL‐8.35 FGF‐21 emerges as a promising novel biomarker in various diseases with cachexia. Increased FGF‐21 levels have recently been reported in geriatric patients with cachexia, as compared with geriatric patients without cachexia. FGF‐21 was correlated with weight loss and anorexia, although the impact of sarcopenia was not assessed.36 Further, increased FGF‐21 levels are also reported in patients with renal cancer, as compared with healthy controls37, and in end‐stage kidney disease, where high FGF‐21 is associated with impaired outcome.38 We found increased FGF‐21 levels in patients with cardiac cachexia, as well as associations between FGF‐21 and the central cardiac cachexia disorders, chronic inflammation, and muscle wasting. Therefore, FGF‐21 could have potential as a diagnostic biomarker in predicting HF patients with high risk of cardiac cachexia. Larger prospective studies are warranted to assess the clinical significance of FGF‐21 as a diagnostic biomarker in HF and cardiac cachexia.
Previous studies have shown that circulating FGF‐21 levels are associated with dyslipidemia and insulin resistance in patients with obesity.39 We, however, found no association with insulin resistance or fat mass, although an association with total cholesterol was observed. Zhang et al.39 found the association between FGF‐21 and insulin resistance was eliminated when adjusting for BMI. As our study population mostly consisted of non‐obese cardiac patients, this could explain the lack of relationship between FGF‐21 and insulin resistance. Further, Zhang et al. only evaluated BMI, and not body composition, why the role of sarcopenia in the elevated FGF‐21 levels reported in insulin resistance cannot be assessed. We did, however, find an inverse association with HbA1c. FGF‐21 stimulates glucose uptake in adipose tissue in a dose dependent manner.40 The elevated FGF‐21 levels in HFrEF and cardiac cachexia may therefore have lowered blood glucose levels explaining the inverse association between FGF‐21 and HbA1c.
The available literature is inconsistent with regard to the effect of MCP‐1 in CHF, as both increased and decreased cardiac expression of MCP‐1 have been reported in failing human hearts.17, 18 Regarding circulating MCP‐1, an association between MCP‐1 levels and NYHA class has been reported in patients with HFrEF and HF with preserved ejection fraction.16 We could not demonstrate increased MCP‐1 levels in patients with HFrEF with or without cardiac cachexia as compared with IHD and normal LVEF. Therefore, the value of MCP‐1 as a biomarker in HFrEF or cardiac cachexia is questionable.
The current study has several limitations. The sample size was relatively small, and the cross‐sectional design limits analysis of causality. We chose to have equal class sizes, which may have decreased the power of the statistical methods; furthermore, only patients with signed informed consent were allowed in the study analyses. We did not collect data on statin doses. Although there was no difference in the number of patients receiving statins between the groups, the influence of possible higher statin doses in the IHD group cannot be assessed. We excluded HF patients with preserved ejection fraction, why our findings may not apply for these patients. Larger studies are needed to confirm the association of FGF‐21 and cardiac cachexia.
Conclusions
In conclusion, elevated FGF‐21 levels are present in patients with HFrEF and cardiac cachexia. We found no association between MCP‐1 and cardiac function or cardiac cachexia. The present study suggests that the elevated FGF‐21 levels in cardiac cachexia are mediated by increased inflammation and muscle wasting rather than impaired cardiac function. FGF‐21 could, therefore, bear clinical implications in predicting muscle wasting in cardiac cachexia.
Conflict of interest
None declared.
Funding
This work was supported by the Research Council of Copenhagen University Hospitals, Herlev and Gentofte, Denmark, and the A.P. Moeller Foundation for the Advancement of Medical Science, Denmark.
Supporting information
Table S1. Univariate linear regression analyses.
Refsgaard Holm, M. , Christensen, H. , Rasmussen, J. , Johansen, M. L. , Schou, M. , Faber, J. , and Kistorp, C. (2019) Fibroblast growth factor 21 in patients with cardiac cachexia: a possible role of chronic inflammation. ESC Heart Failure, 6, 983–991. 10.1002/ehf2.12502.
References
- 1. Anker SD, Ponikowski P, Varney S, Chua TP, Clark AL, Webb‐Peploe KM, Harrington D, Kox WJ, Poole‐Wilson PA, Coats AJS. Wasting as independent risk factor for mortality in chronic heart failure. Lancet 1997; 349: 1050–1053. [DOI] [PubMed] [Google Scholar]
- 2. Christensen HM, Kistorp C, Schou M, Keller N, Zerahn B, Frystyk J, Schwarz P, Faber J. Prevalence of cachexia in chronic heart failure and characteristics of body composition and metabolic status. Endocrine 2013; 43: 626–634. [DOI] [PubMed] [Google Scholar]
- 3. von Haehling S, Anker MS, Anker SD. Prevalence and clinical impact of cachexia in chronic illness in Europe, USA, and Japan: facts and numbers update 2016. J Cachexia Sarcopenia Muscle 2016; 7: 507–509. [DOI] [PMC free article] [PubMed] [Google Scholar]
- 4. Saitoh M, Dos Santos MR, Emami A, Ishida J, Ebner N, Valentova M, Bekfani T, Sandek A, Lainscak M, Doehner W, Anker SD. Anorexia, functional capacity, and clinical outcome in patients with chronic heart failure: results from the studies investigating co‐morbidities aggravating heart failure (SICA‐HF). ESC Heart Fail 2017; 4: 448–457. [DOI] [PMC free article] [PubMed] [Google Scholar]
- 5. Anker SD, Ponikowski PP, Clark AL, Leyva F, Rauchhaus M, Kemp M, Teixeira MM, Hellewell PG, Hooper J, Poole‐Wilson PA, Coats AJ. Cytokines and neurohormones relating to body composition alterations in the wasting syndrome of chronic heart failure. Eur Heart J 1999; 20: 683–693. [DOI] [PubMed] [Google Scholar]
- 6. Szabo T, von Haehling S, Habedank D, Rauchhaus M, Lainscak M, Sandek A, Schefold J, Anker SD, Doehner W. Usefulness of minimal modelling to assess impaired insulin sensitivity in patients with chronic heart failure. Int J Cardiol 2011; 147: 47–51. [DOI] [PubMed] [Google Scholar]
- 7. Josiak K, Jankowska EA, Piepoli MF, Banasiak W, Ponikowski P. Skeletal myopathy in patients with chronic heart failure: significance of anabolic‐androgenic hormones. J Cachexia Sarcopenia Muscle 2014; 5: 287–296. [DOI] [PMC free article] [PubMed] [Google Scholar]
- 8. Ogawa Y, Kurosu H, Yamamoto M, Nandi A, Rosenblatt KP, Goetz R, Eliseenkova AV, Mohammadi M, Kuro‐o M. BetaKlotho is required for metabolic activity of fibroblast growth factor 21. Proc Natl Acad Sci U S A 2007; 104: 7432–7437. [DOI] [PMC free article] [PubMed] [Google Scholar]
- 9. Planavila A, Redondo I, Hondares E, Vinciguerra M, Munts C, Iglesias R, Gabrielli LA, Sitges M, Giralt M, Van Bilsen M, Villarroya F. Fibroblast growth factor 21 protects against cardiac hypertrophy in mice. Nat Commun 2013; 4: 2019. [DOI] [PubMed] [Google Scholar]
- 10. Shen Y, Zhang X, Pan X, Xu Y, Xiong Q, Lu Z, Ma X, Bao Y, Jia W. Contribution of serum FGF21 level to the identification of left ventricular systolic dysfunction and cardiac death. Cardiovasc Diabetol 2017; 16: 106. [DOI] [PMC free article] [PubMed] [Google Scholar]
- 11. Ong KL, Januszewski AS, O'Connell R, Jenkins AJ, Xu A, Sullivan DR, Barter PJ, Hung WT, Scott RS, Taskinen MR, Keech AC. The relationship of fibroblast growth factor 21 with cardiovascular outcome events in the Fenofibrate Intervention and Event Lowering in Diabetes Study. Diabetologia 2015; 58: 464–473. [DOI] [PubMed] [Google Scholar]
- 12. Gariani K, Drifte G, Dunn‐Siegrist I, Pugin J, Jornayvaz FR. Increased FGF21 plasma levels in humans with sepsis and SIRS. Endocr Connect 2013; 2: 146–153. [DOI] [PMC free article] [PubMed] [Google Scholar]
- 13. Davis RL, Liang C, Edema‐Hildebrand F, Riley C, Needham M, Sue CM. Fibroblast growth factor 21 is a sensitive biomarker of mitochondrial disease. Neurology 2013; 81: 1819–1826. [DOI] [PubMed] [Google Scholar]
- 14. Devaux B, Scholz D, Hirche A, Klovekorn WP, Schaper J. Upregulation of cell adhesion molecules and the presence of low grade inflammation in human chronic heart failure. Eur Heart J 1997; 18: 470–479. [DOI] [PubMed] [Google Scholar]
- 15. Charo IF, Ransohoff RM. The many roles of chemokines and chemokine receptors in inflammation. N Engl J Med 2006; 354: 610–621. [DOI] [PubMed] [Google Scholar]
- 16. Aukrust P, Ueland T, Muller F, Andreassen AK, Nordoy I, Aas H, Kjekshus J, Simonsen S, Frøland SS, Gullestad L. Elevated circulating levels of C‐C chemokines in patients with congestive heart failure. Circulation 1998; 97: 1136–1143. [DOI] [PubMed] [Google Scholar]
- 17. Damas JK, Eiken HG, Oie E, Bjerkeli V, Yndestad A, Ueland T, Tønnessen T, Geiran OR, Aass H, Simonsen S, Christensen G. Myocardial expression of CC‐ and CXC‐chemokines and their receptors in human end‐stage heart failure. Cardiovasc Res 2000; 47: 778–787. [DOI] [PubMed] [Google Scholar]
- 18. Satoh M, Akatsu T, Ishkawa Y, Minami Y, Nakamura M. A novel activator of C‐C chemokine, FROUNT, is expressed with C‐C chemokine receptor 2 and its ligand in failing human heart. J Card Fail 2007; 13: 114–119. [DOI] [PubMed] [Google Scholar]
- 19. Anker SD, Negassa A, Coats AJ, Afzal R, Poole‐Wilson PA, Cohn JN, Yusuf S. Prognostic importance of weight loss in chronic heart failure and the effect of treatment with angiotensin‐converting‐enzyme inhibitors: an observational study. Lancet 2003; 361: 1077–1083. [DOI] [PubMed] [Google Scholar]
- 20. Pocock SJ, McMurray JJ, Dobson J, Yusuf S, Granger CB, Michelson EL, Östergren J, Pfeffer MA, Solomon SD, Anker SD, Swedberg KB. Weight loss and mortality risk in patients with chronic heart failure in the candesartan in heart failure: assessment of reduction in mortality and morbidity (CHARM) programme. Eur Heart J 2008; 29: 2641–2650. [DOI] [PubMed] [Google Scholar]
- 21. Lundsgaard AM, Fritzen AM, Sjoberg KA, Myrmel LS, Madsen L, Wojtaszewski JF, Richter EA, Kiens B. Circulating FGF21 in humans is potently induced by short term overfeeding of carbohydrates. Mol Metab 2017; 6: 22–29. [DOI] [PMC free article] [PubMed] [Google Scholar]
- 22. Murabito JM, Keyes MJ, Guo CY, Keaney JF Jr, Vasan RS, D'Agostino RB Sr, Benjamin EJ. Cross‐sectional relations of multiple inflammatory biomarkers to peripheral arterial disease: the Framingham Offspring Study. Atherosclerosis 2009; 203: 509–514. [DOI] [PMC free article] [PubMed] [Google Scholar]
- 23. Matthews DR, Hosker JP, Rudenski AS, Naylor BA, Treacher DF, Turner RC. Homeostasis model assessment: insulin resistance and beta‐cell function from fasting plasma glucose and insulin concentrations in man. Diabetologia 1985; 28: 412–419. [DOI] [PubMed] [Google Scholar]
- 24. Levey AS, Bosch JP, Lewis JB, Greene T, Rogers N, Roth D. A more accurate method to estimate glomerular filtration rate from serum creatinine: a new prediction equation. Modification of Diet in Renal Disease Study Group. Ann Intern Med 1999; 130: 461–470. [DOI] [PubMed] [Google Scholar]
- 25. Laskey MA. Dual‐energy X‐ray absorptiometry and body composition. Nutrition 1996; 12: 45–51. [DOI] [PubMed] [Google Scholar]
- 26. Benjamini Y, Hochberg Y. Controlling the false discovery rate: a practical and powerful approach to multiple testing. J R Stat Soc Ser B 1995; 57: 289–300. [Google Scholar]
- 27. Altman NK, M. Analyzing outliers: Influential or nuisance? Nat Methods 2016; 13: 281–282. [DOI] [PubMed] [Google Scholar]
- 28. Planavila A, Redondo‐Angulo I, Ribas F, Garrabou G, Casademont J, Giralt M, Villarroya F. Fibroblast growth factor 21 protects the heart from oxidative stress. Cardiovasc Res 2015; 106: 19–31. [DOI] [PubMed] [Google Scholar]
- 29. Chou RH, Huang PH, Hsu CY, Chang CC, Leu HB, Huang CC, Chen JW, Lin SJ. Circulating fibroblast growth factor 21 is associated with diastolic dysfunction in heart failure patients with preserved ejection fraction. Sci Rep 2016; 6: 33953. [DOI] [PMC free article] [PubMed] [Google Scholar]
- 30. Feingold KR, Grunfeld C, Heuer JG, Gupta A, Cramer M, Zhang T, Shigenaga JK, Patzek SM, Chan ZW, Moser A, Bina H, Kharitonenkov A. FGF21 is increased by inflammatory stimuli and protects leptin‐deficient ob/ob mice from the toxicity of sepsis. Endocrinology 2012; 153: 2689–2700. [DOI] [PMC free article] [PubMed] [Google Scholar]
- 31. Fulster S, Tacke M, Sandek A, Ebner N, Tschope C, Doehner W, Anker SD, Von Haehling S. Muscle wasting in patients with chronic heart failure: results from the studies investigating co‐morbidities aggravating heart failure (SICA‐HF). Eur Heart J 2013; 34: 512–519. [DOI] [PubMed] [Google Scholar]
- 32. Liu X, Wang Y, Hou L, Xiong Y, Zhao S. Fibroblast growth factor 21 (FGF21) promotes formation of aerobic myofibers via the FGF21‐SIRT1‐AMPK‐PGC1α pathway. J Cell Physiol 2017; 232: 1893–1906. [DOI] [PubMed] [Google Scholar]
- 33. Antonellis PJ, Hayes MP, Adams AC. Fibroblast growth factor 21‐null mice do not exhibit an impaired response to fasting. Front Endocrinol (Lausanne) 2016; 7: 77. [DOI] [PMC free article] [PubMed] [Google Scholar]
- 34. Okoshi MP, Capalbo RV, Romeiro FG, Okoshi K. Cardiac cachexia: perspectives for prevention and treatment. Arq Bras Cardiol 2017; 108: 74–80. [DOI] [PMC free article] [PubMed] [Google Scholar]
- 35. Alves MJ, Figueredo RG, Azevedo FF, Cavallaro DA, Neto NI, Lima JD, Matos‐Neto E, Radloff K, Riccardi DM, Camargo RG, De Alcântara PS. Adipose tissue fibrosis in human cancer cachexia: the role of TGFβ pathway. BMC Cancer 2017; 17: 190. [DOI] [PMC free article] [PubMed] [Google Scholar]
- 36. Franz K, Ost M, Otten L, Herpich C, Coleman V, Endres AS, Klaus S, Müller‐Werdan U, Norman K. Higher serum levels of fibroblast growth factor 21 in old patients with cachexia. Nutrition. 2019; 63‐64: 81‐86. [DOI] [PubMed] [Google Scholar]
- 37. Knott ME, Minatta JN, Roulet L, Gueglio G, Pasik L, Ranuncolo SM, Nuñez M, Puricelli L, De Lorenzo MS. Circulating fibroblast growth factor 21 (Fgf21) as diagnostic and prognostic biomarker in renal cancer. J Mol Biomark Diagn 2016; 1: 015. [DOI] [PMC free article] [PubMed] [Google Scholar]
- 38. Kohara M, Masuda T, Shiizaki K, Akimoto T, Watanabe Y, Honma S, Sekiguchi C, Miyazawa Y, Kusano E, Kanda Y, Asano Y, Kuro‐o M, Nagata D. Association between circulating fibroblast growth factor 21 and mortality in end‐stage renal disease. PLoS One 2017; 12: e0178971. [DOI] [PMC free article] [PubMed] [Google Scholar]
- 39. Zhang X, Yeung DC, Karpisek M, Stejskal D, Zhou ZG, Liu F, Wong RL, Chow WS, Tso AW, Lam KS, Xu A. Serum FGF21 levels are increased in obesity and are independently associated with the metabolic syndrome in humans. Diabetes 2008; 57: 1246–1253. [DOI] [PubMed] [Google Scholar]
- 40. Kharitonenkov A, Shiyanova TL, Koester A, Ford AM, Micanovic R, Galbreath EJ, Sandusky GE, Hammond LJ, Moyers JS, Owens RA, Gromada J, Brozinick JT, Hawkins ED, Wroblewski VJ, Li DS, Mehrbod F, Jaskunas SR, Shanafelt AB. FGF‐21 as a novel metabolic regulator. J Clin Invest 2005; 115: 1627–1635. [DOI] [PMC free article] [PubMed] [Google Scholar]
Associated Data
This section collects any data citations, data availability statements, or supplementary materials included in this article.
Supplementary Materials
Table S1. Univariate linear regression analyses.