Abstract
We measured the end-to-end diffusion coefficient of an alkyl chain-linked donor–acceptor pair using the time-resolved frequency-domain decay of the donor. The donor was a rhenium metal–ligand complex with a mean decay time ranging from 2.1 to 7.9 μs in the absence of the Texas red acceptor. The decay time was used to measure the donor-to-acceptor distance distribution and the mutual diffusion coefficient. Using this long lifetime donor, it was easily possible to determine a diffusion coefficient near 2 × 10⁻⁸ cm2/s and diffusion coefficients as low as 1.3 × 10⁻⁹ cm2/s were measurable. Such long lifetime donors should be valuable for measuring the flexing of peptides on the microsecond timescale, domain motions of proteins and lateral diffusion in membranes. The availability of microsecond decay time luminophores now allows luminescence spectroscopy to be useful generally for studies of microsecond dynamics of biological macromolecules.
INTRODUCTION
There is considerable interest in measuring the dynamic properties of proteins and other biological macromolecules (1–3). Fluorescence spectral parameters are typically sensitive to nanosecond (ns) processes because of the ns decay time of most fluorophores. Consequently, time-resolved fluorescence has been used extensively to study the ns dynamics of proteins (4), membranes (5) and nucleic acids (6). However, many processes of biological interest occur on a slower microsecond (μs) timescale. For instance, the lateral diffusion coefficients of lipids in model membranes have been reported to be in the range of 1–10 × 10−8 cm2/s (7,8). An estimated diffusion coefficient of 5 × 10⁻⁸ cm2/s for lipids in membranes (Δx2 = 4Dτ) results in displacement () of 30Å during 1 μs. Such diffusion coefficients will not affect the decay times of ns donors in membranes. As a second example, domain motions in proteins appear to be important for catalysis, signaling and regulation (9–11). However, attempts to use resonance energy transfer (RET)† to quantify the rates of domain motions have been largely unsuccessful (12). The RET between labeled subunits was used to measure the distribution of distances between two sites on phosphoglycerate kinase (13). The time-domain data revealed a range of distances, but the data provided no information on the rate of interchange between the distances.
Several approaches are available to circumvent the ns timescale limits of fluorescence. These include the use of phosphorescence (14), fluorescence recovery after photo-bleaching (FRAP) (15), polarized photobleaching (16) and the use of lanthanides with ms decay times (17). However, relatively few probes such as eosin display useful phosphorescence in aqueous solution. The use of phosphorescence typically requires the complete exclusion of oxygen. Polarized photobleaching and FRAP require somewhat intense illumination to photobleach the probes, and there has been controversy about interpretation of the FRAP data. The lanthanides display millisecond (ms) lifetimes that are due to forbidden transitions between shielded atomic orbitals. These lifetimes are not sensitive to the local environment and are not easily changed to the μs timescale. In many cases the ms decay times result in complete spatial averaging—the rapid diffusion limit (18,19)—with loss of information of motions on the μs timescale. As an overall conclusion, fluorescence is presently not useful on the μs time-scale and is less than optimal on the ms timescale.
In the present report we describe a new approach to measurement of μs dynamics using fluorescence. During the past 5 years we have characterized a number of transition metal–ligand complexes (MLC) for use as luminescent probes (20–23). The emission from these complexes is due to a mixed singlet–triplet state, so it may be more proper to refer to the emission as luminescence. A favorable property of these complexes is that the decay times are typically on the μs timescale, with decay times ranging from 100 ns to 10 μs (24). We now describe the use of these MLC probes to measure slow end-to-end diffusion in a covalently linked donor (D)–acceptor (A) pair. These measurements serve as a model for future measurements of μs motions in proteins and membranes using the MLC probes.
MATERIALS AND METHODS
The Re(CO)5Cl, 5,6-dimethyl-1,10-phenanthroline (5,6-dmphen), isonicotinic acid (py-COOH), silver perchlorate, N-hydroxysuccinimide (NHS), dicyclohexylcarboxydiimide (DCC), toluene, dichloromethane, acetonitrile and methanol were obtained from Aldrich and were used as received without further purification. Texas red (Tr) succimidyl ester was obtained from Molecular Probes and was used without further purification. The Re(5,6-dmphen)(CO)3(py-COOH)ClO4 was synthesized according to the literature procedure (25).
Synthesis of Re(5,6-dmphen)(CO)3(py-CONH(CH2)12NH2 ClO4.
To0.185 g of Re(5,6-dmphen)(CO)3(py-COOH)ClO4 in 50 mL of dichloromethane, 0.04 g of NHS and 0.06 g of DCC were added and stirred for 24 h. The resultant solution of the Re-NHS ester was filtered and 0.30 g of 1,12-diaminododecane was added and further stirred for 24 h. The solution obtained was filtered and vacuum dried to yield Re(5,6-dmphen)(CO)3(py-CONH(CH2)12NH2ClO4.
Synthesis of Re(5,6-dmphen)(CO)3(py-CONH[CH2]12NH[CH2]5NHTr)ClO4 (D–A pair).
To 0.027 g of Re(5,6-dmphen)(CO)3(py-CONH[CH2]12 NH2)ClO4 in 25 mL of dichloromethane, 5 mg of Tr succimidyl ester was added and stirred in the dark for 24 h. The resulting solution was dried under vacuum and purified on a PF6K silica TLC plate using CH3CN/CH3OH/NH4OH (3:1:04, vol/vol/vol) as eluent. The pure product was extracted from the TLC plate using methanol and then vacuum dried to obtain the D–A pair.
Fluorescent measurements.
Frequency-domain (FD) intensity decays were measured and analyzed as described previously (26). The excitation wavelength was 325 nm using a HeCd laser, and the donor emission was selected using a 540 nm interference filter, 10 nm bandpass. Intensity decays were measured using magic angle conditions. All solutions were in propylene glycol that was in equilibrium with air.
The FD decays were fit to the multiexponential model
| (1) |
where αi are the time-zero amplitudes and τi the decay times. The data for the D–A pair were also fit to the distance-distribution model in which the D and A do not move during the excited-state lifetime (27,28)
| (2) |
where σ is the standard deviation of the D-to-A distance distribution and RAV is the central distance. The standard deviation is related to the half width of the distance distribution by HW = 2.354σ. The data were further fit to this Gaussian distance distribution with a mutual D-to-A diffusion coefficient D. The expressions that describe the predicted intensity decays with a multiexponential donor decay are somewhat complex and have been described elsewhere in detail (29,30).
RESULTS
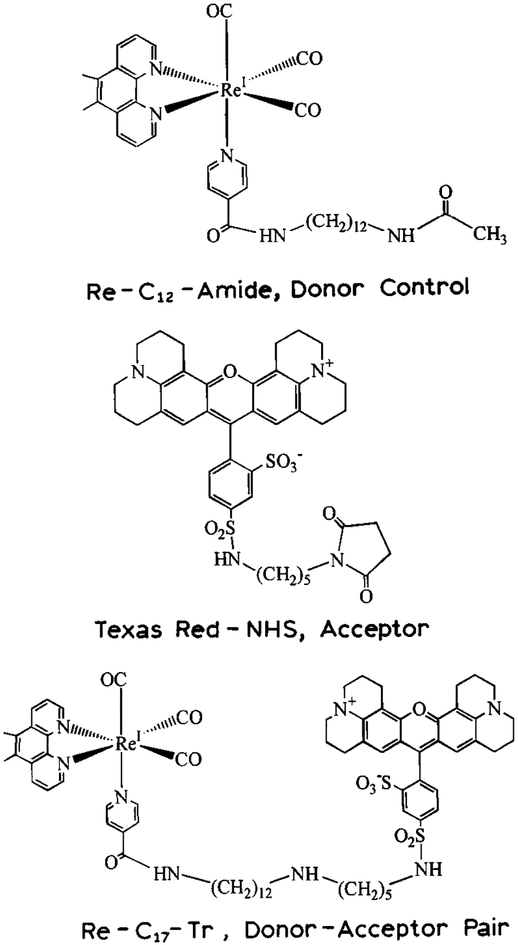
The D, A and D–A pair are shown in Scheme 1. The D-alone control molecule is a rhenium (Re) MLC linked to a C12 chain terminated as an amide. This Re-MLC D and Tr A were covalently linked with a spacer equivalent to 17 methylene groups and 5 nitrogen–carbon bonds (lower structure).
Scheme 1.
Donor, acceptor and donor–acceptor pair (top to bottom) used to study slow end-to-end diffusion.
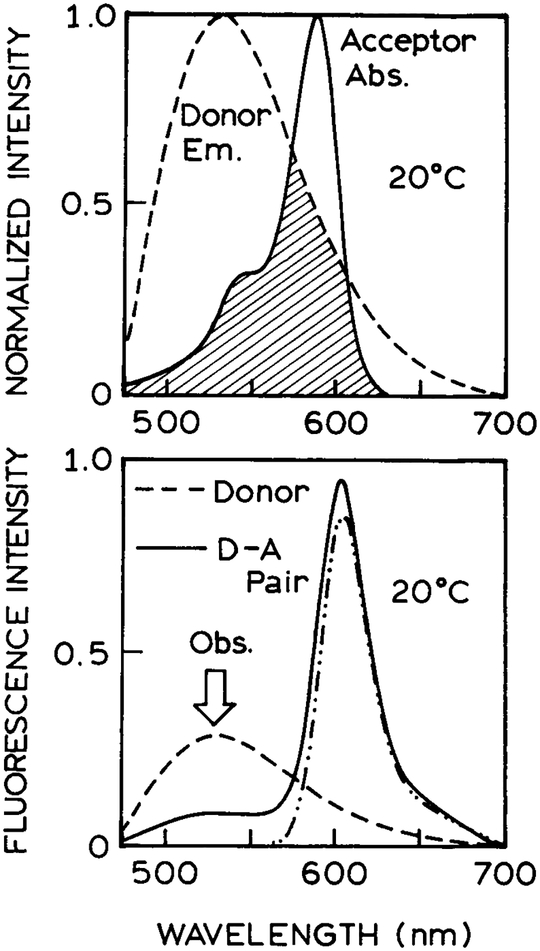
The emission spectrum of the Re-MLC overlaps with the absorption spectra of the Tr A (Fig. 1, top). The Förster distance (R0) was calculated as usual (31) and found to range from 35.5Å at 20°C to 43.7Å at −20°C, where the changes are due mostly to the temperature-dependent quantum yield of the Re-MLC D. An important property of the Re-MLC D is its long decay time (Table 1). The mean D-alone decay time ranges from 2.15 μs at 20°C to 7.44 μs at −20°C. Hence this D should be sensitive to D-to-A diffusion on a similar timescale.
Figure 1.
Spectral overlap of the Re-MLC donor emission (— — —) with the Tr acceptor absorption (—). The lower panel shows the emission spectra of the Re-MLC donor (— — —), the Tr acceptor (—•• —•• —) and of the covalently linked D–A pair (——). In this D–A pair the donor emission at 530 nm is quenched and there is a small enhancement of the acceptor emission. All spectra are in propylene glycol at 20°C.
Table 1.
Multiexponential intensity decay analysis for the Re-MLC donor and for the D–A pair
| Samples | °C | (μs)* | τi (μs) | αi | fi† | |
|---|---|---|---|---|---|---|
| Re-MLC-C12-amide | 20 | 2.15 | 2.20 | 0.75 | 0.97 | 1.3 |
| Donor | 0.17 | 0.25 | 0.03 | |||
| −20 | 7.44 | 7.62 | 0.89 | 0.97 | 0.7 | |
| 1.88 | 0.11 | 0.03 | ||||
| Re-MLC-C17Tr | 20 | 1.55 | 2.13 | 0.12 | 0.70 | 0.8 |
| D—A pair | 0.31 | 0.22 | 0.18 | |||
| 0.06 | 0.66 | 0.12 | ||||
| −20 | 6.00 | 7.39 | 0.14 | 0.30 | 0.3 | |
| 1.16 | 0.15 | 0.13 | ||||
| 0.14 | 0.71 | 0.08 |
= Σi fiτi is the mean decay time.
fi = αiτi/Σjαjτj is the fractional contribution of the ith component to the steady-state intensity.
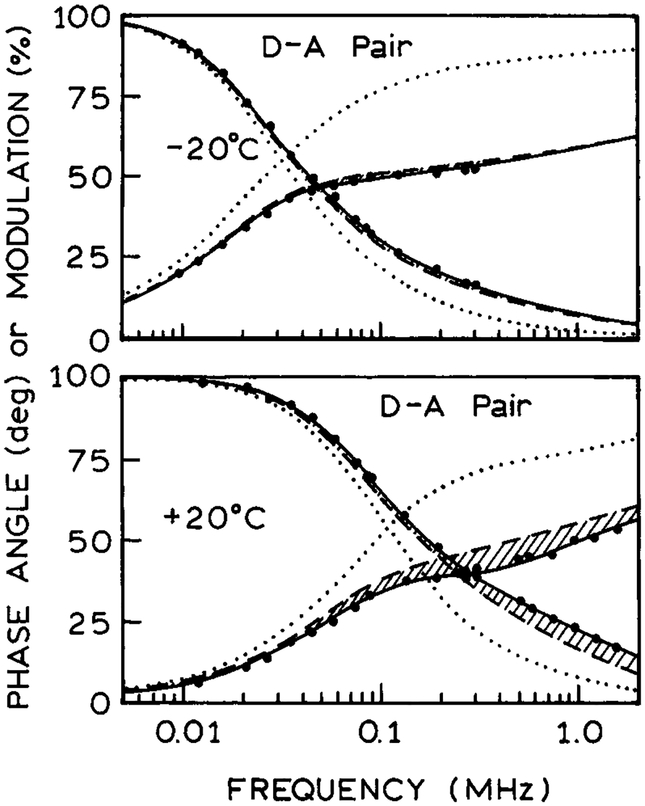
Emission spectra for the D, A and D–A pair, with the same D, A and D–A concentrations, are shown in Fig. 1 (lower panel). At 20°C the MLC D emission is quenched by about 70% by the acceptor. The acceptor emission is well shifted from that of the donor, and the 540 nm emission filter was found to reject completely the A emission. The FD decays of the donor are shown in Fig. 2. The D-alone decays are shown as a dotted line that corresponds to the multiexponential analyses summarized in Table 1. In the absence of the A, the mean decay times are 2.15 and 7.44 μs at 20 and −20°C, respectively. Such long decay times allow even slow diffusion to be significant during the excited-state lifetime. The presence of a multiexponential decay for the D without A appears to be an intrinsic property of these complexes when conjugated, as has been seen previously when Re-MLC were covalently linked to proteins and lipids (32,33).
Figure 2.
Frequency-domain intensity decays of the Re-MLc donor(····) and of the D–A pair (larger dots) in propylene glycol at −20 (top) and 20°C (bottom). The data points for the Re-MLC donor alone decay are not shown but the multiexponential analyses are shown in Table 1. The solid lines shows the best fit using the distance distribution model with diffusion (Table 1). The dashed line shows the frequency-response expected for the D–A pair in the absence of D-to-A diffusion.
The absence of a ns decay time component in the intensity decay indicates the rejection of directly excited A by the emission filters. At this time we cannot rule out the presence of a minor amount of D lacking the covalently bound A.
The presence of the Tr A shifted the D decays to higher frequencies, indicating a decrease in the D lifetime. The presence of the covalently linked Tr A also resulted in a more complex D decay that required three D decay times for an adequate fit to the D intensity decay (Table 1). The presence of A reduced the mean decay time by about 25%.
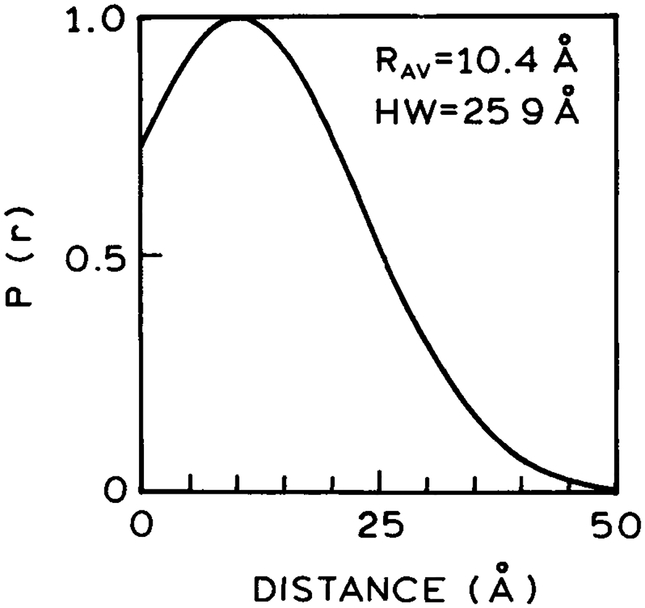
We also fit the D decay data to the distance distribution model with diffusion. This analysis resulted in a good fit to the data as seen by the overlap of the data (●) with the best distance distribution fits (——). We fit the data at two temperatures, 20 and −20°C, to recover a single distance distribution and the diffusion coefficients at each temperature (Table 2). The recovered distance distribution is broad (Fig. 3), as is typical for D–A pairs linked by a flexible spacer. The recovered diffusion coefficients are 1.53 × 10⁻⁸ and 1.30 × 10⁻⁹ cm2/s at 20 and −20°C.
Table 2.
Distance distributions and mutual D–A diffusion coefficients
| Analyses | °C | RAV (A) | HW (A) | D (cm2/s) | |
|---|---|---|---|---|---|
| Single file | 20* | 14.2 | 18.0 | 2.19 × 10⁻⁹ | 3.1 |
| −20† | 12.9 | 23.1 | 2.84 × 10⁻¹² | 1.5 | |
| Global | 20 | 10.4 | 25.9 | 1.53 × 10⁻⁸ | 4.7 |
| −20 | 1.30 × 10⁻⁹ |
R0 = 35.5Å.
R0 = 43.7Å.
Figure 3.
Donor-to-acceptor distance distribution recovered from global analysis of the data obtained in propylene glycol at −20 and 20°C.
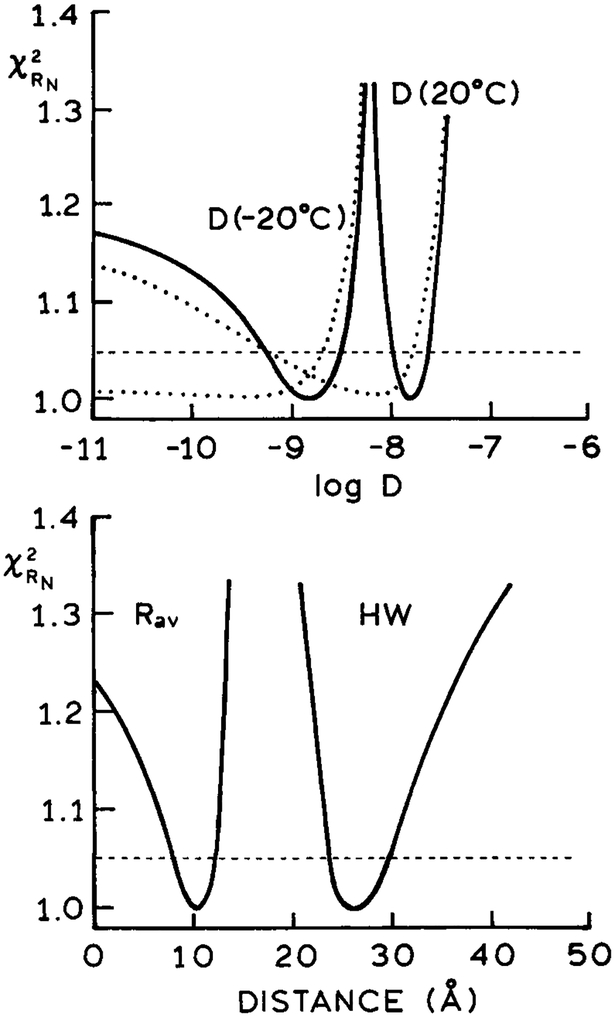
We questioned the uncertainty of these recovered values. It is well known that there is significant correlation between the values of RAV, HW and D, so that variation in one parameter value can be compensated by changes in another parameter, resulting in similar values of the goodness-of-fit parameter . One of the best ways to determine the range of parameter values consistent with the data is by examination of the surface. This surface is constructed by holding the parameter of interest fixed at values bracketing the best file fit value and allowing the other parameter values to vary to minimize . The range of parameter values consistent with the data is given by the intersection of the surface for the F-statistic for the number of degrees of freedom. We chose the F-statistic cutoff at a probability of P = 0.32 that should estimate the one standard deviation or 68% confidence limit for the parameter. These surfaces are shown in Fig. 4 for the global (−20 and 20°C) fit and for the individual fits at each temperature. The values of RAV and HW are well determined. The values of D are also well determined with the global fit (——). These results demonstrate that probes with μs decay times can be used to detect slow diffusion between the D–A pairs.
Figure 4.
Resolution of the recovered parameters (RAV, HW and D) as seen from the surfaces. The solid lines are for global analysis of the data in propylene glycol at −20 and 20°C. The dotted lines (top) are for analysis of the data at a single temperature. The horizontal dashed line is the F-statistic for the degrees of freedom with a probability of P = 0.32.
Examination of Fig. 4 reveals that resolution of the diffusion coefficient can be poor for slow diffusion, such as at −20°C (— — —). In this case the data only indicate that the value of D is less than 1.69 × 10⁻⁹ cm2/s. Smaller values of D have only a minimal effect on . This lack of resolution in D is due to the minor contribution of diffusion to the D decay. These contributions are shown in Fig. 2 where we plotted the intensity decay expected for the D–A pairs, and the distance distribution shown in Fig. 3, in the absence of D-to-A diffusion (Fig. 2, — — —). At 20°C there is a significant effect of diffusion, as seen by the shaded area (lower panel). The shaded area of the figure represents the contribution of diffusion to shortening the D decay. At −20°C there is almost no contribution of diffusion to shortening the D decay (top) and hence little resolution of the diffusion coefficient (Fig. 4). While the lack of resolution at a single temperature is disappointing, in practice a global analysis will almost always be possible. The μs decay time D could be replaced with a ns decay time D, or the μs D could be collisionally quenched. In either case the data with a shorter decay time would determine the D–A distribution without diffusion, allowing improved resolution of small diffusion coefficients.
CONCLUSION
Fluorescence spectroscopy is no longer trapped within the ns timescale. A good number of μs decay time probes are now available (32–36). The present report demonstrates that diffusion coefficients comparable to those expected for domains in proteins or of lipids in membranes are now directly observable. Fluorescence spectroscopy is now generally useful for measuring the μs dynamics of macromolecules.
Acknowledgements–
This work was supported by grants from the NIH, GM-35154 and RR-08119.
Footnotes
Abbreviations: A, acceptor; D, donor; D–A pair, Re(5,6-dmphen)(CO)3(py-CONH[CH2]12NH[CH2]5NH-Tr)ClO4; DCC, dicyclohexylcarboxydiimide; dmphen or 5,6-dmphen, 5,6-dimethyl-1,10-phenanthroline; FD, frequency domain; FRAP, fluorescence recovery after photobleaching; MLC, metal–ligand complex; NHS, N-hydroxysuccinimide; py-COOH, isonicotinic acid; Re-MLC, Re(5,6-dmphen)(CO)3(py-COOH)-C12-amide; RET, resonance energy transfer; Tr Texas red.
REFERENCES
- 1.Demchenko AP (1994) Protein fluorescence, dynamics and function: exploration of analogy between electronically excited and biocatalytic transition states. Biochim. Biophys. Acta 1209, 149–164. [DOI] [PubMed] [Google Scholar]
- 2.McCammon JA and Harvey SC (1987) Dynamics of Proteins and Nucleic Acids. Cambridge University Press, New York. [Google Scholar]
- 3.Hochstrasser RM (1998) Ultrafast spectroscopy of protein dynamics. J. Chem. Ed 75, 559–564. [Google Scholar]
- 4.Demchenko AP (1992) Fluorescence and dynamics in pro teins In Topics in Fluorescence Spectroscopy, Vol. 3: Biochemical Applications (Edited by Lakowicz JR), pp. 65–111. Plenum Press, New York. [Google Scholar]
- 5.Stubbs CD and Williams BW (1992) Fluorescence in membranes In Topics in Fluorescence Spectroscopy, Vol. 3: Biochemical Applications (Edited by Lakowicz JR), pp. 231–271. Plenum Press, New York. [Google Scholar]
- 6.Schurr JM, Fujimoto BS, Wu P and Song L (1992) Fluorescence studies of nucleic acids: dynamics, rigidities, and structures In Topics in Fluorescence Spectroscopy, Vol. 3: Biochemical Applications (Edited by Lakowicz JR), pp. 137–229. Plenum Press, New York. [Google Scholar]
- 7.Ladha S, Mackie AR, Harvey LJ, Clark DC, Lea EJA, Brullemans M and Duclohier H (1996) Lateral diffusion in planar lipid bilayers: a fluorescence recovery after photo-bleaching investigation of its modulation by lipid composition, cholesterol, or alamethicin content and divalent cations. Biophys. J 71, 1364–1373. [DOI] [PMC free article] [PubMed] [Google Scholar]
- 8.Gilmanshin R, Creutz CE and Tamm LK (1994) Annexin IV reduces the rate of lateral lipid diffusion and changes the fluid phase structure of the lipid bilayer when it binds to negatively charged membranes in the presence of calcium. Biochemistry 33, 8225–8232. [DOI] [PubMed] [Google Scholar]
- 9.Schulz GE (1991) Domain motions in proteins. Curr. Opin. Struct. Biol 1, 883–888. [Google Scholar]
- 10.Gerstein M, Lesk AM and Chothia C (1994) Structural mechanisms for domain movements in proteins. Biochemistry 33, 6738–6749. [DOI] [PubMed] [Google Scholar]
- 11.Hinsen K, Thomas A and Field MJ (1999) Analysis of domain motions in large proteins. Proteins Struct. Funct. Genet 34, 369–382. [PubMed] [Google Scholar]
- 12.Wriggers W, Mehler E, Pitici F, Weinstein H and Schulten K (1998) Structure and dynamics of calmodulin in solution. Biophys. J 74, 1622–1639. [DOI] [PMC free article] [PubMed] [Google Scholar]
- 13.Haran G, Haas E, Szpikowska BK and Mas MT (1992) Domain motions in phosphoglycerate kinase: determination of interdomain distance distributions by site-specific labeling and time-resolved fluorescence energy transfer. Proc. Natl. Acad. Sci. USA 89, 11764–11768. [DOI] [PMC free article] [PubMed] [Google Scholar]
- 14.Schauerte JA, Steel DG and Gafni A (1997) Time-resolved room temperature tryptophan phosphorescence in proteins. Methods Enzymol. 278, 49–71. [DOI] [PubMed] [Google Scholar]
- 15.Periasamy N and Verkman AS (1998) Analysis of fluorophore diffusion by continuous distributions of diffusion coefficients: application to photobleaching measurements of multi-component and anomalous diffusion. Biophys. J 75, 557–567. [DOI] [PMC free article] [PubMed] [Google Scholar]
- 16.Yoshida TM and Barisas BG (1986) Protein rotational motion in solution measured by polarized fluorescence depletion. Biophys. J 50, 41–53. [DOI] [PMC free article] [PubMed] [Google Scholar]
- 17.Sabbatini N, Guardigli M and Manet I (1997) Lanthanide complexes of encapsulating ligands MLCs luminescent devices. Adv. Photochem 23, 213–278. [Google Scholar]
- 18.Thomas DD, Carlsen WF and Stryer L (1978) Fluorescence energy transfer in the rapid-diffusion limit. Proc. Natl. Acad. Sci. USA 75, 5746–5750. [DOI] [PMC free article] [PubMed] [Google Scholar]
- 19.Stryer L, Thomas DD and Meares CF (1982) Diffusion-enhanced fluorescence energy transfer. Annu. Rev. Biophys. Bioeng 11, 203–222. [DOI] [PubMed] [Google Scholar]
- 20.Terpetschnig E, Szmacinski H, Malak H and Lakowicz JR (1995) Metal–ligand complexes (MLCs) a new class of long-lived fluorophores for protein hydrodynamics. Biophys. J 68, 342–350. [DOI] [PMC free article] [PubMed] [Google Scholar]
- 21.Terpetschnig E, Szmacinski H and Lakowicz JR (1995) Fluorescence polarization immunoassay of a high-molecular-weight antigen based on a long-lifetime Ru–ligand complex. Anal. Biochem 227, 140–147. [DOI] [PMC free article] [PubMed] [Google Scholar]
- 22.Li L, Szmacinski H and Lakowicz JR (1997) Synthesis and luminescence spectral characterization of long lifetime lipid metal–ligand probes. Anal. Biochem 244, 80–85. [DOI] [PMC free article] [PubMed] [Google Scholar]
- 23.Guo X-Q, Castellano FN, Li L, Szmacinski H, Lakowicz JR and Sipior J (1997) A long lived highly luminescent Re(I) metal–ligand complex (MLCs) a biomolecular probe. Anal. Biochem 254, 179–186. [DOI] [PMC free article] [PubMed] [Google Scholar]
- 24.Demas JN and DeGraff BA (1994) Design and application of highly luminescent transition metal complexes In Topics in Fluorescence Spectroscopy. Vol. 4: Probe Design and Chemical Sensing (Edited by Lakowicz JR), pp. 71–107. Plenum Press, New York. [Google Scholar]
- 25.Wallace L and Rillemma DP (1993) Photophysical properties of rhenium(I) tricarbonyl complexes containing alkyl- and aryl-substituted phenantrolines as ligands. Inorg. Chem 32, 3836–3843. [Google Scholar]
- 26.Lakowicz JR and Gryczynski I (1991) Frequency-domain fluorescence spetroscopy In Topics in Fluorescece Spectroscopy (Edited by Lakowicz JR), pp. 293–335. Plenum Press, New York. [Google Scholar]
- 27.Cheung HC (1991) Resonance energy transfer In Topics in Fluorescenece Spectroscopy. Vol. 2: Principles (Edited by Lakowicz JR), pp. 127–176. Plenum Press, New York. [Google Scholar]
- 28.Lakowicz JR, Gryczynski I, Cheung HC, Wang C-K and Johnson ML (1988) Distance distributions in native and random coil troponin I from frequency-domain measurements of fluorescence energy transfer. Biopolymers 27, 821–830. [DOI] [PubMed] [Google Scholar]
- 29.Lakowicz JR, Kusba J, Wiczk W and Gryczynski I (1990) End-to-end diffusion of a flexible bichromophoric molecule observed by intramolecular energy transfer and frequency-domain fluorometry. Chem. Phys. Lett 173, 319–326. [Google Scholar]
- 30.Lakowicz JR, Gryczynski I, Kusba J, Wiczk W, Szmacinski H and Johnson ML (1994) Site-to-site diffusion in proteins as observed by energy transfer and frequency-domain fluorometry. Photochem. Photobiol 59, 16–29. [DOI] [PubMed] [Google Scholar]
- 31.Lakowicz JR (1999) Principles of Fluorescence Spectroscopy, 2nd ed., Chapter 13, pp. 367–394. Kluwer Acad. Plenum Press, New York. [Google Scholar]
- 32.Guo X-Q, Castellano FN, Li L, Szmacinski H, Lakowicz JR and Sipior J (1997) A long-lived highly luminescent Re(I) metal7–ligand complex as a biomolecular probe. Anal. Biochem 254, 179–186. [DOI] [PMC free article] [PubMed] [Google Scholar]
- 33.Guo X-Q, Castellano FN, Li L and Lakowicz JR (1998) Use of a long-lifetime Re(I) complex in fluorescence polarization immunoassays of high-molecular weight analytes. Anal. Chem 70, 632–637. [DOI] [PMC free article] [PubMed] [Google Scholar]
- 34.Malak H, Gryczynski I, Lakowicz JR, Meyer GJ and Castellano FN (1997) Long-lifetime metal–ligand complexes as luminescent probes for DNA1–5. J. Fluoresc 7, 107–112. [DOI] [PMC free article] [PubMed] [Google Scholar]
- 35.Terpetschnig E, Dattelbaum JD, Szmacinski H and Lakowicz JR (1997) Synthesis and spectral characterization of a thiol-reactive long-lifetime Ru(II) complex. Anal. Biochem 251, 241–245. [DOI] [PMC free article] [PubMed] [Google Scholar]
- 36.Castellano FN, Dattelbaum JD and Lakowicz JR (1998) Long-lifetime Ru(II) complexes as labeling reagents for sulfhydryl groups. Anal. Biochem 255, 165–170. [DOI] [PubMed] [Google Scholar]


