

Abstract
Complex behaviors depend on the coordination of the activities of ensembles of neurons and the release of neuromodulators such as dopamine. The mechanisms underlying such coordination are not well-understood due to a lack of instrumentation for combined and real-time monitoring of neuromodulator release and the activities of large ensembles of neurons. Here we describe a measurement platform that allows for the combined monitoring of electrophysiology from a high-density electrode array and dopamine dynamics from a carbon-fiber microelectrode. Integration of these two measurement systems was achieved through modification of the existing instrumentation. A shared grounded reference electrode was used in both systems to minimize electrical interference. Further, an optional solid-state-relay array positioned between the electrophysiological electrode array and amplifiers was added to provide additional electrical isolation. The capacity of the integrated measurement platform, termed DANA (Dopamine And Neural Activity), to measure action potentials (high frequency) and local-field oscillations (low frequency) was characterized in vitro using an artificial cerebral spinal fluid gelatin. In vivo recordings from the DANA platform in anesthetized rats demonstrated the ability of the system for near-simultaneous measurement of dopamine release and activity from multiple neurons both in distant brain regions (striatum and hippocampus) and within the same brain region (striatum). Furthermore, this system was shown to be sufficiently compact to measure activity in freely moving animals through recording of single-neuron activity, high-frequency local-field oscillations, and dopamine release.
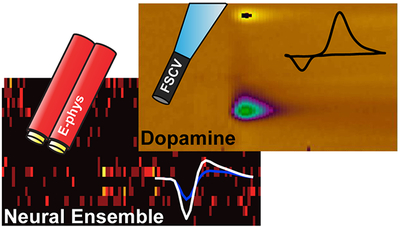
Graphical Abstract
Although dopamine is known to change neuronal excitability,1,2 modulate neural plasticity,3,4 and regulate learning,5,6 the mechanisms by which dopamine influences ongoing neuronal activity are not understood. Particularly notable is the lack of understanding of the effects of dopamine release on the activities of networks of neurons. Understanding dopamine’s influence on network activity is important as experimental and theoretical work, such as Donald Hebb’s theory of “cell assemblies”,7 indicate that distinct networks of neurons represent a fundamental unit of computation and storage in the brain. Understanding how dopamine influences cell assemblies requires instrumentation that measures both dopamine release and neural ensemble activity8 with subsecond resolution. No such instrumentation is currently available, and this is largely due to challenges involved in integrating tools that measure chemical release and electrical activity. For example, fast-scan cyclic voltammetry (FSCV)9,10 allows real-time measurement of dopamine release, but the applied voltage used in FSCV interferes with electrophysiological recordings.11
Experiments involving electrophysiological measurement of neural activity in behaving animals have contributed greatly to the understanding of how neurons encode spatial environments12 and store memories.13,14 Extracellular recording from arrays of electrodes is an established method for measuring neural ensemble activity.15 Extracellular electrophysiology measures voltage fluctuations produced by the movement of ions in and out of neurons resulting from action potentials and postsynaptic activity.16,17 Action potentials are brief (~1 ms), high-frequency (600–6000 Hz) electrical events produced by individual neurons, and these events can be measured from extracellular electrodes located within ~100 μm of the axon hillock.18 Extracellular electrodes can also record lower-frequency (<300 Hz) local-field potentials (LFPs) that arise from coordinated synaptic activity from many neurons.19 LFP activity has been implicated in learning, decision making, and motor control.20–22
A drawback of electrophysiological recording is its inability to monitor neuromodulator release. In contrast, FSCV is a well-established technique for the measurement of neurotransmitter dynamics in vivo with high temporal resolution (subsecond), sensitivity (low nanomolar limit-of-detection), and spatial resolution (tens of micrometers).9,10,23 Yet, FSCV is limited to the measurement of electroactive neurotransmitters typically at one probe, although examples using 2–3 electrodes have been reported.24–26 Thus, combining electrode-array electrophysiology and FSCV technologies would provide a much-needed tool for probing uninvestigated links between the activity of neural ensembles and neuromodulator dynamics.
Previous efforts to combine FSCV and electrophysiology utilized a single carbon-fiber microelectrode to acquire both the FSCV and electrophysiological signal,11,27,28 though attempts to integrate electrophysiological arrays have been made.29 While knowledge gained through such studies is invaluable, a limitation of the single-sensor approach is that electrophysiological and voltammetric measurements can only be acquired within the same brain region and from a small number of neurons (1–3) at a time. Consequently, questions regarding the role of neuromodulation in altering neuronal-ensemble interactions cannot be addressed.
To address these limitations, we developed an instrument, termed DANA (Dopamine And Neural Activity), that allows combined measurement of dopamine release with FSCV and neural activity from large electrophysiological electrode arrays. A modified voltammetric headstage that allows for the application of the voltammetric waveform directly to the working electrode (similar to that described by Takmakov et al.)28 enables the use of a shared ground, minimizing noise. Additionally, an optional 32-channel solid-state-relay array (SSR) was placed between the electrophysiological electrodearray and amplifiers. We characterized the instrument’s capacity to measure action potentials (600–6000 Hz) and local-field potentials (<300 Hz) in vitro and its capacity to monitor dopamine release in the striatum and single-neuron activity in the striatum or hippocampus of anesthetized rats. The striatum and hippocampus were chosen as these regions receive input from midbrain dopamine neurons,30,31 and this input is thought to drive neuroplasticity and adaptive learning.32,33 Finally, the DANA system was shown to be compact enough to monitor phasic dopamine changes, single-neuron activity, and local-field potentials in a freely moving animal. Taken together, results from these experiments demonstrate the potential of the DANA system to investigate connections between physiology, neurochemistry, and behavior.
MATERIALS AND METHODS
Electrode and Array Fabrication.
Details regarding fabrication of carbon-fiber microelectrodes, reference electrodes, and electrophysiological arrays can be found in Supporting Information.34–37
Chemicals.
All chemicals were purchased from EMD Chemicals Inc. (Darmstadt, Germany) unless otherwise stated. Dopamine hydrochloride, Tris base, Tris hydrochloride, 3,4-ethylenedioxythiophene (EDOT), and GBR-12909 were purchased from Sigma-Aldrich (St. Louis, MO). Eticlopride hydrochloride was purchased from Tocris Bioscience (Avonmouth, Bristol, U.K.). Nafion solution (LQ-1105) was purchased from Ion Power Inc. (New Castle, DE) and used as provided. Ketamine was purchased from Phoenix Pharmaceuticals Inc. (Ketaject, St. Joseph, MO). Artificial cerebral spinal fluid (aCSF) was made by dissolving 15 mM Tris, 126 mM NaCl, 2.5 mM KCl, 20 mM NaHCO3, 2.0 mM NaH2PO4, 1.2 mM Na2SO4, 1.2 mM CaCl2, and 2.0 mM MgCl2 in 18.2 MΩ water (EMD Millipore) and the pH was adjusted to 7.40 using HCl. To produce an aCSF gelatin, porcine gelatin (0.5% by mass) was added and the solution was heated until it dissolved. The mixture was allowed to set at room temperature.
Animals and Surgery.
Male Sprague–Dawley rats were pair-housed on a reverse 12-h light-dark cycle until the time of surgery and provided food and water ad libitum. All procedures were performed in accordance with National Institutes of Health guidelines for laboratory animals under protocols approved by the University of Arizona Institutional Animal Care and Use Committee. Surgeries were performed under 1.5–3.5% isoflurane anesthesia (JD Medical Distribution Company, Phoenix, AZ). Stereotaxic coordinates were taken from Paxinos and Watson.38
Anesthetized Animal Experiments.
For experiments recording in the nucleus accumbens (NAc) and hippocampus, craniotomies were performed to allow access to the NAc (AP, 1.5 mm; ML, 1.4 mm; DV, 6.3–6.8 mm from brain surface), medial forebrain bundle (MFB; AP, −2.5 mm; ML, 1.7 mm; DV, 7.4–8.5 mm from brain surface), and hippocampus (AP, −3 mm; ML, 2 mm; DV, 2.0–3.5 mm from the brain surface). A hole was drilled above the cerebral cortex for placement of the Ag/AgCl reference electrode (insertion depth, ~5 mm).
A carbon-fiber microelectrode was lowered into the NAc and a bipolar stimulating electrode (Plastics One, Roanoke, VA) was lowered into the MFB. Dopamine release was evoked by applying a 60-pulse train of 1 ms per phase, 300–600 μA, biphasic, square wave pulses at a frequency of 60 Hz with an optically isolated DS4 biphasic current stimulator (DigiTimer, Welwyn Garden City, Hertfordshire, U.K.). After verifying the measurement of electrically evoked dopamine release, the 16-stereotrode (32-channel) electrophysiological array was lowered slowly into the hippocampus. When multiple single units were identified in the electrophysiological signal, the MFB was stimulated five times with a 5 min interval between stimulations. Then, the electrophysiological array was further lowered, and the recording and stimulation protocol was repeated.
For experiments recording from the dorsal striatum, craniotomies were performed to allow placement of the electrophysiological electrode array (AP, 1.0 mm; ML, 2.0 mm; DV, 3.5–4.5 mm from brain surface) and the carbon-fiber microelectrode (AP, −1.0 mm; ML, 2.0 mm; DV, 4.9 mm from brain surface. The stereotaxic arm was angled at 32° posterior from normal). A hole was drilled above the cerebral cortex for placement of the Ag/AgCl reference electrode (insertion depth ~5 mm). Spontaneous dopamine release was pharmacologically induced by i.p. administration of GBR-12909 (20 mg/kg, 40 min before start of recording) and eticlopride (1.0 mg/kg, 20 min before start of recording).
Freely Moving Animal Experiment.
Immediately before surgery, the rat was injected subcutaneously with 22 mg/kg Cefazolin (Hikma Farmaceutica, Portugal). Implantation of the stimulating and reference electrodes as well as the electrophysiological array were performed as described (vide supra). A carbon-fiber microelectrode was implanted into the dorsal striatum (AP, 1 mm; ML, 2 mm; DV, 4.2 mm). For pain management, Rimadyl (5 mg/kg, Zoetis Inc., Kalamazoo, MI) was injected subcutaneously 5 min before and after surgery as well as 1- and 2-days postsurgery. The animal was housed individually following surgery and allowed 6 weeks for recovery before performing experiments. During this time, the animal was given oral Sulfatrim (30 mg/kg, Hi-Tech Pharmacal, Amityville, NY) daily until sacrifice. During recording, the animal was placed into a padded vessel and recordings were started after 30 min. Dopamine release was electrically evoked at 5 min intervals (vide supra). After 30 min of data collection, ketamine was injected (20 mg/kg, i.p.). Recordings continued for 1 h following injection.
Data Collection.
Fast-Scan Cyclic Voltammetry.
A 400 V/s triangle waveform (−0.4 to 1.3 V, vs Ag/AgCl) was applied at a frequency of 5 Hz and data were collected using custom instrumentation and WCCV 3.0 acquisition software provided by Knowmad Technologies, LLC (Tucson, AZ).
Electrophysiology.
Electrophysiological data (aCSF gelatin simulations and in vivo data) were collected with an Intan RHD2132 headstage amplifier connected to an RHD2000 USB interface board using version 1.4.2 RHD2000 interface software for Windows (Intan Technologies, Los Angeles, CA). In one set of experiments, the headstage amplifier was isolated from the implanted electrode array using a custom 32-channel solid-state-relay array (HTech, LLC, Tucson, AZ) and using the Maxim Integrated Products MAX333A CMOS analog switch (Figure S-1). All electrophysiological recordings were sampled at 20 or 30 kHz (0.5–6000 Hz band-pass filter) and digitized with 16-bit resolution.
Synchronizing the Electrochemical and Electrophysiological Systems.
To ensure precise synchronization of the recordings, the waveform frequency TTL pulses were sent to a digital input of the electrophysiology recording system. Additionally, a microcontroller (Arduino LLC, Strambino, TO, Italy) was used to send a unique code to both the voltammetric and electrophysiological systems upon receiving an event TTL sent by the voltammetric system. This TTL was also used to trigger the stimulation pulse-train.
Data Analysis.
Fast-Scan Cyclic Voltammetry.
Data analysis was carried out using WCCV 3.0 (Knowmad Technologies, LLC). Voltammograms were low-pass filtered at 2000 Hz. An average of 10 cyclic voltammograms collected in the period preceding stimulation were subtracted from all voltammograms to produce background-subtracted cyclic voltammograms. Dopamine concentration was estimated using within-subject principal component regression using cyclic voltammograms obtained via MFB stimulation.39 Flow-cell calibration of electrodes was used to determine the concentration amplitude (18 nA/μM, n = 6 electrodes, Figure S-2) using aCSF. Specifically, aCSF was pumped past the electrode surface at a rate of 500 μL/min and a digitally actuated six-port valve (VICI, Houston, TX) was used to inject a bolus of dopamine (0.1–1 μM). The peak current at the dopamine oxidation potential (~0.55 V vs Ag/AgCl) was used for quantification.
Frequency Analysis of in Vitro Simulation.
Electrophysiological recordings were made in aCSF gelatin both with and without the SSR inserted between the electrophysiological array and amplifiers. After approximately 1 min of recording, the voltammetric waveform was applied and recording continued for another minute. Data were down-sampled to 10 000 Hz prior to analysis. Standard Fourier spectral analysis was applied to these data (spectrogram and spectral density) using Matlab (Natick, MA) and the Signal-processing Toolbox (functions: pwelch() and spectrogram()). Complex Morelet Wavelet decomposition was performed using the Wavelet Toolbox (function: cwtft()).
Quantification of the Time Required to Recover an Input Frequency during Voltammetric Scanning.
The time required to recover a sine-wave input signal of a given frequency during the interscan interval was quantified using a template-matching procedure (Figure S-3). This procedure involved first identifying a baseline response to the input frequency by measuring the power-spectral density (PSD) of the local-field signal (191.5 ms duration) when the FSCV headstage was disconnected and the input signal was applied (e.g., a 40 Hz sine wave). A PSD quantifies power as a function of frequency, and it was determined using complex Morelet Wavelet decomposition given the high temporal resolution of the wavelet transform. This baseline, or “template”, PSD was subsequently compared to PSDs measured from electrophysiological traces of varying durations acquired during the interscan interval when the FSCV headstage was both connected and scanning. The duration of electrophysiological traces from which the PSDs were computed was increased in 5 ms increments until the length of the trace matched the interscan interval (191.5 ms). The 0–5 ms period following scan offset was omitted in order to minimize the contribution of the scan/SSR-switching artifact. The similarity between each target PSD and the baseline template was quantified as the squared Pearson’s correlation coefficient (R2). The time-to-recover was calculated as the interval required for the R2 value to reach 0.7 (70% of variance explained by the baseline template). The range of frequencies measured in the PSDs was 0–250 Hz for input sine-wave signals <250 Hz and 600–5000 Hz for high-frequency signals >600 Hz (the frequency range associated with action potentials).
Identification and Analysis of in Vivo Action Potentials.
For single-neuron action potential extraction, a 13 ms window, starting 1 ms before the beginning and 3.5 ms after the 8.5 ms voltammetric scan, was removed. Recordings between the voltammetric scans were band-pass filtered (600–6000 Hz) and individual units were sorted offline using Spike2 (Cambridge Electronic Design, Cambridge, U.K.). Cell responsiveness was determined using a paired Student’s t test. Overall firing responses are displayed as peri-event histograms (bin size = 100 ms). Firing rate for the freely moving animal was calculated by binning action potentials into 1 ms periods and then smoothing over 1 min intervals with a convolution filter (Hanning kernel). A 1 min window following ketamine injection was ignored due to interference from animal handling.
Analysis of High-Frequency Local-Field Potentials (LFPs) from an Awake Animal.
Recordings were sampled at 20 000 Hz, band-pass filtered from 0.5 to 600 Hz, and then down-sampled to 2 000 Hz. A 10 ms interval following voltammetric scan offset was eliminated. Consequently, each analyzed interscan LFP segment was 181.5 ms in duration. This interscan LFP activity was band-pass filtered from 100 to 160 Hz and the root-mean-squared (RMS) power was calculated yielding a single value for each interscan segment. Mean RMS values per segment were smoothed with a convolution filter (Hanning kernel, 1 s window). A 1 min window following ketamine injection was ignored due to interference from animal handling.
RESULTS AND DISCUSSION
Instrument Design.
The measurement platform developed herein combines a traditional electrophysiology array and carbon-fiber microelectrode for measurement of dopamine release utilizing a “time-share” approach (Figure 1). That is, electrophysiological signals are not measured during the periodic voltammetric scans and vice versa. When combining these two measurement systems, one where a large voltage is applied and the current is measured (voltammetry) and the other where small voltage fluctuations are measured (electrophysiology), it is important that their interactions are limited. Each system requires at least two electrodes, one for measurement and one to act as a reference. The impedance (at 1 kHz frequency in aCSF gelatin) between the electrophysiological electrodes and reference electrodes was 133 ± 9 kΩ (n = 15 electrodes, ±SEM). Conversely, the impedance between the carbon fiber and the electrophysiological electrodes was significantly larger (230 ± 20 kΩ, n = 15 electrophysiological electrodes, 3 voltammetric electrodes, ±SEM, Student’s t test, p < 0.0001). In most FSCV instrumentation, the inverse of the desired voltammetric waveform is applied to the reference electrode. The potential waveform required to measure dopamine dynamics typically lasts 8.5 ms, has a magnitude of 1.7 Vpk-pk (peak-to-peak voltage), and is applied at a frequency of 10 Hz (every 100 ms). This creates a technical challenge as applying this large potential to the reference electrode results in saturation of the electrophysiological amplifiers as they are designed to measure microvolt changes in extracellular potential.
Figure 1.

Instrument design and timing diagram. (A) Schematic of instrumental setup. A shared grounded Ag/AgCl reference (black arrow), a 16-stereotrode electrophysiological (E-phys) array (blue), and carbon-fiber microelectrode (CFME, red) are inserted into brain or artificial cerebral spinal fluid gelatin. E-phys array may be followed by an optional solid-state-relay array (SSR, gray box, Figure S-1). The CFME is interfaced through a custom headstage (lower right). An LF356 operational amplifier was used to allow application of the voltammetric waveform (Vapp) directly to the CFME and facilitate a shared grounding scheme. (B) Measurement “time-share” scheme. A 5 Hz timing pulse from the voltammetric system (top) controls the application of the voltammetric waveform (second down) and collection of the voltammetric signal (third down). The electrophysiological signal is not measured during the voltammetric scan (gray boxes, bottom trace). Inset displays a single action potential.
To overcome this technical challenge, a modified version of the voltammetric instrumentation (Figure 1A) was used where the potential is applied to the working electrode and the reference electrode is held at ground. This allows for a shared grounded reference electrode for both electrophysiological and electrochemical measurements. Having the reference electrode held at ground limits electronic noise in the electrophysiological signal when compared to the configuration where the working electrode is grounded (4 vs 60 μVRMS, root-mean-squared of the measured voltage). When applying the voltammetric waveform to the working electrode, the specifications on the operational amplifier are more stringent as it is susceptible to instability in this configuration. At high frequencies, if the output has too much phase delay, the inputs are not held at the same potential, causing the operational amplifier to oscillate. As such, the voltammetric headstage was constructed using a LF356 operational amplifier (Texas Instruments) chosen for its rapid slew rate (12 V/μs), low noise (0.01 pA/Hz1/2), wide unit-gain bandwidth (5 MHz), and low input bias current (30 pA max).
With a shared reference electrode, the interference caused by the voltammetric waveform at the electrophysiological amplifiers was minimized. The platform used in this work includes an Intan RHD2132 amplifier headstage with a working range of ±5 mV. Upon application of the voltammetric waveform in vivo in anesthetized animals, the amplitude of the artifact caused by the application of the voltammetric waveform was 1–4 mV. Thus, unwanted saturation of electrophysiological amplifiers was prevented by using the LF356 voltammetric headstage. However, it is important to note that the measured artifact would be expected to increase if the experimenter employed a more rapid scan rate or used a larger working electrode.
To provide additional isolation, an optional digitally controlled 32-channel solid-state-relay array (SSR, Figure 1A and Figure S-1) was added between the electrophysiological array and amplifiers. The SSR was composed of eight MAX333A quad precision analog switches arranged on a dual-sided printed circuit board. It has a compact profile (8 g, 0.5 cm × 3.5 cm × 4.5 cm), allowing for use with freely moving animals. A TTL control pulse from the voltammetric system was used to put the SSR into an open-circuit configuration for the duration of the 8.5 ms voltammetric scans, preventing current flow and protecting the electrophysiological amplifiers (Figure 1B). The ability to collect single-unit activity between voltammetric scans is illustrated (Figure 1B, bottom trace). Using the SSR is advantageous as it isolates electrophysiological and voltammetric recordings and thus could enable combined recordings in medical applications. Additionally, the SSR would facilitate recording under conditions where saturation of the electrophysiological amplifiers is a concern.
In Vitro Characterization of Instrumentation.
Artifact in the Electrophysiological Signal Due to Voltammetric Waveform Application.
To assess the effect of the voltammetric waveform and the SSR on electrophysiological recordings, we used a model system consisting of aCSF gelatin (Figure 2). The gelatin has a carbon-fiber working electrode (voltammetric waveform applied here, current measured), electrophysiological array (voltage measured here), and a shared reference electrode (grounded). Application of the voltammetric waveform to the carbon-fiber microelectrode causes an artifact in the electrophysiological signal both with and without the SSR (Figure 2A). The amplitude of the artifact recorded in vitro without the SSR was markedly lower than the artifact in vivo; however, their shape and duration are similar. The artifact created by switching of the SSR in vitro closely resembles that seen in vivo.
Figure 2.

In vitro characterization of DANA system. (A) Artifact measured at the electrophysiological array in aCSF gelatin during voltammetric waveform application with (blue, bottom) and without (red, top) incorporation of the optional solid-state-relay array (SSR). Black traces show the measured signal in the absence of waveform (WF) application. Gray boxes indicate the duration of the voltammetric scans. (B) Time to recovery of input sine waves with frequencies in the range of action potentials as calculated using a template-matching procedure (Figure S-3, Materials and Methods). Comparisons were made to the uninterrupted sine waves used to make the template (black triangles), as well as the signal acquired during voltammetric waveform application both with (blue circles) and without (red triangles) the SSR. The data points are overlapping, and in all cases, frequencies in this range were rapidly recovered (<10 ms). Error bars are the larger of either SEM or the sampling interval (5 ms, n = 6 electrodes). (C) Time to recovery of input sine waves with frequencies in the range of local-field potentials. Frequencies which were not recovered within the interscan interval are not shown. (D) Power-spectral-density (PSD) analysis of electrophysiological traces during waveform application. Artifactual bands at the waveform application frequency (5 Hz) and harmonics are present both with (blue) and without the SSR (red). In general, the amplitude of these interferences decrease with increasing frequency. (E) The ability to extract target frequencies in a local-field trace in the presence of the waveform-application artifacts was assessed by injecting a 7 Hz, 500 μVpk-pk sine wave into the aCSF gelatin. The target frequency (black triangle) is clearly distinguishable from the artifactual bands and thus could be extracted for analysis.
Recovery of Signals in the Frequency Range of Action Potentials.
Action potentials represent the most fundamental mechanism by which individual neurons transmit signals. To test the capability of the DANA system to extract frequencies in the range of action potentials, sine waves (1–3 kHz, 500 μVpk-pk) were applied to a silver wire placed in the gelatin, and the signal at the electrophysiological electrode array was measured. The sine waves were applied with and without the SSR present as well as with and without the voltammetric waveform being applied. For each input sine wave, the sampling time required for recovery was calculated using a template-matching procedure and plotted as a function of frequency (Figure 2B). This procedure involved matching the spectral density of the input sine wave measured without application of the voltammetric waveform to spectral densities measured within the interscan interval (Materials and Methods, Figure S-3). Comparisons were made to the uninterrupted sine wave used to create the template (black triangles) as well as the signals obtained during waveform application with (blue circles) and without SSR integration (red triangles). All measured frequencies in this range (1–3 kHz) were recovered within 10 ms of the end of the voltammetric waveform. See Figure S-4 for examples of action potentials recovered before and after the voltammetric scan in vivo.
Recovery of Signals in the Frequency Range of Local-Field Potentials.
Local-field potentials are the result of coordinated activity of large populations of neurons. Oscillations in local-field potentials within specific frequency bands are associated with different functions such as organizing the activities of ensembles of individual neurons or facilitating learning and attention.40 To characterize the system’s response to frequencies relevant to the analysis of local-field oscillations in animals, we again used a template-matching approach. However, the frequencies analyzed were restricted to those relevant to local-field potentials (1–200 Hz, Figure 2C). Data is not shown for frequencies <10 Hz as these could not be recovered within the interscan interval (191.5 ms). These frequencies were not recovered because the period of the oscillation approaches the duration of the interscan interval (e.g., a 5 Hz oscillation has a period of 200 ms).
The recovery time with the voltammetric waveform applied in the absence of the SSR was nearly identical to that of the uninterrupted signals indicating that the scan artifact had minimal impact on the capacity to recover the input signal. Addition of the SSR increased recovery time for most measured frequencies. Yet all measured frequencies 10 Hz and above were reliably recovered within the interscan interval with frequencies >20 Hz recovered within 50 ms of the end of the voltammetric waveform. Thus, frequencies corresponding to beta (10–20 Hz), gamma (30–80 Hz), high-frequency (100–160 Hz), and ripple (150 Hz) oscillations can be recovered with high temporal resolution (Table S-1).40
Extraction of Low-Frequency Oscillations.
Though signals below 10 Hz were not reliably recovered within the interscan intervals (191.5 ms), these signals may still be extracted by integrating over a longer period of time. A spectral density analysis of the local-field trace acquired during a 5-s period of voltammetric waveform application with the SSR (Figure 2D, blue) revealed narrow-band artifactual frequency responses occurring at multiples of the waveform application frequency (5 Hz in these experiments). These responses decayed in amplitude at higher harmonics. The spectral density showed little interference in the absence of the SSR (Figure 2B, red). Because SSR-induced artifacts were narrow-band (full-width half-maximum «0.4 Hz), measurement of physiological oscillatory responses at frequencies between artifacts should be recoverable. To test this, a 7 Hz sine wave (500 μVpk-pk) was applied to a silver wire inserted into the gelatin. This simulated neural activity created a peak at the target frequency (7 Hz) which was visible and well-separated from artifactual peaks (Figure 2E). Thus, this target frequency could be extracted even in the presence of interference from SSR switching. However, at least at low frequencies, artifacts would prevent measurement at precise multiples of the waveform application frequency. Nonetheless, if the frequency of interest in a particular experiment were a multiple of five, the waveform application frequency could be adjusted to 4 or 6 Hz to allow extraction of the desired frequency.
Combined in Vivo Measurement of Striatal Dopamine Release and Multiple Single-Neuron Activity in the Hippocampus.
The DANA system was used to acquire measurements of stimulated dopamine release within the striatum and neural activity within the hippocampus of anesthetized rats (Figure 3). Data shown were collected without integration of the SSR. Similar data collected with the SSR can be found in the Supporting Information (Figures S-5 and S-6). A carbon-fiber microelectrode was placed in the NAc, a stimulating electrode was placed in the MFB, and a 16-stereotrode array was inserted into the contralateral hippocampus (Figure 3A). We chose to record from the hippocampus given its well-characterized electrophysiological properties, the high-density of cell bodies and because dopamine release in the hippocampus is thought to regulate synaptic transmission.32 Stereotrodes consisting of twisted tungsten wires (vide supra, Supporting Information) were chosen for electrophysiological measurements over single-wire electrodes as stereotrodes improve the identification of neurons as waveforms from each neuron are measured at two recording sites.34 To elicit dopamine release, the MFB was stimulated five times with a 5 min interstimulus interval. Single-neuron activity and dopamine dynamics in response to stimulation were measured using the time-share protocol described previously and responses were aligned to the time of stimulation. MFB stimulation resulted in a marked increase in dopamine concentration and firing activity of this neuron (Figure 3B–E). The raster plot presented in Figure 3B displays the firing rate of a single neuron in response to electrical stimulation. Each row of the raster plot indicates a single trial with the start of the electrical stimulation aligned at t = 0. The peri-event histogram below the raster plots indicates the cumulative response across all trials (Figure 3C). The average waveform of the neuron as recorded at the two electrodes of the stereotrode are shown to the right of the histogram. Real-time changes in dopamine concentration (Figure 3D) illustrate the capability of the DANA system to capture rapid release and reuptake dynamics and a characteristic dopamine voltammogram is obtained (inset). An average color plot of all trials displays oxidation and reduction of dopamine following electrical stimulation (Figure 3E). It should be noted that the changes in single-neuron activity reported herein are not necessarily a direct consequence of dopamine release as the MFB consists of axons from many brain regions. Rather, this work is intended to illustrate the ability to make measurements of neurotransmitter release and single-unit activity in vivo from brain regions containing neurons that are likely modulated by local release of dopamine. This marks the first reported instance to our knowledge of synchronous measurement of single-neuron activity and dopamine release in anatomically distinct brain regions.
Figure 3.

Simultaneous measurement of single-unit action potentials and dopamine release. (A) Schematic of probe placement. An electrode was placed in the medial forebrain bundle (MFB) to stimulate dopamine release. A carbon-fiber microelectrode (CFME) was placed in the nucleus accumbens to measure dopamine. Electrophysiological (E-phys) array was placed in the contralateral hippocampus to measure action potentials. (B) Raster plots of single-trail responses of a neuron to MFB stimulation (indicated by red bar). (C) Peri-event histogram for the five stimulations (bin size = 100 ms). Inset to the right shows the average waveform of the neuron with colors indicating the signal acquired from each of the two electrodes of the stereotrode. (D) Average change in dopamine concentration in response to MFB stimulation (±SEM). Inset displays a characteristic dopamine voltammogram. (E) Average color plot of dopamine measurement with time on the x-axis, voltage on the y-axis, and current shown in false color.
Importantly, the DANA system expands upon the single-sensor approach by allowing measurement of neural activity from electrode arrays and thus the ability to investigate the activities of ensembles of individual neurons. As stated above, the use of a 16-stereotrode array allowed multiple neurons to be measured simultaneously (Figure 4). Average dopamine release and reuptake (n = 5 stimulations) is shown (Figure 4A) along with peri-event histograms of 11 simultaneously recorded neurons (Figure 4B). To our knowledge, this is the first report in which many neurons (>3) were measured in conjunction with real-time dopamine concentration. Throughout the course of these experiments, 119 hippocampal neurons (n = 3 rats) were acquired. To determine if the net effect of MFB stimulation was excitatory or inhibitory, we categorized neurons according to their average response to MFB stimulation using a paired t test based on the firing rate for the 5 s interval preceding and following MFB stimulation. Of these neurons, 21% (25/119) were excited by MFB stimulation, 5% (6/119) were inhibited, and 74% (88/119) were unresponsive (Figure 4C). Although preliminary, this result suggests that, of the subset of responsive neurons, the main effect of MFB stimulation was excitation. These data emphasize the utility of combining multielectrode arrays with neurochemical measurement as arrays allow large samples of individual neurons to be acquired per experiment. Thus, a more complete picture of neural responses to neuromodulator release can be formed. Such observations highlight the power of the DANA system to directly investigate chemical neuromodulation through measurement of concomitant dopamine release and neural activity, linking chemistry to physiology.
Figure 4.

Multiple single-neuron action potentials measured concurrently with dopamine release. (A) Average evoked dopamine release as seen in Figure 3 (shown for clarity, n = 5 stimulations, ±SEM). Inset displays characteristic dopamine voltammogram. (B) Peri-event histograms from 11 hippocampal neurons simultaneously measured at the 16-stereotrode array (bin size = 100 ms). Histograms are color coded in accordance with the designations described in part C. Inset to the right shows the average waveform of the neuron with colors indicating the signal acquired from each of the two electrodes of the stereotrode. The scale bars placed to the right of the waveforms indicate 25 μV. (C) Pie chart showing the fraction of all recorded neurons (n = 3 rats, 119 cells total) with firing rates that were categorized as unresponsive, excited, or inhibited following MFB stimulation. Responsiveness was determined by performing a paired t test comparing the firing rate for the five-second interval preceding and following MFB stimulation (n = 5 stimulations).
Concurrent Measurement of Spontaneous Striatal Dopamine Release and Activity of Multiple Striatal Neurons.
To investigate neuronal responses to endogenous dopamine release in the striatum, a 16-stereotrode electro-physiological array and carbon-fiber microelectrode were lowered into the dorsal striatum of an anesthetized rat (Figure 5) and verified histologically to be less than 1 mm apart. A dopamine-reuptake inhibitor (20 mg/kg GBR-12909 i.p., 40 min prior to recording) and a D2 receptor antagonist (1 mg/kg eticlopride i.p., 20 min prior to recording) were given to pharmacologically induce spontaneous dopamine release. As anticipated, having the carbon-fiber microelectrode and array in close proximity resulted in an increase in the scanning artifact observed in the electrophysiological signal from ~2 to ~4 mV. Nonetheless, this increase was not sufficient to necessitate use of the SSR. In total, 40 well-defined dopamine release events (criterion, peak current >1 nA; no release >2 s prior to the leading edge of the event) were identified during the 20 min recording period (Figure 5A,B). During this time period, the firing of 11 striatal neurons were also monitored (Figure 5C). Over half of the neurons measured (55%, 6/11) were found to be excited during the increase in dopamine concentration as determine by a paired t test (n = 40 events). These results show that the DANA system can be used to record electrophysiology and dopamine release within the same brain region and that the FSCV measurements retain the sensitivity required to measure endogenous dopamine release. More broadly, these data illustrate how the DANA could be used to investigate scientific questions such as determining how populations of neurons in the striatum respond to local dopamine release. For example, these illustrative data suggest that single-neuron responses to dopamine release events are heterogeneous with approximately half of the population of striatal neurons responding with increased activity and half being unresponsive. Further experiments could determine if these physiological differences correspond to specific neuronal subtypes (e.g., D1 or D2 receptor expressing neurons).
Figure 5.

Concurrent measurement of striatal dopamine release and activity from multiple striatal neurons. (A) Average color plot for 40 pharmacologically induced dopamine release events aligned to the leading edge of each event with time on the x-axis, voltage on the y-axis, and current shown in false color. (B) Average change in dopamine concentration (±SEM). Inset displays the average of the 40 dopamine voltammograms (x-axis, −0.4 to 1.3 V; y-axis, −1.0 to 1.6 nA). (C) Peri-event histograms from 11 striatal neurons simultaneously measured from the 16-stereotrode array (bin size = 100 ms). Histograms are color coded in accordance with the designations described in part D. Inset to the right shows the average waveform of the neuron with colors indicating the signal acquired from each of the two electrodes of the stereotrode. The scale bars placed to the right of the waveforms indicate 20 μV. (D) Pie chart showing the fraction of neurons (n = 11 cells) with firing rates that were categorized as unresponsive or excited by dopamine release. Responsiveness was determined by performing a paired t test comparing baseline firing rate (1-s interval beginning 2 s before the leading edge of the release event) to the firing rate during the event (the 1-s interval following the start of the release event, n = 40 events). Concurrent measurement of striatal dopamine release and activity from multiple striatal neurons. (A) Average color plot for 40 pharmacologically induced dopamine release events aligned to the leading edge of each event with time on the x-axis, voltage on the y-axis, and current shown in false color. (B) Average change in dopamine concentration (±SEM). Inset displays the average of the 40 dopamine voltammograms (x-axis, −0.4 to 1.3 V; y-axis, −1.0 to 1.6 nA). (C) Peri-event histograms from 11 striatal neurons simultaneously measured from the 16-stereotrode array (bin size = 100 ms). Histograms are color coded in accordance with the designations described in part D. Inset to the right shows the average waveform of the neuron with colors indicating the signal acquired from each of the two electrodes of the stereotrode. The scale bars placed to the right of the waveforms indicate 20 μV. (D) Pie chart showing the fraction of neurons (n = 11 cells) with firing rates that were categorized as unresponsive or excited by dopamine release. Responsiveness was determined by performing a paired t test comparing baseline firing rate (1-s interval beginning 2 s before the leading edge of the release event) to the firing rate during the event (the 1-s interval following the start of the release event, n = 40 events).
Combined Measurement of Striatal Dopamine Release and Single-Neuron/Local-Field Activity in the Hippocampus of a Freely Moving Rat.
Use of the DANA in freely behaving animals would allow the investigation of questions that link behavior to physiology and neuromodulation. For example, interactions between neural activity in the hippocampus and the striatum are thought to drive context-induced relapse to drug seeking given involvement of the hippocampus in memory formation41 and involvement of the striatum in reinforcement learning.42 Furthermore, activation of the hippocampus can trigger dopamine release in the striatum.43,44 For these reasons we tested the DANA system in a freely moving animal chronically implanted with a carbon-fiber microelectrode and electrophysiological array in the dorsal striatum and dorsal hippocampus, respectively (Figure 6). To assess the capacity of the DANA to resolve a well-characterized oscillation in the local-field potential, we gave the rat a subanesthetic injection (i.p.) of ketamine (20 mg/kg) after a 30 min baseline period as ketamine induces a high-frequency oscillation (>90 Hz) in the hippocampus.45,46 Identifying an electrophysiological or dopaminergic response to ketamine is of scientific interest as little is known regarding how ketamine alters dopaminergic transmission or single-unit activity given ketamine’s capacity to affect multiple receptor systems. To determine how ketamine alters dopamine release, the MFB was stimulated every 5 min (Figure 6A). Local-field potentials and firing activity of a hippocampal neuron were also recorded (Figure 6B,C) during behavior.
Figure 6.

DANA system recording in a freely moving rat. Subplots indicate dopaminergic, single-neuron, and local-field potential response to ketamine injection (i.p., 20 mg/kg) at t = 0 min. (A) Percent change in electrically evoked dopamine from average predrug value. Inset displays average pre- and postdrug current vs time traces (30 min period, ±SEM). (B) Firing rate of a hippocampal neuron (bin size = 1 min) measured concurrently with the dopamine signal reported in part A. The firing rate of the neuron decreased ~5 min following ketamine injection. Inset shows average waveform of this neuron as measured at a single electrophysiological electrode. Red dashes indicate times of MFB stimulation used to evoke dopamine release measured in part A. (C) Spectral power of high-frequency (100–160 Hz) oscillations in the hippocampus in response to ketamine injection. Power was computed as the RMS value of the band-pass filtered signal. In agreement with previous studies, the power of high-frequency oscillatory activity increased following ketamine injection. Insets are sample traces of oscillations before (left) and after (right) ketamine injection.
Results from this single example indicated that ketamine triggered a lasting (>50 min) reduction of evoked dopamine release and firing activity of the hippocampal neuron (Figure 6A,B). The decrease in firing activity of the hippocampal neuron could be due to ketamine’s action as an NMDA antagonist.47 The decrease in dopamine release is interesting as we predicted that the ketamine injection would enhance evoked release given that ketamine is a drug of abuse. However, this decrease could be due to ketamine’s binding to D2 autoreceptors,47 as D2 agonists have been shown to reduce electrically evoked release.9 Thus, evoked dopamine release could be reduced by ketamine acting as a D2 receptor agonist. We also measured the root-mean-squared power of the band-passed (100–160 Hz) local-field signal from the same array of electrodes, and, in agreement with previous results,45,46 observed that ketamine triggered a notable increase in high-frequency oscillatory power (Figure 6C). Although well-studied, the mechanisms underlying this oscillation are not fully understood. The DANA system may be able aid in these efforts by allowing investigation of the contribution of neuromodulation to this activity.
This proof-of-concept measurement of dopamine release and neural activity in a freely moving animal showcases the distinctive capabilities of the DANA system and its potential to uncover new information regarding the dynamic role that neuromodulators and neural ensembles play in organizing behavior.
CONCLUSION
A new platform for the integrated measurement of single-unit/local-field electrophysiology using high-density electrode arrays and dopamine dynamics using carbon-fiber microelectrodes has been described herein. This device creates new opportunities for the investigation of questions currently unaddressed in neuroscience as little is known regarding how the activities of ensembles of neurons are affected by neuromodulation. The DANA system can be utilized to probe interactions between behavior, neural activity, and endogenous neuromodulator release. Excitingly, this system is not limited to measurements of dopamine and may be used to monitor effects of any neurochemical measurable by FSCV.48
Supplementary Material
ACKNOWLEDGMENTS
We thank University of Arizona and NSF Grant 1450767 (S.L.C. and M.L.H.) for funding this work. Kate L. Parent was funded through NIH Grsnt T32-GM00804. We thank Drew C. Farrell for photography of the SSR and Mitchell J. Bartlett for assistance with ketamine administration.
Footnotes
Supporting Information
The Supporting Information is available free of charge on the ACS Publications website at DOI: 10.1021/acs.analchem.6b03642.
Carbon-fiber microelectrode and stereotrode fabrication; photographic image and circuit diagram of SSR; flow-cell calibration of carbon-fiber microelectrodes; schematic of template matching procedure; table of recovery time for various frequencies; example of rapid action potential recovery; simultaneous measurement of single-neuron activity and dopamine release with SSR; and multiple single-neuron activities measured with dopamine release using SSR (PDF)
The authors declare the following competing financial interest(s): Dr. Michael Heien declares an actual or potential financial conflict of interest and is co-founder/equity holder in Knowmad Technologies, a licensee of University of Arizona (UA) intellectual property used in this research. This relationship has been disclosed to the UA Institutional Review Committee and is managed by a Financial Conflict of Interest Management Plan.
REFERENCES
- (1).Abercrombie ED; Jacobs BL Brain Res. 1985, 358 (1–2), 27–33. [DOI] [PubMed] [Google Scholar]
- (2).Yim CY; Mogenson GJ Brain Res. 1986, 369 (1–2), 347–352. [DOI] [PubMed] [Google Scholar]
- (3).Arbuthnott GW; Ingham CA; Wickens JR J. Anat 2000, 196, 587–596. [DOI] [PMC free article] [PubMed] [Google Scholar]
- (4).Edelmann E; Lessmann V Front. Synaptic Neurosci 2011, 3, 6. [DOI] [PMC free article] [PubMed] [Google Scholar]
- (5).Wise RA Nat. Rev. Neurosci 2004, 5 (6), 483–494. [DOI] [PubMed] [Google Scholar]
- (6).Arias-Carrión O; Pŏppel E Acta Neurobiol. Exp. (Wars) 2007, 67 (4), 481–488. [DOI] [PubMed] [Google Scholar]
- (7).Hebb DO The Organization of Behavior; John Wiley & Sons, Inc.: New York, 1949. [Google Scholar]
- (8).Harris KD; Csicsvari J; Hirase H; Dragoi G; Buzsáki G Nature 2003, 424 (6948), 552–556. [DOI] [PubMed] [Google Scholar]
- (9).Venton BJ; Wightman RM Anal. Chem 2003, 75 (19), 414A–421A. [Google Scholar]
- (10).Phillips PEM; Robinson DL; Stuber GD; Carelli RM; Wightman RM In Drugs of Abuse; Neurological Reviews and Protocols, Vol. 79; Humana Press: Totowa, NJ, 2003; pp 443–464. [Google Scholar]
- (11).Cheer JF; Heien MLAV; Garris PA; Carelli RM; Wightman RM Proc. Natl. Acad. Sci. U. S. A 2005, 102 (52), 19150–19155. [DOI] [PMC free article] [PubMed] [Google Scholar]
- (12).Hafting T; Fyhn M; Molden S; Moser M-B; Moser EI Nature 2005, 436 (7052), 801–806. [DOI] [PubMed] [Google Scholar]
- (13).Fuster JM; Alexander GE Science (Washington, DC, U. S.) 1971, 173 (3997), 652–654. [DOI] [PubMed] [Google Scholar]
- (14).Baeg EH; Kim YB; Huh K; Mook-Jung I; Kim HT; Jung MW Neuron 2003, 40 (1), 177–188. [DOI] [PubMed] [Google Scholar]
- (15).Buzsáki G Nat. Neurosci 2004, 7 (5), 446–451. [DOI] [PubMed] [Google Scholar]
- (16).Renshaw B; Forbes A; Morison BR J. Neurophysiol 1939, 3 (1), 74–105. [Google Scholar]
- (17).Li C-L; Jasper H J. Physiol 1953, 121 (1), 117–140. [DOI] [PMC free article] [PubMed] [Google Scholar]
- (18).Gold C J. Neurophysiol 2006, 95 (5), 3113–3128. [DOI] [PubMed] [Google Scholar]
- (19).Buzsáki G; Anastassiou CA; Koch C Nat. Rev. Neurosci 2012, 13 (6), 407–420. [DOI] [PMC free article] [PubMed] [Google Scholar]
- (20).Benchenane K; Peyrache A; Khamassi M; Tierney PL; Gioanni Y; Battaglia FP; Wiener SI Neuron 2010, 66 (6), 921–936. [DOI] [PubMed] [Google Scholar]
- (21).Fujisawa S; Buzsáki G Neuron 2011, 72 (1), 153–165. [DOI] [PMC free article] [PubMed] [Google Scholar]
- (22).Sohal VS Biol. Psychiatry 2012, 71 (12), 1039–1045. [DOI] [PMC free article] [PubMed] [Google Scholar]
- (23).Phillips PEM; Stuber GD; Heien MLAV; Wightman RM; Carelli RM Nature 2003, 422 (6932), 614–618. [DOI] [PubMed] [Google Scholar]
- (24).Zachek MK; Takmakov P; Park J; Wightman RM; McCarty GS Biosens. Bioelectron 2010, 25 (5), 1179–1185. [DOI] [PMC free article] [PubMed] [Google Scholar]
- (25).Park J; Takmakov P; Wightman RM J. Neurochem 2011, 119 (5), 932–944. [DOI] [PMC free article] [PubMed] [Google Scholar]
- (26).Fox ME; Mikhailova MA; Bass CE; Takmakov P; Gainetdinov RR; Budygin EA; Wightman RM Proc. Natl. Acad. Sci. U. S. A 2016, 113 (25), 6985–6990. [DOI] [PMC free article] [PubMed] [Google Scholar]
- (27).Armstrong-James M; Millar J; Kruk ZL Nature 1980, 288 (5787), 181–183. [DOI] [PubMed] [Google Scholar]
- (28).Takmakov P; McKinney CJ; Carelli RM; Wightman RM Rev. Sci. Instrum 2011, 82 (7), 074302. [DOI] [PMC free article] [PubMed] [Google Scholar]
- (29).Howe AG; Wassum KM; Blair HT Simultaneous in-vivo single-unit recording and fast-scan cyclic voltammetry in the behaving rat. Program No. 267.16 2015 Neuroscience Meeting Planner. Chicago, IL: Society for Neuroscience, 2015. Online. [Google Scholar]
- (30).Bolam JP; Hanley JJ; Booth PA; Bevan MD J. Anat 2000, 196 (4), 527–542. [DOI] [PMC free article] [PubMed] [Google Scholar]
- (31).Ihalainen JA; Riekkinen P Jr.; Feenstra MG Neurosci. Lett 1999, 277 (2), 71–74. [DOI] [PubMed] [Google Scholar]
- (32).Smith WB; Starck SR; Roberts RW; Schuman EM Neuron 2005, 45 (5), 765–779. [DOI] [PubMed] [Google Scholar]
- (33).Wanjerkhede SM; Bapi RS; Mytri VD Neurocomputing 2014, 138, 27–40. [Google Scholar]
- (34).McNaughton BL; O’Keefe J; Barnes CA J. Neurosci. Methods 1983, 8 (4), 391–397. [DOI] [PubMed] [Google Scholar]
- (35).Laude ND; Atcherley CW; Heien ML Anal. Chem 2012, 84 (19), 8422–8426. [DOI] [PubMed] [Google Scholar]
- (36).Clark JJ; Sandberg SG; Wanat MJ; Gan JO; Horne EA; Hart AS; Akers CA; Parker JG; Willuhn I; Evans SB; Stella N; Phillips PEM Nat. Methods 2010, 7 (2), 126–129. [DOI] [PMC free article] [PubMed] [Google Scholar]
- (37).Vreeland RF; Atcherley CW; Russell WS; Xie JY; Lu D; Laude ND; Porreca F; Heien ML Anal. Chem 2015, 87 (5), 2600–2607. [DOI] [PMC free article] [PubMed] [Google Scholar]
- (38).Paxinos G; Watson C The Rat Brain in Stereotaxic Coordinates; Elsevier Academic Press: Amsterdam, The Netherlands, 2007; pp 547–612. [Google Scholar]
- (39).Heien MLAV; Johnson MA; Wightman RM Anal. Chem 2004, 76 (19), 5697–5704. [DOI] [PubMed] [Google Scholar]
- (40).Buzsáki G Rhythms of the Brain; Oxford University Press: Oxford, U.K., 2006. [Google Scholar]
- (41).Chowdhury R; Guitart-Masip M; Bunzeck N; Dolan RJ; Duzel E J. Neurosci 2012, 32, 14193–14204. [DOI] [PMC free article] [PubMed] [Google Scholar]
- (42).Hart AS; Rutledge RB; Glimcher PW; Phillips PEM J. Neurosci 2014, 34 (3), 698–704. [DOI] [PMC free article] [PubMed] [Google Scholar]
- (43).Legault M; Wise RA Synapse 1999, 31 (4), 241–249. [DOI] [PubMed] [Google Scholar]
- (44).Legault M; Wise RA Eur. J. Neurosci 2001, 13 (4), 819–828. [DOI] [PubMed] [Google Scholar]
- (45).Hunt MJ; Falinska M; Łeski S; Wójcik DK; Kasicki S J. Psychopharmacol 2011, 25 (6), 808–821. [DOI] [PubMed] [Google Scholar]
- (46).Caixeta FV; Cornélio AM; Scheffer-Teixeira R; Ribeiro S; Tort ABL Sci. Rep 2013, 3, 2348. [DOI] [PMC free article] [PubMed] [Google Scholar]
- (47).Kapur S; Seeman P Mol. Psychiatry 2002, 7 (8), 837–844. [DOI] [PubMed] [Google Scholar]
- (48).Robinson DL; Hermans A; Seipel AT; Wightman RM Chem. Rev 2008, 108 (7), 2554–2584. [DOI] [PMC free article] [PubMed] [Google Scholar]
Associated Data
This section collects any data citations, data availability statements, or supplementary materials included in this article.