

ABSTRACT
Although process intensification by continuous operation has been successfully applied in the chemical industry, the biopharmaceutical industry primarily uses fed-batch, rather than continuous or perfusion methods, to produce stable monoclonal antibodies (mAbs) from Chinese hamster ovary (CHO) cells. Conventional fed-batch bioreactors may start with an inoculation viable cell density (VCD) of ~0.5 × 10⁶ cells/mL. Increasing the inoculation VCD in the fed-batch production bioreactor (referred to as N stage bioreactor) to 2–10 × 106 cells/mL by introducing perfusion operation or process intensification at the seed step (N-1 step) prior to the production bioreactor has recently been used because it increases manufacturing output by shortening cell culture production duration. In this study, we report that increasing the inoculation VCD significantly improved the final titer in fed-batch production within the same 14-day duration for 3 mAbs produced by 3 CHO GS cell lines. We also report that other non-perfusion methods at the N-1 step using either fed batch or batch mode with enriched culture medium can similarly achieve high N-1 final VCD of 22–34 × 106 cells/mL. These non-perfusion N-1 seeds supported inoculation of subsequent production fed-batch production bioreactors at increased inoculation VCD of 3–6 × 10⁶ cells/mL, where these achieved titer and product quality attributes comparable to those inoculated using the perfusion N-1 seeds demonstrated in both 5-L bioreactors, as well as scaled up to 500-L and 1000-L N-stage bioreactors. To operate the N-1 step using batch mode, enrichment of the basal medium was critical at both the N-1 and subsequent intensified fed-batch production steps. The non-perfusion N-1 methodologies reported here are much simpler alternatives in operation for process development, process characterization, and large-scale commercial manufacturing compared to perfusion N-1 seeds that require perfusion equipment, as well as preparation and storage vessels to accommodate large volumes of perfusion media. Although only 3 stable mAbs produced by CHO cell cultures are used in this study, the basic principles of the non-perfusion N-1 seed strategies for shortening seed train and production culture duration or improving titer should be applicable to other protein production by different mammalian cells and other hosts at any scale biologics facilities.
KEYWORDS: Non-perfusion N-1 seed culture, inoculation density, process intensification, CHO cell culture manufacturing, monoclonal antibody
Introduction
In the chemical industry, process intensification is defined as the development of innovative equipment, techniques or methods that offer drastic improvements in manufacturing, substantially decreasing equipment volume, energy consumption, or waste formation, and ultimately leading to cheaper, safer, and/or sustainable technologies.1 Process intensification has been used for decades in the traditional chemical industry using continuous operation methods to improve process yield, product value and reduce facility footprints.1–5 However, the implementation of continuous manufacturing has faced more challenges in the younger and more dynamic biotechnology industry.6,7 Based on the host cell used, biotechnology processes are either microbial fermentations or mammalian cell cultures. Progress of continuous operations has been made in some cases, including microbial fermentations for bulk chemicals such as bio-ethanol.6–8 Implementation of continuous operations or perfusion in mammalian cell culture in commercial manufacturing facilities has not been as rapid due to much smaller processing capacity with much higher product value, more complicated quality standards and stringent regulatory requirements for biopharmaceutical products such as monoclonal antibodies (mAbs).9–11 Mammalian systems can be more difficult to operate compared to microbial fermentations due to slower growth rates, complex media systems, and process parameter controls. Nevertheless, there have been substantial advances, including process intensification in mammalian fed-batch cell culture development over the last 30 years. Since the 1980s, manufacturing titers have improved from tens of mg/L to ~3 g/L in the 2010s by cell line engineering,12–14 media development15–18, and process control improvements19–21 achieving higher specific productivities (QP) increased peak viable cell densities (VCD), and prolonged production durations.22–24 Mammalian cell culture using fed-batch operations has not completely matured as titers greater than 10 g/L titer have only recently, but periodically, been reported,25–28 which indicates that potential remains for further cost reductions using fed-batch operation in the future.
The advantages of perfusion cell culture for achieving high VCD to enhance recombinant protein productivity were realized in the early 1980s.29,30 Perfusion cell culture requires equal volumes of fresh media continuously added and spent media removed, while retaining the cells in the bioreactor by use of perfusion equipment such as alternating tangential flow (ATF) devices, cross-flow filters, centrifuges or settlers.31,32 Thus, a higher VCD and volumetric productivity can be achieved with long durations of up to months compared to fed-batch production cultures with durations of 10–20 days.33,34 Perfusion production cell culture has been successfully applied to produce cells or viruses as the intended product35 and to manufacture some very low titer or unstable proteins and enzymes.34 In addition to perfusion alone, different hybrid modes of perfusion and fed-batch production culture have been studied, including concentrated fed-batch culture36,37 and hybrid fed-batch with perfusion culture for the early cell growth phase and fed-batch for the late protein production phase.38
Although a number of companies have been working on the development of perfusion production processes, only some, e.g., Boehringer Ingelheim, Genzyme, Bayer, have used perfusion as a platform for stable mAb production, while others, e.g., Takeda, Wuxi Biologics, have used both fed-batch and perfusion depending on different mAb products. Perfusion cell culture in production bioreactors has not been widely applied for the manufacture of stable protein products because of the complex process control, large volumes of perfusion media, and challenges for process development and process characterization.9 Fed-batch processes have been established from lab to commercial scales up to 25,000-L, while perfusion processes are usually operated up to 1000-L. Although the perfusion mode achieves higher productivity with a higher manufacturing output than fed-batch operated at the same scale, fed-batch in a much larger commercial bioreactor can achieve a higher manufacturing output than perfusion. Two case studies on the conversion of perfusion back to fed-batch production for commercial manufacturing due to a high product demand have been reported.39,40
In comparison to applications of perfusion technology in the production bioreactors (N) discussed above, there has been recent interest in the application of perfusion cultures at the seed bioreactor (N-1) step.33,41,42 The N-1 perfusion strategy allows “intensification” of the cell growth in this last seed step to achieve much higher final VCDs of 15–100 × 106 cells/mL, which is significantly higher than what could be achieved using conventional N-1 seed culture methods, which usually reach < 5 × 10⁶ cells/mL. This allows a much higher inoculation VCD of 2–10 × 106 cells/mL in the production bioreactor compared to conventional inoculation densities of ~0.5 × 10⁶ cells/mL, which can reduce exponential growth phase and overall fed-batch production duration by 13–43% without affecting final titer and quality, and thus improve facility output (Table 1).43–45 The introduction of perfusion technology for the N-1 step is the most substantial advance for the seed train accomplished during the past two decades.46 To the best of our knowledge, an “intensified” method, or use of high inoculation for fed-batch production bioreactors with an inoculation VCD of >2 × 10⁶ cells/mL, has not been reported without the use of perfusion technology at the N-1 step.
Table 1.
Summary of perfusion N-1 seed culture studies in the literature.
| Perfusion N-1 study | Pohlscheidt et al. (2013)45 | Padawer et al. (2013)43 | Yang et al. (2014)44 |
|---|---|---|---|
| Perfusion equipment | Inclined settler | ATF | ATF |
| N-1 bioreactor (L) | 3000 | 3 | 4 |
| N-1 inoculation VCD (×106 cells/mL) | 2 | NA | NA |
| N-1 inoculation cell viability (%) | 98 | > 95 | ~98 |
| N-1 culture duration (day) | 5 | 6 | 5 |
| Perfusion medium used (L) | 4900 | 18 | 12 |
| N-1 final VCD (×106 cells/mL) | 13.8 | 24 | 40 |
| N-1 final cell viability (%) | 90 | > 95 | ~97 |
| Subsequent production bioreactor (L) | 400 | 3 | 4 |
| Produciton inoculation VCD from perfusion N-1 (×106 cells/mL) | 2 | 5 | 10 |
| Production duration from N-1 perfusion (days) | 14 | 8 | 12 |
| Production inoculation VCD from conventional N-1 (×106 cells/mL) | 0.6 | 0.2 | 0.4 |
| Production duration from conventional N-1 (days) | 16 | 14 | 17 |
| Production duration reduction by perfusion N-1 (%) | 13 | 43 | 29 |
Here, we present case studies for intensified (high inoculation VCD) fed-batch production processing without the use of perfusion at the N-1 step for the development of an industrially friendly, cell culture manufacturing process. In our study, the high VCD required for inoculation of the fed-batch process was achieved by intensifying the N-1 seed step using either batch culture plus an enriched batch media or by introducing fed-batch operation at the N-1 step, with both methods achieving a final VCD of 22–34 × 106 cells/mL. We demonstrated that the intensified fed-batch production with those non-perfusion alternatives achieved similar final titer and quality attributes compared to those using N-1 perfusion seeds. These enriched N-1 batch and fed-batch strategies to achieve high final VCDs without the need of a perfusion device as well as additional media were both successfully scaled up to 500-L or 1000-L production bioreactors for 3 different mAb processes. An often-overlooked area of process development for traditional fed-batch processes is inoculation density. Most development studies focus on a narrow range (0.25–1 × 10⁶ cells/mL). This work also highlights the value of exploring a much higher and broader range of inoculation density for the N stage bioreactor.
Results
Intensification of inoculation density can be used for titer improvement in fed-batch production culture
In order to research the effect of different inoculation densities and other related cell culture parameters on final product titer, fed-batch cell cultures for 3 mAbs expressed by 3 different CHO K1 GS cell lines were first evaluated using a design of experiments (DOE) design in 96 50-mL TubeSpin® bioreactors with automatically sampling and feeding handled by a Tecan liquid handler. High-throughput screening with TubeSpin® bioreactors has been effectively used as a scale-down model to simultaneously test many different conditions for cell culture medium development and titer improvement.47–50 In this TubeSpin® run, the factors screened were inoculation density, level of basal medium enrichment, day of first feed addition, and feed amount as a percentage of initial working volume per day. The inoculation density alone contributed the most to increasing the final titer for all 3 cell lines as shown in the leverage plots for cell line A (Figure 1: A-1), cell line B (Figure 1: B-1) and cell line C (Figure 1: C-1). Titer for cell line A increased more than 3-fold when the inoculation density was increased from 0.5 × 10⁶ to 6 × 10⁶ cells/mL at the optimal condition. A similar response was observed for both cell line B and C with titer increases of 1.7-fold and 2.3-fold, respectively, for the higher inoculation conditions.
Figure 1.
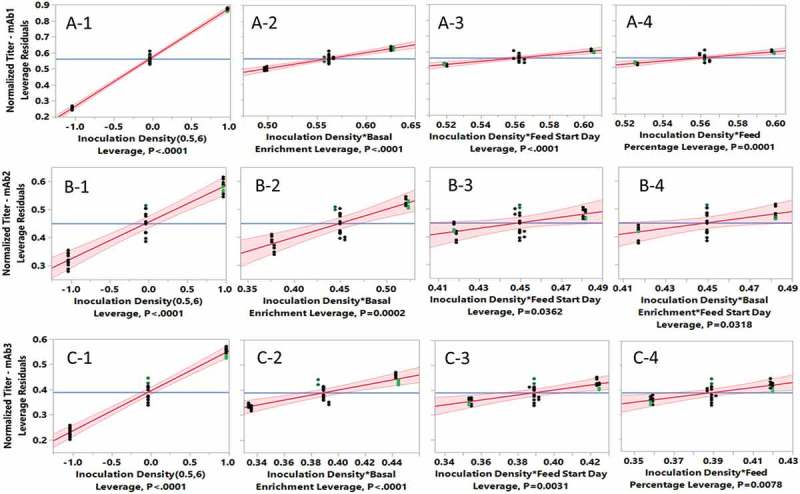
Effects of inoculation density, basal enrichment, feed start day and feed percentage on product titer by SAS JMP data analysis in high-throughput screening cell cultures run using 96 50-mL TubeSpin bioreactors with 32 conditions for each cell line (n = 1): A, cell line A for mAb1; B, cell line B for mAb2; C, cell line C for mAb3.
Although basal enrichment, feed start day and feed percentage alone did not improve titer (data not shown), there were significant interactions between inoculation density and each of these 3 parameters (Figure 1: A-2 to A-4, B-2 to B-4, and C-2 to C-4). The interaction between inoculation density and basal enrichment contributed most to the final titer for all 3 cell lines (Figure 1: A-2, B-2 and C-2). The importance of the basal production medium enrichment was attributed to the fact that the time of feeding cannot be earlier than day 0 and the maximum feed volume cannot exceed the vessel working volume. Enrichment of the basal medium was critical to fully unlock the benefit of high inoculation fed-batch culture. There was a significant interaction for the volume of daily feed (feed percentage) and inoculation density for cell lines A (Figure 1: A-4) and C (Figure 1: C-4), but that interaction was not significant for cell line B (data not shown). In addition to 2 level interactions, a significant 3 level interaction among inoculation density, basal enrichment and feed start day was found for cell line B (Figure 1: B-4), which makes cell culture optimization more challenging. In summary, it was concluded that the intensification of the inoculation density from conventional 0.5 × 10⁶ to 6 × 10⁶ cells/mL significantly improved final fed-batch production titer for 3 mAbs with the same duration of 14 days.
High final VCD can be achieved in non-perfusion CHO seed cultures
A conventional seed bioreactor culture that can achieve a final VCD of 2–5 × 10⁶ cells/mL is sufficient for a fed-batch production culture with an inoculation density near 0.5 × 10⁶ cells/mL.18 However, fed-batch production cultures using high inoculation densities (intensification) require a significantly larger cell mass at the N-1 seed culture stage. To the best of our knowledge, only perfusion N-1 seeds have been reported to achieve a final VCD > 15 × 106 cells/mL for inoculation of intensified fed-batch cell cultures using inoculation densities ≥2 × 10⁶ cells/mL.43,45 To assess whether non-perfusion alternatives for N-1 seed cultures could achieve sufficiently high VCD, 3 non-perfusion N-1 seed culture strategies, namely conventional batch, enriched batch, and fed-batch were compared with a perfusion N-1 culture (Figure 2 and Table 2).
Figure 2.
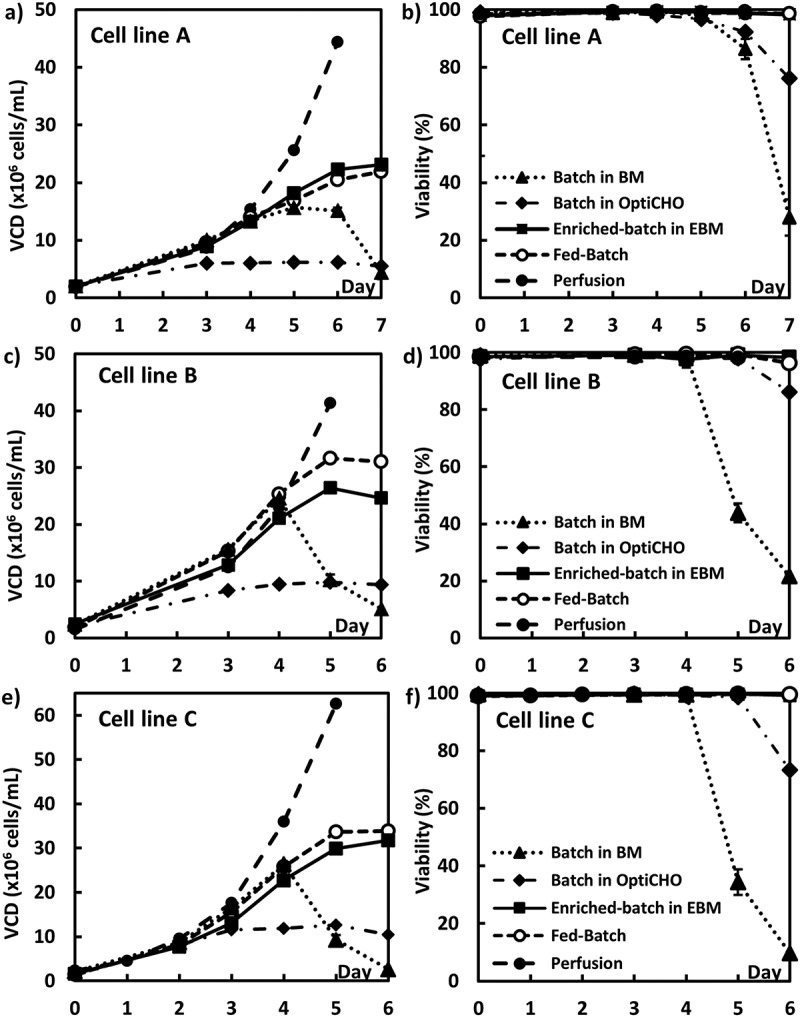
CHO cell growth profiles in batch mode using 3 different media (OptiCHO, BM and EBM), fed-batch mode and perfusion mode: A, VCD for cell line A; B, viability for cell line A; C, VCD for cell line B; D, viability for cell line B; E, VCD for cell line C; F, viability for cell line C.
Table 2.
Summary of N-1 seed culture performance parameters.
| Cell Line | N-1 Culture Mode | Growth Rate (hour−1) |
Peak VCD (× 106 cells/mL) |
Day 6 VCD (× 106 cells/mL) |
Day 6 Viability (%) |
|---|---|---|---|---|---|
| A | Batch in OptiCHO | 0.015 | 6 | 6 | 92 |
| Batch in BM | 0.022 | 15 | 15 | 86 | |
| Batch in EBM | 0.021 | 23 | 22 | 99 | |
| Fed-batch | 0.022 | 22 | 21 | 99 | |
| Perfusion | 0.021 | N/A | 44 | 99 | |
| B | Batch in OptiCHO | 0.017 | 10 | 9 | 86 |
| Batch in BM | 0.026 | 24 | 5 | 22 | |
| Batch in EBM | 0.023 | 26 | 25 | 99 | |
| Fed-batch | 0.026 | 32 | 3 | 99 | |
| Perfusion | 0.029 | N/A | 41 (day 5) | 99 (day 5) | |
| C | Batch in OptiCHO | 0.029 | 13 | 10 | 73 |
| Batch in BM | 0.032 | 26 | 3 | 10 | |
| Batch in EBM | 0.029 | 32 | 32 | 99 | |
| Fed-batch | 0.032 | 34 | 34 | 99 | |
| Perfusion | 0.029 | N/A | 62 (day 5) | 99 (day 5) |
The first experiments examined N-1 seed culture growth profiles of the 3 CHOK1 GS cell lines (2 × 10⁶ cells/mL initial inoculation density) in batch mode using 3 different batch media (Figure 2 and Table 2). The 3 batch seed culture media were OptiCHO, batch seed medium (BM) and enriched-batch seed medium (EBM) (Table 3). The relative nutrient levels, or enrichment for amino acids, vitamins, glucose, as well as osmolality increased with the order of OptiCHO < BM < EBM as shown in Table 3. Although there were cell growth differences among the different cell lines, the peak VCD for the batch seed cultures increased in the same order of OptiCHO, BM and EBM as increased nutrient enrichment (Table 3). All cell lines using the OptiCHO media had significantly lower VCD (6–13 × 106 cells/mL) and viability dropped to 73–86% on day 6 (Figure 2B, D, F), which would not be sufficient for inoculation of an intensified fed-batch production culture. Batch growth for the BM seed conditions achieved peak VCD values of 15–26 × 106 cells/mL, but the VCD (Figure 2A) and cell viability (Figure 2B) dropped significantly for cell line A from days 5–7 and for cell line B and C from days 4–6 (Figure 2C – 2F). Such a rapid decline in VCD and viability poses a risk for its implementation as an intensified N-1 culture method in manufacturing. The best results came from the EBM batch cultures that achieved peak VCDs of 23–32 × 106 cells/mL and high viabilities over the 6–7-day culture duration (Figure 2 and Table 2). Thus, the EBM condition was selected for use as the N-1 culture media condition for intensified fed-batch production. A well-fortified media was determined to be important for the N-1 seed cultures to achieve and maintain a suitably high final VCD as well as a stable high culture viability. However, it should be noted that too much medium enrichment could cause CHO cell growth inhibition in the N-1 seed cultures (data not shown), which occurs due to higher osmolality, higher concentrations of glucose, or other unidentified inhibition factors.
Table 3.
Medium nutrient concentrations.
| Medium | Total Amino Acids (mM) | Glucose (g/L) | Osmolality (mOsm/kg) |
|---|---|---|---|
| OptiCHO seed medium | 24 | 5 | 275 |
| Batch seed medium (BM) | 72 | 6 | 305 |
| Enriched-batch seed medium (EBM) | 108 | 12 | 370 |
| Enriched production basal medium | 126 | 12 | 415 |
| Feed medium for cell line A | 442 | 78 | 1550 |
| Feed medium for cell line B | 400 | 78 | 1450 |
| Feed medium for cell line C | 572 | 120 | 2000 |
In addition to batch N-1 cultures, the 3 cell lines were also evaluated in fed-batch and perfusion N-1 cultures (Table 2 and Figure 2). The feed used for the fed-batch N-1 culture was the same as that used for the fed-batch production culture. The fed-batch seed culture from cell line A achieved a peak VCD of 22 × 106 cells/mL, which was similar to the EBM batch culture condition (Figure 2A). The fed-batch seed cultures achieved peak VCDs of 32 × 106 and 34 × 106 cells/mL, respectively, for cell lines B and C (Figure 2C, E), both of which were slightly higher than the EBM batch culture condition. In addition, viabilities for seed cultures with all 3 cell lines in the fed-batch mode were very good at 99% for the entire duration (Figure 2). Perfusion N-1 culture is known to be able to maintain cells in an exponential growth stage and to achieve a high VCD. As expected, the perfusion N-1 cultures achieved significantly higher VCDs of 44 × 106, 41 × 106 and 62 × 106 cells/mL with excellent viabilities of 99% on day 5 for cell lines A, B, and C, respectively (Figure 2 and Table 2).
Non-perfusion N-1 seeds can be used for inoculation of intensified fed-batch production cell cultures
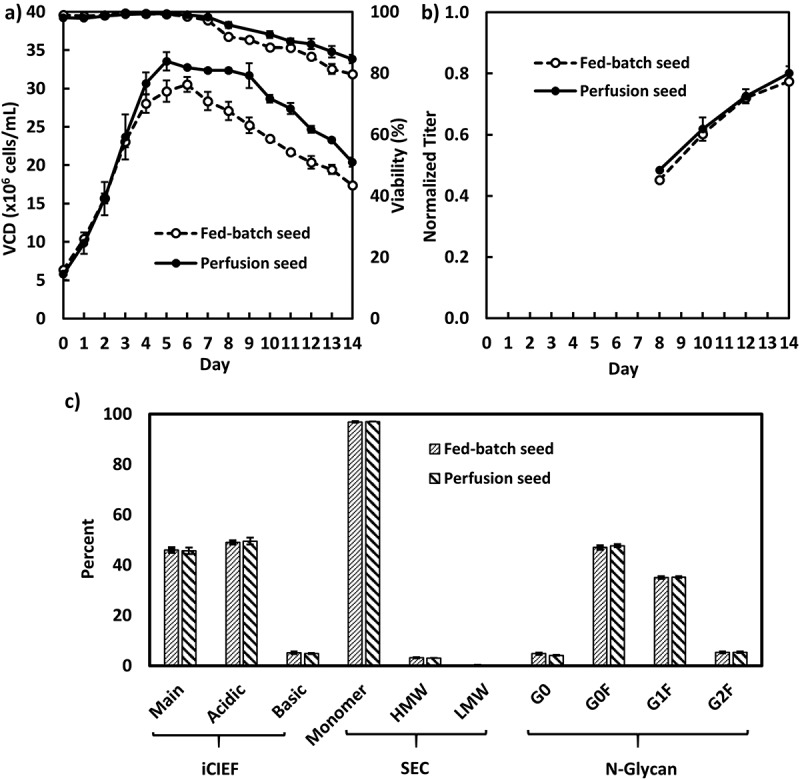
After demonstrating that non-perfusion N-1 seed cultures achieved high final VCD with very good viability, we next evaluated the performance for these N-1 seed culture conditions in the intensified fed-batch production cultures. The fed-batch production cultures for cell line A were inoculated using the same inoculation density of 5 × 10⁶ cells/mL (Figure 3A). The production culture inoculated with the perfusion N-1seed reached the highest peak cell density of 22 × 106 cells/mL, compared to 17 × 106 cells/mL for the production cultures inoculated with either the enriched-batch or the fed-batch N-1 seed (Figure 3A). Nevertheless, the normalized final titers of all production cultures were similar, ranging from 0.96 to 1.00 (Figure 3B). Thus, while the perfusion N-1 seed condition achieved a higher peak VCD, this did not result in a significant increase in the final titer for those cultures. Other metabolites, e.g., glucose, lactate, ammonium, and CO2, were similar for all fed-batch production cultures (data not shown). Most importantly, the product quality attributes, including charge variants, SEC impurity, and N-glycan profiles, were similar for all fed-batch production cultures regardless of how the N-1 seed was operated (Figure 3C).
Figure 3.
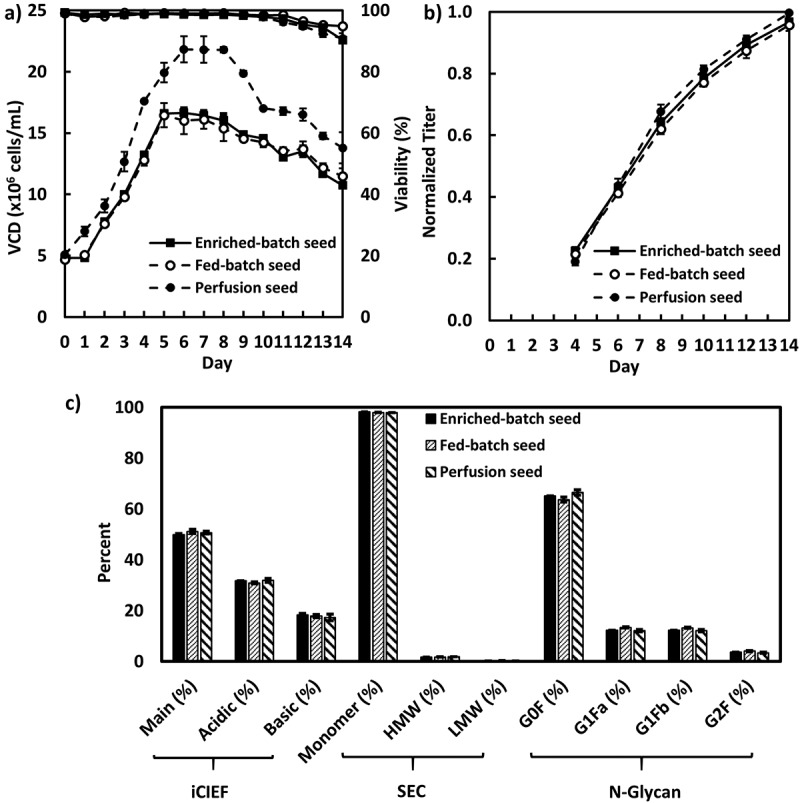
Fed-batch production cell culture performance inoculated with the enriched batch, fed-batch and perfusion N-1 seeds for cell line A in 5-L bioreactors (n = 2): A, VCD and viability; B, Product titer; C, product quality attributes.
For cell line B, the production cultures were each inoculated at a density of 3 × 10⁶ cells/mL using day 5 N-1 seeds cultivated in enriched batch, fed-batch and perfusion modes (Figure 4). Similar to cell line A, the fed-batch production culture inoculated using the perfusion N-1 seed achieved the highest peak VCD, but again, final titers were all similar amongst the N-1 conditions. All production cultures achieved similar normalized final titers of 0.33–0.36 (Figure 4B). Product quality attributes were also comparable across all the production cultures regardless of the origin of the N-1 seeds (Figure 4C).
Figure 4.
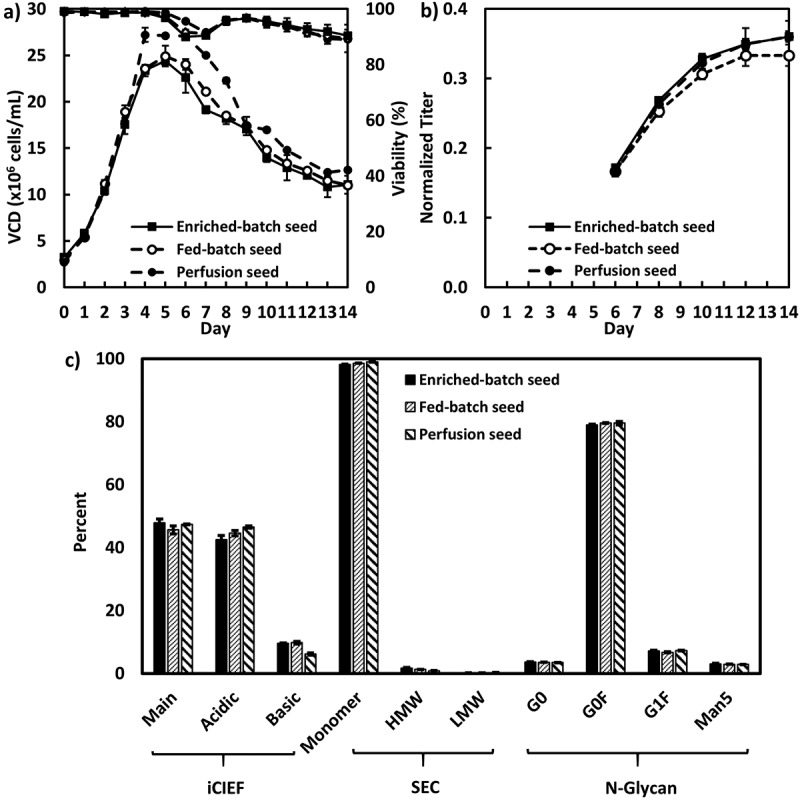
Fed-batch production cell culture performance inoculated with the enriched batch, fed-batch and perfusion N-1 seeds for cell line B in 5-L bioreactors (n = 2): A, VCD and viability; B, Product titer; C, product quality attributes.
For cell line C, the production cultures were inoculated at a density of 6 × 10⁶ cells/mL using day 5 N-1 seeds cultivated originating from either fed-batch or perfusion mode (Figure 5). Again, both production cultures showed similar titer and product quality attributes.
Figure 5.
Fed-batch production cell culture performance inoculated with fed-batch and perfusion N-1 seeds for cell line C in 5-L bioreactors (n = 2): A, VCD and viability; B, Product titer; C, product quality attributes.
Intensified fed-batch processes using non-perfusion N-1 seeds can be scaled up in 500-L or 1000-L bioreactors
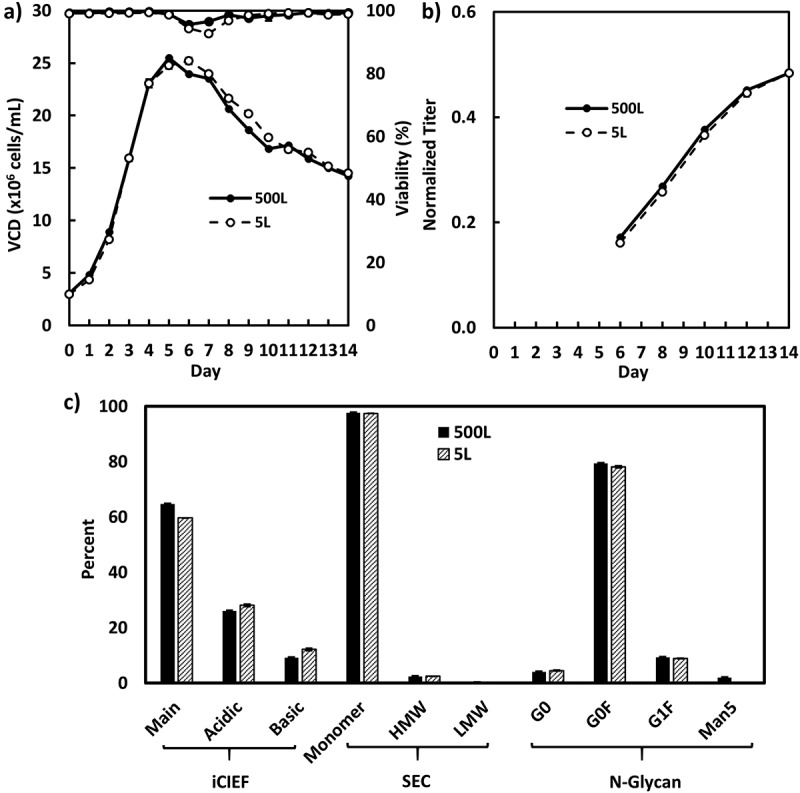
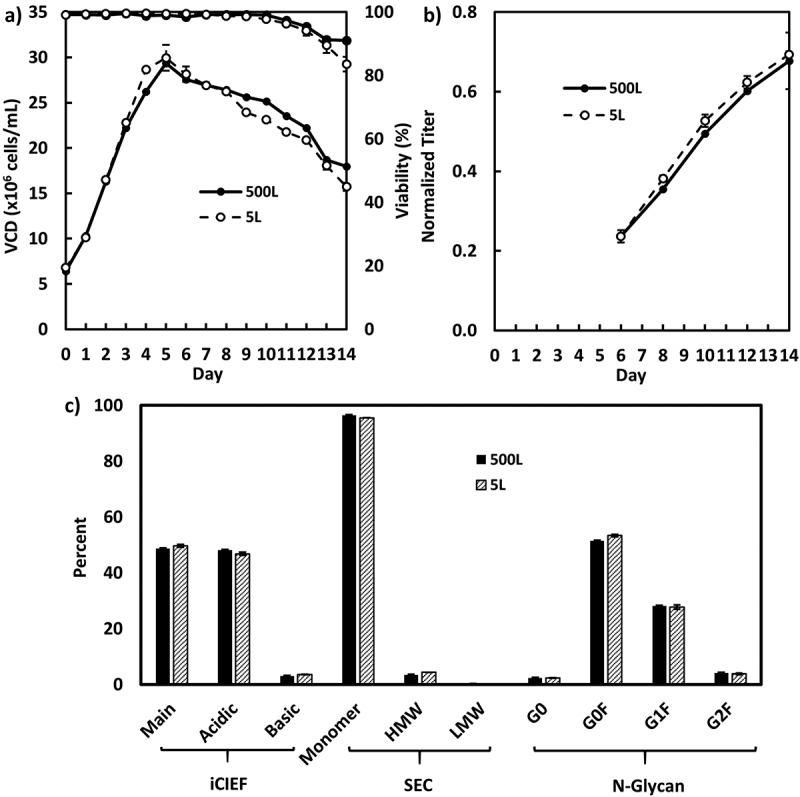
The enriched batch N-1 seeds for cell line A and B were used for inoculation of intensified fed-batch production cultures in 1000-L (Figure 6) and 500-L bioreactors (Figure 7), respectively, while the fed-batch N-1 seeds for cell line C were used for inoculation of intensified fed-batch production cultures in a 500-L bioreactor (Figure 8). All 3 intensified fed-batch processes were shown to be robust and scalable in the 500-L or 1000-L bioreactors. The cell density, titer, and product quality profiles were consistent with those of the satellite cultures in 5-L bioreactors (Figures 6–8). For cell line A, the fed-batch production cultures were harvested on day 10 due to the exceptionally high titer exceeding the capacity for downstream purification.
Figure 6.
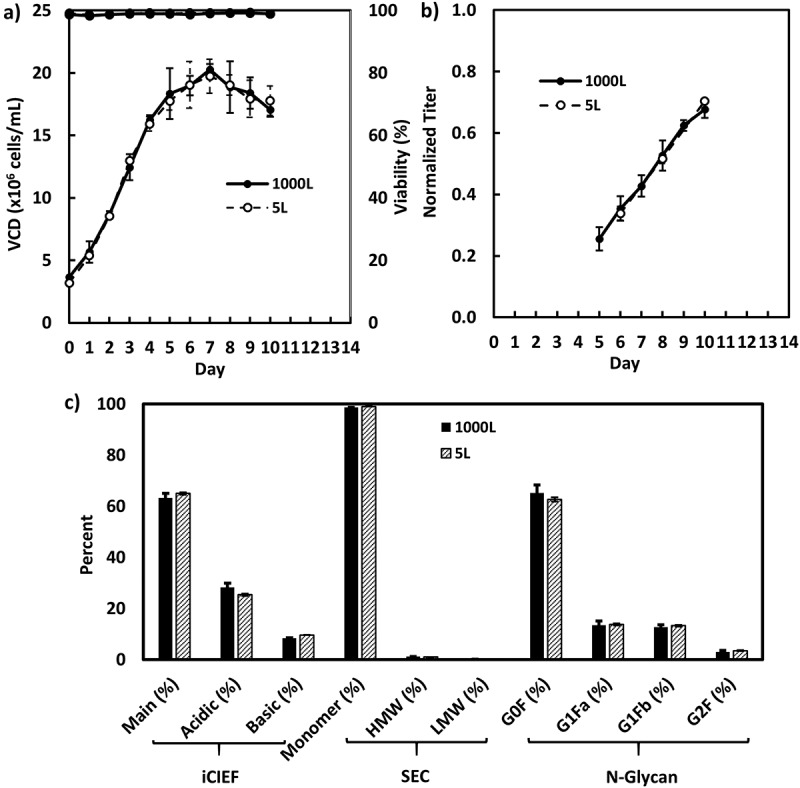
Fed-batch production cell culture performance inoculated with enriched batch N-1 seeds for cell line A in 1000-L (n = 3) and its satellite 5-L bioreactors (n = 2): A, VCD and viability; B, Product titer; C, product quality attributes.
Figure 7.
Fed-batch production cell culture performance inoculated with enriched batch N-1 seeds for cell line B in 500-L (n = 1) and its satellite 5-L bioreactors (n = 2): A, VCD and viability; B, Product titer; C, product quality attributes.
Figure 8.
Fed-batch production cell culture performance inoculated with fed-batch N-1 seeds for cell line C in 500-L (n = 1) and its satellite 5-L bioreactors (n = 2): A, VCD and viability; B, Product titer; C, product quality attributes.
Discussions
To the best of our knowledge, this is the first report for non-perfusion N-1 seed cultures to be comparable to perfusion N-1 seed cultures in subsequent intensified (using high inoculation VCD) fed-batch production bioreactors. We showed that the production bioreactors inoculated at initial VCD of 3–6 × 10⁶ cells/mL achieved similar titers within the same culture duration, regardless of whether perfusion or non-perfusion N-1 seeds were used to generate the inoculum (Figures 3–5). It has been reported that the fed-batch production culture duration can be shortened by 13–43% via use of a higher initial VCD of 2–10 × 106 cells/mL compared to conventional fed-batch processes with initial VCDs of 0.2–0.6 × 10⁶ cells/mL, with comparable titer and quality (Table 1).43–45 We report here that the intensified fed-batch cultures with an initial VCD at ≥3 × 10⁶ cells/mL produced significantly higher titers than the conventional fed-batch cultures with an initial VCD at 0.5 × 10⁶ cells/mL for 3 different mAb processes with the same duration of 14 days in the production bioreactor (Figure 1). Therefore, intensified initial VCD in production bioreactors can improve cell culture manufacturing output by either increasing the final titer or shortening the culture duration.
In addition, both non-perfusion and perfusion N-1 seeds, with much higher final VCD than the conventional N-1 seed, can be used to shorten seed train duration by inoculating a larger N production bioreactor for the same inoculation density with a smaller N-1 bioreactor. For example, a 5000-L production bioreactor with 3000-L initial working volume and 0.5 × 10⁶ cells/mL inoculation density, and non-perfusion N-1 enriched seed culture with a final VCD of 30 × 106 cells/mL can be inoculated with the enriched N-1 seed at only 50-L working volume N-1 bioreactor. The split ratio is about 1:67 using the enriched batch N-1 seed, which is much higher than the usual 1:5 or 1:10 ratio for a conventional fed-batch cell culture. Using the enriched batch seed to replace the conventional N-1 seed, at least one seed bioreactor step can be eliminated for the conventional 5000-L bioreactor production train.
In addition to product titer/output, quality attributes are important for cell culture manufacturing.18 Our study demonstrates that the intensified fed-batch production inoculated with the non-perfusion seeds exhibits good quality attributes, such as impurity, charge variants and N glycans, which were similar to the N-1 perfusion seed condition for all 3 mAbs (Figures 3–5). It should be noted that these 3 in-process quality attributes are the most common for cell culture manufacturing. Although more glucose was added in enriched basal media, we did not find atypical glycation concentrations in this study. For many mAbs and fusion proteins produced using this non-perfusion intensified fed-batch platform with our platform CHO GS cell lines, we only observed a few with high levels of glycation (unpublished data). The occurrence rate for high levels of glycation in final formulated drug substances is low, which indicates that the high-level glycation is more related to the protein itself rather than the intensified process. In comparison to conventional fed-batch processes with ~0.5 × 10⁶ cells/mL inoculation cell density, the intensified fed-batch processes inoculated with the non-perfusion seeds achieved higher VCD profiles (data not shown), which indicates that host cell proteins (HCP) could be higher at harvest. We did not measure HCP at harvest due to very high HCP values before purification regardless of inoculation sizes. Nonetheless, the HCP levels in final formulated drug substances were similar regardless of the inoculation cell densities for these 3 mAbs and many other proteins within our company. This indicates that our downstream platform process is sufficient to remove HCP generated from cell cultures regardless of different inoculation cell densities.
These alternative non-perfusion N-1 strategies provide advantages over the N-1 strategy using perfusion culture. As summarized in Table 1, the final VCD of 13.8–40 × 106 cells/mL is reported in perfusion N-1 seeds, which require perfusion equipment, a large amount of perfusion media and its storage vessel.43–45 In this study, the non-perfusion N-1 seeds also achieved similar final VCD range of 22–34 × 106 cells/mL (Table 2). Although the final intensified fed-batch production bioreactor can be initiated by either perfusion or non-perfusion N-1 strategies with equivalent results, the non-perfusion N-1 seed culture alternatives do not require additional perfusion equipment, nor large volumes of perfusion media as well as media storage vessels. Because of the limitation of large perfusion equipment and medium volume, it is more challenging to run perfusion N-1 in large commercial facilities. Pohlscheidt et al. reported that only 13.8 × 10⁶ cells/mL final VCD was achieved using perfusion N-1 at 3000-L scale, while the final cell viability dropped from 98% to 90% (Table 1).45 The production duration reduction by perfusion N-1 at 3000-L scale was only 13% in the subsequent 400-L production bioreactor.45 This is much less than 29–43% production duration reduction in lab-scale bioreactors by other reports (Table 1).43,44
Although we only presented our data on non-perfusion N-1 at 200-L scale to support 1000-L fed-batch production in clinical manufacturing facility, because no perfusion was required, operation using the non-perfusion N-1 seed cultures, with either enriched batch media or operation in fed-batch mode, should be applied at any manufacturing facility and is much simpler for process development, process characterization and validation compared to introducing perfusion operation at the N-1 seed culture step. These advantages with respect to cost and simpler operation for the non-perfusion N-1 strategies become more apparent when considering production in a large-scale commercial manufacturing setting, such as with >3000-L N-1 seed bioreactors and >15,000-L N production bioreactors. In contrast, there are minimal operational differences between non-perfusion N-1 and traditional N-1 batch seeds, regardless of manufacturing scale.
Enrichment of the medium for the N-1 step was critical for the non-perfusion intensified fed-batch cell culture development. In general, the medium used for vial thaw and seed expansion is lean to achieve high cell growth rates. The same lean medium is often used as the basal production medium for conventional fed-batch cell culture processes with low initial VCD, while optimization efforts to improve titer mainly focuses on developing the concentrated feed media.16 In this study, medium enrichment refers to adding feed medium components, including glucose, amino acids, and other nutrients, into N-1 batch seed medium and N production basal medium. Although CHO cell seed and basal production media are usually maintained between 260 and 320 mOsm/kg,51 the enriched media here reached an osmolality of 370–415 mOsm/kg (Table 3). We found that the enrichment of the production basal media had a synergistic effect with high inoculation VCD on improving titer for all 3 of the different mAb production processes using the high inoculation/intensified fed-batch strategy (Figure 1: A-2, B-2 and C-2). In addition, we found that the enriched N-1 batch seed media achieved higher final VCDs by supporting a longer culture duration at the N-1 stage (Figure 2A, C, E), which subsequently was sufficient to support the higher inoculation densities required to improve the production bioreactor step (Figures 3 and 4). Therefore, the enriched media were found to benefit both the non-perfusion batch N-1 seed to achieve higher final VCD, as well as the intensified fed-batch production step using the higher inoculation VCD, resulting in either higher final titers or shorter production bioreactor durations, or sometimes both.
In conclusion, we demonstrated that non-perfusion strategies for the N-1 seed cultures, e.g., enriched batch N-1 or fed-batch N-1, can be used for the inoculation of intensified fed-batch production with inoculation VCDs of 3–6 × 10⁶ cells/mL using CHO cells. The intensified production bioreactors utilizing these non-perfusion alternatives performed similarly to those using a perfusion culture at the seed stage with respect to comparable cell culture performance, titer and similar quality attributes for the mAb being expressed. To the best of our knowledge, only the perfusion N-1 strategy used to support intensified fed-batch production46 was reported prior to this study. These non-perfusion N-1 seed culture strategies have many advantages compared to the perfusion N-1 strategy. The non-perfusion N-1 strategies reported here are: (1) easy for cell culture process development and manufacturing; (2) do not require specialized perfusion equipment, nor require preparation and storage for large volumes of perfusion media; and (3) they are operationally familiar to most large-scale commercial manufacturing facilities. In future studies, we plan to further optimize these non-perfusion N-1 seed strategies in order to achieve higher final VCDs for intensified fed-batch production using mammalian cell culture.
Materials and methods
Cell line, media and seed expansion
Three CHO K1 GS cell lines, referred to as cell lines A, B and C, were used for expression of 3 proprietary human mAbs (IgG4 mAb1, IgG1 mAb2, and IgG1 mAb3, respectively). Proprietary chemically defined seed, basal, and feed media were used in this study (Table 3), of which OptiCHO (Cat# 12681011) was purchased from Thermo Fisher. Vial thaw and seed expansion steps for all 3 cell lines were performed using shake flasks (Corning Life Sciences) containing BM medium (Table 3) and cultivated in a humidified incubator (Climo-Shaker, Kuhner) using standard conditions of 36.5°C, 5% CO2 and 150 rpm. Cells were passaged every 3–4 days prior to N-1 seed inoculation.
N-1 seed cultures
The cells for batch and fed-batch N-1 seed cultures were grown either in 250-mL shake flasks with an initial culture volume of 80–100 ml or 2-L shake flasks with an initial volume of 1000 mL using those incubator conditions described above. Three different batch media, OptiCHO, BM, and EBM (Table 3), were used to evaluate batch seed cultures without feeding. The fed-batch N-1 cultures were grown in BM and fed daily starting from day 3 with 3% initial culture volume using the feed for each cell line as specified in Table 3.
Perfusion N-1 seed cultures were cultivated in 10-L cell bags (GE Healthcare) with a 5-liter initial culture volume. Rocking speed was controlled at 28 rpm with a 7° rocking angle. CO2 was controlled at 4% between day 0 and 1 and then turned off. The cell bag was equipped with 0.2-µm filter to perfuse the spent culture medium while retaining the cells. Fresh BM medium was added continuously and spent culture medium was continuously withdrawn at the same perfusion rates as follows: 0.5 volume of medium per culture volume per day (VVD) from days 2 to 4, 1.0 VVD from days 4 to 5, and 2.0 VVD from days 5 to 6.
Fed-batch production cultures
High-throughput screening using 96 50-mL TubeSpin® bioreactors was used to research the effect of intensified inoculation density on fed-batch product titer for 3 CHO cell lines with 32 conditions per cell line. The experimental design was a 3 × 3 × 3 × 3 I-Optimal custom DOE generated in SAS JMP Version 13. Main effects, second-order polynomials, and all interactions were included as model terms for the design generation. Factors screened were inoculation density (0.5, 3 or 6 × 10⁶ cells/mL), level of basal medium enrichment with feed medium (adding 0%, 8% or 16% of feed), day of first feed addition (day 1, 2, or 3), and amount of feed per bolus (3.1%, 3.6% or 4.1% of initial culture volume). All TubeSpin® bioreactors used an 18 mL initial working volume on a shaker incubator at 300 rpm and 36.5ºC with 6% CO2.
Fed-batch production bioreactor runs were performed using 5-L Sartorius vessels with an initial working volume of 3.3 L for 14 days unless otherwise specified. The production cultures were initiated using N-1 seeds prepared by various cultivation methods. For cell line A, the intensified fed-batch production culture was inoculated at 5 × 10⁶ cells/mL in the 5-L bioreactors to compare different N-1 seed cultures (Figure 3), while an inoculation cell density of 3 × 10⁶ cells/mL was used in 1000-L bioreactors and 5-L satellite runs (Figure 6). The feed medium was added daily starting on day 2 at 3.5% of the initial culture volume. Dissolved oxygen (DO) was maintained at 40% and pH was controlled at pH 7.2 using 1 M Na2CO3 and CO2 gas. Temperature was initially maintained at 36.5°C, then shifted to 34°C on day 4. For cell line B, the production culture was inoculated at 3 × 10⁶ cells/mL and feed medium was added daily starting on day 2 at 3.1% of the initial culture volume. DO was maintained at 40% and pH was controlled at pH 7.15. Temperature was maintained at 36.5°C throughout the entire 14-day culture duration. For cell line C, the production culture was inoculated at 6 × 10⁶ cells/mL and feed medium was added daily starting on day 2 with variable dose according to the schedule as follows: 5% initial culture volume from days 2 to 10, then 3.3% initial culture volume from day 11 to 13. DO was maintained at 40% and pH was controlled at pH 7.05. Temperature was initially maintained at 36.5°C, then shifted to 33°C on day 6.
Scale-up runs using the same fed-batch processes described above were performed in XDR disposable bioreactors for cell line A (1000-L XDR, enriched N-1 seed), cell line B (500-L XDR, enriched N-1 seed), and cell line C (500-L XDR, fed-batch N-1 seed). All non-perfusion N-1 seeds were grown in 200-L XDR disposable bioreactors.
In-process cell culture and quality attribute assays
Whole broth cell culture samples were used for assays with pHOx analyzer, Vi-CELL, and CEDEX Bio HT. Supernatant samples after centrifuged at 1000 g for 5 min were used for Protein A titer assay. The supernatant samples were first purified by Protein A chromatography, and then the purified samples were used for impurity, charge variants, and N glycan analyses.
Off-line pH, pCO2, and pO2 were detected using a Bioprofile pHOx analyzer (Nova Biomedical). VCD and cell viability were quantified off-line using a Vi-CELL XR automatic cell counter (Beckman Colter). Glucose, glutamine, glutamate, lactate, and ammonia were quantified using a CEDEX Bio HT analyzer (Roche). The mAb titer was measured using Protein A UPLC. The titer was then normalized relative to the maximum final titer reached by all the 3 CHO cell lines in this study.
Size exclusion chromatography for impurity was performed using a Tosoh TSK G3000SWxl column, 7.8 x 30 cm, 5um, with an isocratic gradient monitored at 280 nm on a Waters Alliance HPLC system (Milford, MA) equipped with a temperature controlled autosampler and Waters 2996 PDA detector.
Charge variant species were assayed by imaged capillary isoelectric focusing, using a Protein Simple iCE3 instrument with an Alcott 720NV autosampler (San Jose, CA). Samples were mixed with appropriate pI markers, ampholytes, and urea, then injected into a fluorocarbon coated capillary cartridge. High voltage was applied and the charged variants migrated to their respective pI. A UV camera captured the image at 280 nm. The main peak was identified and the peaks that migrated into the acidic range and basic range were summed, quantitated, and reported as relative percent area.
N-glycan analysis was performed using a commercially available kit from Prozyme, GlykoPrep® Rapid N-Glycan Preparation with 2-AB (Hayward, CA). The free oligosaccharides were profiled using an Acquity UPLC Glycan BEH Amide, 130 Å, 1.7 µm, 2.1 × 10 mm column (Milford, MA) on a Waters Acquity H-Class system (Milford, MA) equipped with a temperature controlled autosampler and fluorescence detector.
Acknowledgments
Thanks to our colleagues from Process Development, Analytical, Scale-Up Laboratory and the BMS Clinical Manufacturing Facility in Hopewell, NJ for supporting this study at Bristol-Myers Squibb.
References
- 1.Stankiewicz AI, Moulijn JA.. Process intensification: Transforming chemical engineering. Chem Eng Prog. 2000;96:22–33. [Google Scholar]
- 2.Charpentier JC. In the frame of globalization and sustainability, process intensification, a path to the future of chemical and process engineering (molecules into money). Chem Eng J. 2007;134:84–92. doi: 10.1016/j.cej.2007.03.084. [DOI] [Google Scholar]
- 3.Moulijn JA, Stankiewicz A. Process Intensification. Encyclopedia of Sustainable Technologies: Elsevier, 2017:509–18. doi: 10.1016/B978-0-12-409548-9.10242-8 [DOI] [Google Scholar]
- 4.Ramshaw C. ‘HIGEE’ DISTILLATION - AN EXAMPLE OF PROCESS INTENSIFICATION. Chemical Engineer (London) 1983:13–14. [Google Scholar]
- 5.Van Gerven T, Stankiewicz A. Structure, energy, synergy, time-the fundamentals of process intensification. Ind Eng Chem Res. 2009;48:2465–74. doi: 10.1021/ie801501y. [DOI] [Google Scholar]
- 6.Noorman HJ, Van Winden W, Heijnen JJ, Van Der Lans RGJM. CHAPTER 1: intensified fermentation processes and equipment In: Gorak A, Stankiewicz A, editors. RSC green chemistry: royal society of chemistry. 2018. p. 1–41. [Google Scholar]
- 7.Prado-Rubio OA, Morales-Rodríguez R, Andrade-Santacoloma P, HernÁndez-Escoto H. Process intensification in biotechnology applications. Process Intensification in Chemical Engineering: Design Optimization and Control: Springer International Publishing, 2016:183–219. [Google Scholar]
- 8.Ikwebe J, Harvey AP. Intensification of bioethanol production by simultaneous saccharification and fermentation (SSF) in an oscillatory baffled reactor (OBR). Inst Chem Eng Symp Ser. 2011;157:60. [Google Scholar]
- 9.Croughan MS, Konstantinov KB, Cooney C. The future of industrial bioprocessing: batch or continuous? Biotechnol Bioeng. 2015;112:648–51. doi: 10.1002/bit.25529. [DOI] [PubMed] [Google Scholar]
- 10.Farid SS, Thompson B, Davidson A. Continuous bioprocessing: the real thing this time? 10th Annual bioProcessUK conference, December 3–4,2013, London, UK. mAbs. 2014;6:1357–61. doi: 10.4161/mabs.36151. [DOI] [PMC free article] [PubMed] [Google Scholar]
- 11.Gjoka X, Gantier R, Schofield M. Going from fed-batch to perfusion. BioPharm Int. 2017;30:32. [Google Scholar]
- 12.Fan L, Rizzi G, Bierilo K, Tian J, Yee JC, Russell R, Das TK. Comparative study of therapeutic antibody candidates derived from mini-pool and clonal cell lines. Biotechnol Prog. 2017;33:1456–62. doi: 10.1002/btpr.2477. [DOI] [PubMed] [Google Scholar]
- 13.Wurm FM. CHO quasispecies—implications for manufacturing processes. Processes. 2013;1:296–311. doi: 10.3390/pr1030296. [DOI] [Google Scholar]
- 14.Zhang A, Tsang VL, Markely LR, Kurt L, Huang YM, Prajapati S, Kshirsagar R. Identifying the differences in mechanisms of mycophenolic acid controlling fucose content of glycoproteins expressed in different CHO cell lines. Biotechnol Bioeng. 2016;113:2367–76. doi: 10.1002/bit.25995. [DOI] [PubMed] [Google Scholar]
- 15.Ling WL. Development of protein-free medium for therapeutic protein production in mammalian cells: recent advances and perspectives. Pharm Bioprocessing. 2015;3:215–26. doi: 10.4155/pbp.15.8. [DOI] [Google Scholar]
- 16.Ritacco FV, Wu Y, Khetan A. Cell culture media for recombinant protein expression in Chinese hamster ovary (CHO) cells: History, key components, and optimization strategies. Biotechnol Prog. 2018;34:1407–26. doi: 10.1002/btpr.2706. [DOI] [PubMed] [Google Scholar]
- 17.Xu J, Jin M, Song H, Huang C, Xu X, Tian J, Qian N-X, Steger K, Lewen NS, Tao L, et al. Brown drug substance color investigation in cell culture manufacturing using chemically defined media: A case study. Process Biochem. 2014;49:130–39. doi: 10.1016/j.procbio.2013.10.015. [DOI] [Google Scholar]
- 18.Xu J, Rehmann MS, Xu X, Huang C, Tian J, Qian NX, Li ZJ. Improving titer while maintaining quality of final formulated drug substance via optimization of CHO cell culture conditions in low-iron chemically defined media. mAbs. 2018;10:488–99. doi: 10.1080/19420862.2018.1433978. [DOI] [PMC free article] [PubMed] [Google Scholar]
- 19.Abu-Absi NR, Kenty BM, Cuellar ME, Borys MC, Sakhamuri S, Strachan DJ, Hausladen MC, Li ZJ. Real time monitoring of multiple parameters in mammalian cell culture bioreactors using an in-line Raman spectroscopy probe. Biotechnol Bioeng. 2011;108:1215–21. doi: 10.1002/bit.23023. [DOI] [PubMed] [Google Scholar]
- 20.Xu J, Tang P, Yongky A, Drew B, Borys MC, Liu S, Li ZJ. Systematic development of temperature shift strategies for Chinese hamster ovary cells based on short duration cultures and kinetic modeling. mAbs. 2019;11:191–204. doi: 10.1080/19420862.2018.1525262. [DOI] [PMC free article] [PubMed] [Google Scholar]
- 21.Xu S, Chen H. High-density mammalian cell cultures in stirred-tank bioreactor without external pH control. J Biotechnol. 2016;231:149–59. doi: 10.1016/j.jbiotec.2016.06.019. [DOI] [PubMed] [Google Scholar]
- 22.Kunert R, Reinhart D. Advances in recombinant antibody manufacturing. Appl Microbiol Biotechnol. 2016;100:3451–61. doi: 10.1007/s00253-016-7388-9. [DOI] [PMC free article] [PubMed] [Google Scholar]
- 23.Li F, Vijayasankaran N, Shen AY, Kiss R, Amanullah A. Cell culture processes for monoclonal antibody production. mAbs. 2010;2:466–77. doi: 10.4161/mabs.2.5.12720. [DOI] [PMC free article] [PubMed] [Google Scholar]
- 24.Wurm FM. Production of recombinant protein therapeutics in cultivated mammalian cells. Nat Biotechnol. 2004;22:1393–98. doi: 10.1038/nbt1026. [DOI] [PubMed] [Google Scholar]
- 25.Gottschalk U, Brorson K, Shukla AA. The need for innovation in biomanufacturing. Nat Biotechnol. 2012;30:489–92. doi: 10.1038/nbt.2263. [DOI] [PubMed] [Google Scholar]
- 26.Handlogten MW, Lee-O’Brien A, Roy G, Levitskaya SV, Venkat R, Singh S, Ahuja S. Intracellular response to process optimization and impact on productivity and product aggregates for a high-titer CHO cell process. Biotechnol Bioeng. 2018;115:126–38. doi: 10.1002/bit.26460. [DOI] [PubMed] [Google Scholar]
- 27.Huang YM, Hu W, Rustandi E, Chang K, Yusuf-Makagiansar H, Ryll T. Maximizing productivity of CHO cell-based fed-batch culture using chemically defined media conditions and typical manufacturing equipment. Biotechnol Prog. 2010;26:1400–10. doi: 10.1002/btpr.436. [DOI] [PubMed] [Google Scholar]
- 28.Zhang L, Shawley R, Gawlitzek M, Wong B. Development towards a high-titer fed-batch CHO platform process yielding product titers > 10 g/L. Cell Culture Engineering XVI Tampa, Florida, USA, 2018. [Google Scholar]
- 29.Bonham-Carter J, Shevitz J. A brief history of perfusion biomanufacturing. Bioprocess Int. 2011;9:24–31. [Google Scholar]
- 30.Tyo MA, Spier RE. Dense cultures of animal cells at the industrial scale. Enzyme Microb Technol. 1987;9:514–20. [Google Scholar]
- 31.Chotteau V, Zhang Y, Clincke MF. Very high cell density in perfusion of CHO cells by ATF, TFF, wave bioreactor, and/or celltank technologies - impact of cell density and applications. Continuous Processing in Pharmaceutical Manufacturing: Wiley Blackwell, 2015:339–56. doi: 10.1002/9783527673681.ch13 [DOI] [Google Scholar]
- 32.Voisard D, Meuwly F, Ruffieux PA, Baer G, Kadouri A. Potential of cell retention techniques for large-scale high-density perfusion culture of suspended mammalian cells. Biotechnol Bioeng. 2003;82:751–65. doi: 10.1002/bit.10629. [DOI] [PubMed] [Google Scholar]
- 33.Bielser JM, Wolf M, Souquet J, Broly H, Morbidelli M. Perfusion mammalian cell culture for recombinant protein manufacturing – A critical review. Biotechnol Adv. 2018;36:1328–40. doi: 10.1016/j.biotechadv.2018.04.011. [DOI] [PubMed] [Google Scholar]
- 34.Warikoo V, Godawat R, Brower K, Jain S, Cummings D, Simons E, Johnson T, Walther J, Yu M, Wright B, et al. Integrated continuous production of recombinant therapeutic proteins. Biotechnol Bioeng. 2012;109:3018–29. doi: 10.1002/bit.24584. [DOI] [PubMed] [Google Scholar]
- 35.Gallo-Ramírez LE, Nikolay A, Genzel Y, Reichl U. Bioreactor concepts for cell culture-based viral vaccine production. Expert Rev Vaccines. 2015;14:1181–95. doi: 10.1586/14760584.2015.1067144. [DOI] [PubMed] [Google Scholar]
- 36.Bonham-Carter J, Weegar J, Nieminen A, Shevitz J, Eliezer E. The use of the ATF system to culture chinese hamster ovary cells in a concentrated fed-batch system. BioPharm Int. 2011;24:42–48. [Google Scholar]
- 37.Yang WC, Minkler DF, Kshirsagar R, Ryll T, Huang YM. Concentrated fed-batch cell culture increases manufacturing capacity without additional volumetric capacity. J Biotechnol. 2016;217:1–11. doi: 10.1016/j.jbiotec.2015.10.009. [DOI] [PubMed] [Google Scholar]
- 38.Hiller GW, Ovalle AM, Gagnon MP, Curran ML, Wang W. Cell-controlled hybrid perfusion fed-batch CHO cell process provides significant productivity improvement over conventional fed-batch cultures. Biotechnol Bioeng. 2017;114:1438–47. doi: 10.1002/bit.26259. [DOI] [PubMed] [Google Scholar]
- 39.Lee SY, Kwon YB, Cho JM, Park KH, Chang SJ, Kim DI. Effect of process change from perfusion to fed-batch on product comparability for biosimilar monoclonal antibody. Process Biochem. 2012;47:1411–18. doi: 10.1016/j.procbio.2012.05.017. [DOI] [Google Scholar]
- 40.Meuwly F, Weber U, Ziegler T, Gervais A, Mastrangeli R, Crisci C, Rossi M, Bernard A, von Stockar U, Kadouri A. Conversion of a CHO cell culture process from perfusion to fed-batch technology without altering product quality. J Biotechnol. 2006;123:106–16. doi: 10.1016/j.jbiotec.2005.10.013. [DOI] [PubMed] [Google Scholar]
- 41.Karst DJ. Perfusion cell culture: Challenges and potentials between lab and manufacturing scale. Cell Culture Engineering XVI Tampa, Florida, USA, 2018. [Google Scholar]
- 42.Stettler M, Monchois V, Jordan M. Intensification of large-scale mammalian fed-batch processes. Pharm Bioprocess. 2018;6:1–2. [Google Scholar]
- 43.Padawer I, Ling WLW, Bai Y. Case study: an accelerated 8-day monoclonal antibody production process based on high seeding densities. Biotechnol Prog. 2013;29:829–32. doi: 10.1002/btpr.1719. [DOI] [PubMed] [Google Scholar]
- 44.Yang WC, Lu J, Kwiatkowski C, Yuan H, Kshirsagar R, Ryll T, Huang Y-M. Perfusion seed cultures improve biopharmaceutical fed-batch production capacity and product quality. Biotechnol Prog. 2014;30:616–25. doi: 10.1002/btpr.1884. [DOI] [PubMed] [Google Scholar]
- 45.Pohlscheidt M, Jacobs M, Wolf S, Thiele J, Jockwer A, Gabelsberger J, Jenzsch M, Tebbe H, Burg J. Optimizing capacity utilization by large scale 3000 L perfusion in seed train bioreactors. Biotechnol Prog. 2013;29:222–29. doi: 10.1002/btpr.1672. [DOI] [PubMed] [Google Scholar]
- 46.Jordan M, Mac Kinnon N, Monchois V, Stettler M, Broly H. Intensification of large-scale cell culture processes. Curr Opin Chem Eng. 2018;22:253–57. doi: 10.1016/j.coche.2018.11.008. [DOI] [Google Scholar]
- 47.De Jesus MJ, Girard P, Bourgeois M, Baumgartner G, Jacko B, Amstutz H, Wurm FM. TubeSpin satellites: A fast track approach for process development with animal cells using shaking technology. Biochem Eng J. 2004;17:217–23. doi: 10.1016/S1369-703X(03)00180-3. [DOI] [Google Scholar]
- 48.Gomez N, Ambhaikar M, Zhang L, Huang CJ, Barkhordarian H, Lull J, Gutierrez C. Analysis of Tubespins as a suitable scale-down model of bioreactors for high cell density CHO cell culture. Biotechnol Prog. 2017;33:490–99. doi: 10.1002/btpr.2418. [DOI] [PubMed] [Google Scholar]
- 49.Jordan M, Stettler M. Tools for high-throughput process and medium optimization In: Pörtner R, editor. Animal cell biotechnology: methods and protocols. Totowa (NJ): Humana Press; 2014. p. 77–88. [DOI] [PubMed] [Google Scholar]
- 50.Rouiller Y, Bielser JM, Brühlmann D, Jordan M, Broly H, Stettler M. Screening and assessment of performance and molecule quality attributes of industrial cell lines across different fed-batch systems. Biotechnol Prog. 2016;32:160–70. doi: 10.1002/btpr.2186. [DOI] [PubMed] [Google Scholar]
- 51.Arora M. Cell culture media: a review. Mater Methods. 2013;3:175. doi: 10.13070/mm.en.3.175. [DOI] [Google Scholar]