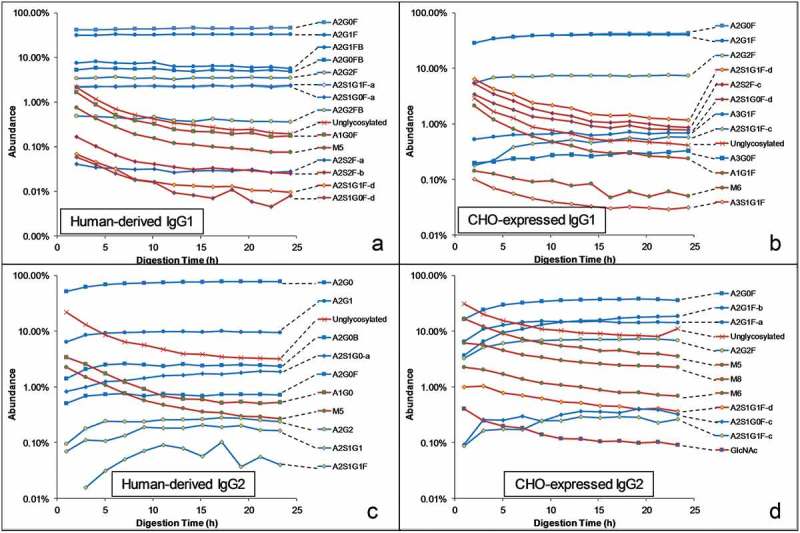
Figure 6.

Glycan profiles of released glycopeptides (EEQYNSTYR for IgG1 and EEQFNSTFR for IgG2) after tryptic digestion of human-derived and CHO-expressed IgGs for varying lengths of time under a native-like condition. Glycoforms that increase or do not change with time are shown in blue lines and glycoforms that decrease with time are shown in red lines.
