

Abstract
Defining the characteristics of cancer stem cells (CSC) has become an important subject in cancer research during the past decade. Although molecular surface expression levels have been used for CSC recognition, the clinical and prognostic impacts of these markers have remained a controversial issue. The finding that cancerous cells are considerably more deformable than normal ones provides the motivation for the hypothesis that the mechanical properties can be used as biomarkers to distinguish between stem-like and non-stem-like cancer cells. In this study, using micropipette aspiration (MA) and intracellular particle tracking (IPT) microrheology, measurements of the whole-cell and local viscoelasticity were made on four breast cancer cell lines with different CSC phenotypes based on their surface markers. Stem-like Hs578T and MDA-MB-231 cell lines were found to be the most deformable, while the non-stem-like MDA-MB-468 line was the least deformable. The non-stem-like BT-20 cell line showed an intermediate deformability. The enhanced deformability for stem-like cells was consistent with the observed lower and more dispersed F-actin content for the stem-like cells. Therefore, the cytoskeleton-related differences in the rheological properties of cancer cells can be a potential biomarker for CSC and eventually lead to novel cancer diagnostic and therapeutic methods.
Keywords: Cancer stem cells, Mechanical properties, Mechanical biomarker, Micropipette aspiration, Intracellular particle tracking, Microrheology, Cytoskeleton
Introduction
Over the past decade, defining the characteristics of cancer stem-like cells (CSC) has become an important subject in cancer research. CSC are known to be key factors for distant metastasis and are associated with poor clinical outcomes in cancer treatment.10,14,22,28 For cancer treatment it is thus crucial to be diagnosed at the very early stages of the disease. Although molecular surface expression levels, such as CD44+/CD24− for breast cancer,1 have been used for CSC recognition, the clinical and prognostic impact of these markers have remained a controversial issue. In order to elucidate the functions and the populations of CSC within solid tumors, it is necessary to improve cancer stem-like definition and recognition either through the use of additional surface markers or through other cell properties.
The finding that cancerous cells are considerably more deformable than normal ones17–20 provides the motivation for using deformability differences as a mechanical biomarker to separate stem-like cancer cells from non-stem-like ones. It is perhaps paradoxical that cancer cells are found to more deformable than normal cells, since tumors are found to be much stiffer than normal tissue. The paradox is resolved, however when we note that tumors are abnormal organs composed of multiple cell types and extracellular matrix.8 Probing is the most commonly used technique to investigate the mechanics of cells. In probing techniques, a mechanical perturbation in the form of either an imposed deformation or force is applied on the cell and the dynamic responses of the cell are investigated.13 Either a portion of outside of the cell (such as in atomic force microscopy (AFM) and magnetic twisting cytometry) or the entire cell (as in optical tweezers, microplate stretcher, and micropipette aspiration) can be stressed or strained and the resulting strain or stress relaxation can then be monitored. Using AFM, Lekka et al. found that normal cells are stiffer than cancer cells because of the reorganization of the cytoskeleton.18 Later, using an optical stretcher, Lincoln et al. confirmed that malignant cells can stretch about five times more than non-malignant ones for a given force.21 Using micropipette aspiration, Wu et al. found that the elastic coefficients were significantly (but very marginally) higher for human hepatocellular carcinoma cells than normal hepatocytes.41 Importantly, however, treatments that disrupted the actin or microtubule cytoskeleton were seen to decrease all of the Standard Linear Solid (SLS) elastic and viscous parameters.41 This confirms that at the grossest levels, cell mechanical behavior depends on some aspect of the presence of cytoskeletal elements.
Mechanical properties of a whole cell are defined by the cell’s strain response to an applied stress. The local rheological response for many cell types has been found to depend on the frequency of deformation as a power law.2,11,12 One can represent the overall mechanical properties of the cell with a complex elastic modulus, G(ω) = G′(ω) + iG″(ω) where G′(ω) is the in-phase elastic storage modulus and G″(ω) is the 90° out-of-phase viscous loss modulus. It has been found experimentally that for a range of deformation frequencies around 1 rad/s (a range that is relevant to many biological processes), cell elastic and viscous moduli, as well as the moduli for purified cytoskeletal elements are often only weakly dependent on frequency.2 This underlies the success of the SLS model for cell rheology, which assumed the material is a continuum with fixed values for elastic and viscous moduli. The SLS model has frequently been used to interpret whole cell deformation experiments, especially those using the micropipette aspiration technique.20,29,46 The magnitudes and frequency dependence of the moduli should arise from rheology of the cytoplasm and cytoskeleton, but there are currently too many models (e.g. sol-gel transitions for crosslinked cytoskeletal elements, soft glassy rheology and biphasic fluid and solid networks that can exchange momentum) to be able to state a precise connection between the state of the cytoskeleton and the rheological properties.11,20
Methods like micropipette aspiration provide estimates of whole-cell mechanical properties. There have been very few studies that compared these bulk cellular results with localized rheological information inside the cell that can be found using intracellular particle tracking (IPT). By tracking the motion of tracer particles inside the cells IPT can be used to measure the local biomechanical properties for different regions inside the cell.5,39 Furthermore, IPT allows the frequency-dependence of the local shear moduli to be extracted from the mean square displacements of the tracked particles. There are two different kinds of intracellular tracking particles: (1) endogenous granules (EGs), in which differential interference contrast microscopy is employed,25,45 and (2) ballistically injected fluorescent latex particles which make the visualization easier, but potentially disrupt the cell.7,19 A change in the cytoskeletal structure and mechanics (like softening of a cancer cell) becomes manifest as a change in the mean square displacements (MSD) of the tracked intracellular particles. Li et al. showed that IPT can be very sensitive to the malignant potential of breast and pancreatic cancer cells,19 and thus IPT could be useful in distinguishing cancer cells with different levels of aggressiveness. By separately studying different subcellular regions, IPT might be used as a valuable complementary nanomechanical tool to other probing techniques such as micropipette aspiration19 to provide additional constraints that might resolve the structural heterogeneity of cells.30
Our hypothesis is that differences in the viscoelastic parameters might help to distinguish between stem-like and non-stem-like cancer cells, as they have been able to distinguish between normal and malignant cells. In this study, both micropipette aspiration and IPT techniques were used to compare the ability of top down vs bottom up probes to distinguish between four breast cancer cell lines: BT-20 and MDA-MB-468 with non-CSC-like phenotypes and Hs578T and MDA-MB-231 with CSC-like phenotypes.
Materials and Methods
Cell Culture
BT-20, MDA-MB-468, Hs-578T, and MDA-MB-231 breast cancer cell lines were obtained from the American Type Culture Collection (Manassas, VA). BT-20 cells were cultured in Minimum Essential Medium with Earle’s balanced salts (MEM, Invitrogen, Carlsbad, CA), supplemented with 10% Fetal Bovine Serum (FBS) and 1 × penicillin/streptomycin. MDA-MB-468, Hs-578T, and MDA-MB-231 cancer cells were grown in Dulbecco’s Modified Eagle’s Medium (DMEM, Invitrogen) with 10% FBS and 1 × penicillin/streptomycin. The cells were maintained at 37 °C and 5% CO2 in an incubator and sub-cultured every 2–3 days. To minimize the effects of cell passage number on phenotypic drift, all experiments were completed within six passages.
Flow Cytometry of Cell Surface Proteins
Breast cancer cell surface molecular expression levels of CD24 and CD44 were analyzed using a FACSAria special order research product flow cytometer/sorter (BD Biosciences, San Jose, CA). Cell suspensions at a concentration of 107 cells/ml were incubated with 10 μg/ml conjugated antibodies (FITC mouse anti-human CD44 (clone G44-26) and PE mouse anti-human CD24 (clone ML5) from BD Biosciences) or with their fluorophore-conjugated matched isotype control antibodies for 30 min at 4 °C. Cells were washed twice with 0.1% bovine serum albumin (BSA) in Dulbecco’s phosphate buffered saline with CaCl2 and MgCl2 (DPBS+) and were resuspended in DPBS+ before running them through the flow cytometer.
Flow Cytometry of F-actin Filaments
Intracellular flow cytometry of breast cancer cell lines was done for F-actin quantification. First, cell suspensions at a concentration of 107 cells/ml were fixed in 10% formalin (neutral and buffered 4% formaldehyde) at 4 °C and permeabilized in 1× Perm/Wash™ buffer (BD Biosciences). Non-permeabilized cells were used as controls. Then the cells were incubated with 10 µg/ml Alexa Fluor® 488 Phalloidin (Life Technologies, Grand Island, NY) (in Perm/Wash™ for permeabilized and in DPBS+ for non-permeabilized cells) for 40 min at 4 °C. Permeabilized and non-permeabilized cells were washed with 1x Perm/Wash™ and DPBS+, respectively, and were resuspended in DPBS+ before running them through the flow cytometer.
Micropipette Fabrication
Micropipettes were prepared and characterized as described previously.36,37 Briefly, micropipettes with tip inner diameters (ID) from 8 to 14 μm were pulled from 0.9 mm glass tubes (Friedrich & Dimmock, Millville, NJ) using a vertical puller (Model 730, David Kopf Instruments, Tujunga, CA). The tips were smoothed with a microforge (MF-200; World Precision Instruments, Sarasota, FL) and were measured by insertion of gold-coated glass microneedles that had been calibrated with scanning electron microscopy.
Micropipette Aspiration
Cancer cells, suspended in 0.1% BSA in DPBS+, were transferred into a custom-made viewing chamber with a cavity cut out that held 0.5 ml of cell suspension. The chamber was placed on the stage of an inverted microscope (Nikon Eclipse TE300, Fryer Corporation, Huntley, IL). The stage was connected to a temperature controller, and the temperature was set to 37 °C. The micropipette, which was connected to a custom-built manometer with pressure sensor (DP15, Validyne, Northridge, CA), was positioned on a micromanipulation stage and inserted into the viewing chamber.
For each cell line, 10 cells were aspirated one by one at constant pressures and viewed with an inverted microscope using a 20× objective. Images of cell aspiration were captured every 2 s using a CCD video camera connected to a PC with Labview Image Acquisition software (National Instruments, Austin, TX) for image analysis.
The SLS model30 was used to evaluate the whole-cell viscoelastic properties. The cell was modeled as a homogeneous linear viscoelastic solid, represented as a spring with spring constant k 1 in parallel with a series combination of spring, k 2, and dashpot with viscosity µ.
For micropipette aspiration experiments, the creep function for the SLS model is given by29,30:
| 1 |
in which L(t) is the projection length at different times, k 1 and k 2 are the elastic constants described above, μ is the viscous constant, R p is the inner radius of micropipette, ΔP is the aspiration pressure, H(t) is the unit step function (that changes from 0 to 1 at t = 0), and τ is the characteristic relaxation time of deformation at constant load, given by τ = μ(k 1 + k 2)/k 1 k 2.
From Eq. (1), when , the equilibrium projection length is given by:
| 2 |
From the measured L ∞ for a given pressure, ΔP, the first elastic constant, k 1, can be calculated from Eq. (2). To find k 2, we note that immediately after the step stress, there will be an instantaneous response that corresponds to the stretching of the parallel springs k 1 and k 2. Evaluating Eq. (1) for t = 0, we find:
| 3 |
From the initial aspiration length, L 0, at t = 0 when the cell is first exposed to the full aspiration pressure ∆P, we can thus obtain k 1 + k 2, and hence the second elastic constant, k 2. Plugging the k 1 and k 2 values into Eq. (1) results in one unfitted parameter, τ. A least squares fit to the L(t) curve yields τ and hence μ can be calculated.
Intracellular Particle Tracking (IPT) Microrheology
In the IPT microrheology method, video microscopy is used to track the motions of particles residing in the cytoplasm. The experimental setup was the same as for the whole-cell experiments described above. Individual cancer cells were fully aspirated, seven cells for each cell line, into micropipettes with average inner diameter of 11.84 ± 1.30 µm. To keep the cells at equilibrium and stabilized inside the micropipettes following aspiration, the pressure reservoir level was adjusted until the cell did not move. Using a 60X (oil immersion, NA = 1.4) objective lens on the inverted optical microscope (Nikon TE300), the movements of granules (i.e., intracellular particles) were observed in different regions inside the cells. A video cassette recorder (Sony SVO-9500MD) was used to record sequences of video camera images showing granule displacements inside the cells. Each stabilized cell was recorded for at least 10 min. After the experiments, a particle tracking LabVIEW program was used to track the particles inside the cells. Each particle was tracked for 500 frames at 30 frames/s. Detailed methods for extraction of parameters are given in Pai et al. 25 but briefly, 2D mean squared displacement (MSD) vs. lag time, τ′, was calculated for each particle by averaging over time steps:
| 4 |
Here x(t) and y(t) are particle coordinates at time t, while x(t + τ′) and y(t + τ′) are particle coordinates after lag time τ′. It was often possible to find multiple 500 frame segments for the same particle in a long recording, and the MSD values vs. lag time values from these different segments for the same particle were averaged. Assuming an isotropic cytoplasm,23 the 3D MSD can be obtained from the 2D MSD using:
| 5 |
To avoid the truncation errors from taking the numerical Laplace transform of the MSD, the cells’ viscoelastic spectrum was calculated using:
| 6 |
where Γ is the gamma function and R is the size of the tracked particle.23 The logarithm of the experimental time-domain MSD was fitted with a polynomial in log τ, allowing the denominator to be evaluated. The elastic (in-phase) modulus G′(ω), and viscous (out-of-phase) modulus, G″(ω) were obtained by transformation of the Laplace frequency, s, to a complex frequency, iω. The resulting moduli were evaluated at ω = 1 rad/s. Values for the moduli can be obtained for other frequency values, but since the range of time lags examined covers only two orders of magnitude centered around 1 rad/s, the moduli are only reliable close to that central frequency.
Fluorescence Microscopy
Cells were grown on glass coverslips to a density of 5000 cells/cm2 one day before staining. The attached cells were incubated at 4 °C for 30 min with 4 µg/ml of Alexa Fluor® 488 Phalloidin after fixation in 1% paraformaldehyde. Then ProLong® Gold Antifade Reagent with DAPI (Life Technologies) was added on top of the cells and coverslips were mounted. After allowing the mounting medium to cure overnight, the coverslips were sealed with nail polish.
A Leica DMI 6000 inverted microscope (Leica Microsystems, Wetzlar, Germany), equipped with a motorized high precision specimen stage and an automated optical filter cube wheel, was used to image the cells under a 100x objective (oil immersion, NA = 1.4). Simple PCI software (Hamamatsu Corporation, Sewickley, PA) was used to acquire the images.
Statistical Analysis
Data were analyzed using the false discovery rate procedure, which provides a reasonable solution to the problem of multiple comparisons.6 The false discovery rate procedure operates on achieved significance levels to make a conclusion about a family of k comparisons. P values from t-tests are ordered by decreasing magnitude, then the critical significance level is calculated as d *i = (i/k) f P for i = k, k – 1, …, 1, in which f P, the expected fraction of null hypotheses rejected mistakenly, is 0.05. If P i ≤ d *i, the null hypotheses associated with the remaining i comparisons will be rejected (i.e., statistically significant).
Results
Stem-like Phenotype for Hs578T and MDA-MB-231 and Non-stem-like Phenotype for BT-20 and MDA-MB-468 Cancer Cell Lines Based on Cell Surface Protein Expression
From the results of the flow cytometry (Fig. 1), Hs578T and MDA-MB-231 breast cancer cell lines largely express the CD44+/CD24- phenotype (99.9 and 98.8%, respectively), implying that these cell lines are models of stem-like cancer cells.1,32 In contrast, BT-20 and MDA-MB-468 breast cancer cell lines, which respectively expressed 96.5 and 99.9% of CD44+/CD24+ (Fig. 1), are considered models of non-stem-like cancer cells.1,32
Figure 1.

Flow cytometry results for Hs578T, MDA-MB-231, and BT-20, MDA-MB-468 breast cancer cell lines. Cancer cells were labeled with CD44-FITC and CD24-PE conjugated antibodies and analyzed by flow cytometry. Data are representative of n = 3 individual experiments.
Whole-cell Viscoelastic Properties Measured by Micropipette Aspiration Discloses Rheological Differences Between CSC-like and Non-CSC-like Cells
Employing the linear viscoelastic model, the viscoelasticity properties of Hs578T, MDA-MB-231, BT-20, and MDA-MB-468, breast cancer cell lines were measured. Table 1 shows the cells’ phenotypes, average radii of cells R c, average radii of micropipettes R p, average deformation ratio R c /R p, and the average applied pressure ΔP for each cell line.
Table 1.
Cell line information for whole-cell viscoelasticity measurements.
| Cell Lines | Phenotype | R c (µm) | R p (µm) | R c/R p | ΔP (Pa) |
|---|---|---|---|---|---|
| Hs578T | CD44+/CD24− | 11.31 ± 0.33 | 6.96 ± 0.16 | 1.62 ± 0.03 | 35 ± 2 |
| MDA-MB-231 | CD44+/CD24− | 8.84 ± 0.23 | 5.42 ± 0.08 | 1.63 ± 0.03 | 50 ± 6 |
| BT-20 | CD44+/CD24+ | 7.15 ± 0.10 | 4.22 ± 0.02 | 1.69 ± 0.02 | 88 ± 1 |
| MDA-MB-468 | CD44+/CD24+ | 8.21 ± 0.11 | 5.76 ± 0.04 | 1.43 ± 0.01 | 116 ± 11 |
Phenotype of cells, radii of cells (R c), radii of micropipettes (R p), deformation ratio (R c /R p), and applied pressures (∆P) for breast cancer cell lines (Mean ± SE)
Figure 2 shows a typical series of images of a BT-20 cancer cell during micropipette aspiration for viscoelasticity measurements. As the figure shows the cell was gradually deformed and aspirated at a constant pressure until it reached equilibrium inside the micropipette. Images were recorded for at least 2 min after equilibrium to make sure that the cell would not move any further into the micropipettes. The pressures given in Table 1 were found by trial and error and were chosen to be somewhat below the pressures that resulted in complete cell aspiration. While there was considerable intra-cell line heterogeneity in the pressure value needed to completely aspirate an individual cell, the values of ∆P given in the table were generally indicative of differences between the cell types. It required notably higher pressures to completely aspirate MDA-MB-468 cells than the other cell types. BT-20 required the next highest pressure to completely aspirate, followed by MDA-MB-231 cells. Hs578T cells required the lowest pressures for complete aspiration.
Figure 2.

Steps in aspiration of a breast cancer cell for viscoelasticity measurements. An example BT-20 cell is shown: (a) before aspiration, (b) t = 0 when cell first covered micropipette opening (P 0 = 67 Pa), (c) t = 30 s when pressure increased to P = 88 Pa, (d) t = 36 s cell front extending before reaching equilibrium, (e) t = 170 s when cell reached equilibrium, (f) t = 290 s with cell front unchanged from (e).
Representative images showing protrusion length of a cell inside a micropipette, L, vs. time are shown in Fig. 3. After some time, the cells reached equilibrium and did not move further into the micropipette. For the Hs578T cell in the figure, equilibrium was achieved around 500 s.
Figure 3.

Representative graphs of aspiration tongue length, L, as a function of time, t, for sample breast cancer cell lines.
The results for the first elastic constant k 1, combined first and second elastic constants k 1 + k 2, the viscosity constant µ, and the time constant τ, calculated from the SLS model, are shown in Fig. 4. The non-CSC-like MDA-MB-468 and BT-20 had larger values of k 1, k 2, and µ and were thus found to be stiffer and less deformable than the two CSC-like cell lines, Hs578T and MDA-MB-231.
Figure 4.

Mean values of (a) first elastic constant k 1, (b) sum of first and second elastic constants k 1 + k 2, (c) viscosity µ, and (d) time constant τ for viscoelasticity measurements of all studied breast cancer cell lines. Bars are standard errors. Stars indicate significant differences between pairs; p < 0.05.
Intracellular Particle Tracking Reveals Distinct Local Viscoelastic Properties of CSC-like and Non-CSC-like Cells
Using IPT microrheology, the local elastic and viscous moduli of tail, body, and head regions of the breast cancer cell lines were measured. Figure 5 shows a typical image taken after aspiration of a BT-20 cell. The head region is the section of the cell which was aspirated first, while the tail region is the section of the cell closer to the micropipette opening. A typical graph of averaged mean square distance (MSD) vs. lag time for one of the cancer cell lines studied is presented in Fig. 6. As the graph shows, the slope of MSD vs. τ was initially close to 0, indicating a sub-diffusive dynamic behavior for the motions of the intracellular particle.4,26,33 In some cases, the slope gradually increased on longer time scale until it approached 1. For example, in Fig. 6a, the long time slope is less than 1.0. However, in Fig. 6b, the long time slope gradually increased and became greater than one at the end of the curve, representing a super-diffusive behavior. The super-diffusive behavior could indicate short periods of directed motion either from molecular motors or from internal flows, which becomes apparent on long time scales.
Figure 5.
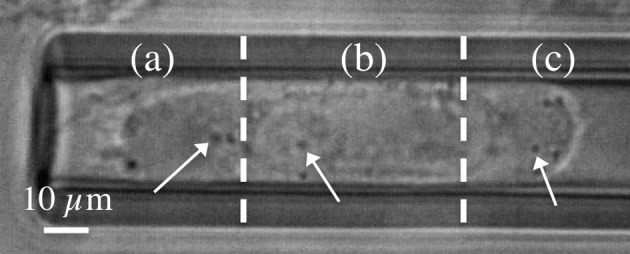
Different regions in an aspirated BT-20 breast cancer cell for IPT microrheology: (a) tail: the last region of the cell which was aspirated, (b) body: middle region of the aspirated cell, and (c) head: the first aspirated region of the cell. The arrows point to potential granules that could be tracked. The granules in the body region might be confined by the nucleus, so an increase of stiffness could be expected for this region.
Figure 6.

Sample log-log plots of averaged MSD vs. lag time for two breast cancer cells. The straight line shows the slope = 1 expected for pure diffusion.
The results of elastic storage modulus G′(ω), viscous loss modulus G″(ω), and the magnitude of the complex modulus G(ω) for ω = 1 rad/s are shown in Fig. 7 along with the statistical significance of differences. For the elastic storage and loss moduli there were significant differences between body & head and body & tail for all the cell lines. However, for the viscous loss modulus values no significant difference was found between different parts of any breast cancer cell lines studied.
Figure 7.

Comparisons of elastic, loss, and complex moduli for the different breast cancer cell lines in the three regions outlined in Fig. 5. (a) Comparisons of elastic modulus G′(ω): * means significantly different from Hs578T and MDA-MB-231; ** means significantly different from BT-20, Hs578T, and MDA-MB-231; ♦♦ means significantly different from BT-20, Hs578T, and MDA-MB-468; ø means significantly different from Hs578T and MDA-MB-231; p < 0.05. (b) Comparisons of loss modulus G″(ω): ** means significantly different from BT-20, Hs578T, and MDA-MB-231; •• means significantly different from BT-20, MDA-MB-231, and MDA-MB-468; p < 0.05. (c) Comparisons of the magnitude of the complex modulus G(ω): ** means significantly different from BT-20, Hs578T, and MDA-MB-231; ø means significantly different from MDA-MB-231 and MDA-MB-468; øø means significantly different from Hs578T, MDA-MB-231, and MDA-MB-468; ♦♦ means significantly different from BT-20, Hs578T, and MDA-MB-468; p < 0.05.
The non-CSC-like MDA-MB-468 cell line was found to have the largest elastic and viscous moduli and was thus the stiffest and the most flow resistant cell line. This was true in all the regions, except for the head region which had the same elasticity as BT-20, the other non-CSC-like cell line. The CSC-like cell line MDA-MB-231 had the smallest elastic moduli (and was thus more deformable) than the non-CSC-like cell lines in all the regions and the differences were significant in all but the head region. CSC-like Hs578T cells, in contrast, had the smallest value of viscous modulus for all the regions (and were thus the least flow resistant). The differences were significant in the head and tail regions, but not in the body region. The BT-20 cell line, with intermediate values of local elastic and viscous moduli, had intermediate deformability and flow resistance.
To better visualize the similarities and differences between the datasets, star plots were generated for stem-like and non-stem-like cells. The star plot of the viscoelasticity parameters (Fig. 8a), which has four axes corresponding to k 1, k 1 + k 2, μ and τ), shows that the shapes corresponding to the stem-like cells mostly nest inside the shapes for the non-stem-like cells. The same behavior is seen for the triangular microrheology plots, that have axes representing the G, G′ and G″ data, for tail (Fig. 8b), body (Fig. 8c) and head (Fig. 8d) regions. For the microrheology plots, the shapes for the body region for each cell line are larger than the shapes for the head or tail regions, as would be expected given that the body region of the cell is stiffer than the head or tail region.
Figure 8.

(a) Star plot summarizing data for viscoelastic parameters k 1, k 1 + k 2, μ and τ for each of the cell lines. Axes are scaled to the maximum value for each parameter. (b) Star plot summarizing the IPT microrheology parameters G, G′, and G″ for the tail region. (c) Star plot summarizing the IPT microrheology parameters G, G′, and G″ for the body region. (d) Star plot summarizing the IPT microrheology parameters G, G′, and G″ for the head region. Note that since all of the microrheology parameter values can be shown on reasonable dimensional axes, all three plots are shown on the same scale for each axis. This allows parameters for head, body and tail regions to be compared directly.
F-actin Distribution and Quantification in CSC-like and Non-CSC-like cells
The F-actin cytoskeleton of the studied breast cancer cells was visualized using the green-fluorescent Alexa Fluor® 488 phalloidin, as shown in Fig. 9. The figures revealed a more diffuse actin cytoskeleton structure for Hs578T and MDA-MB-231 cell lines, while for BT-20 and MDA-MB-468 the actin filaments were tightly concentrated, especially in the perinuclear region. From the fluorescence images, it can also be seen that Hs578T and MDA-MB-231 cells were able to spread over at least twice the surface area as BT-20 and MDA-MB-468 cancer cells. While that might be expected, all things being equal, for Hs578T cells (which have an average radius that is ~ 4/3 the radius of the non-CSC-like cells), MDA-MB-231 cells have radii that are comparable to the non-CSC-like cells. Taken together, these observations imply that reduced F-actin density leads to a more deformable phenotype for Hs578T and MDA-MB-231 breast cancer cell lines compared to the other two cell lines.
Figure 9.

Representative fluorescence images of Hs578T, MDA-MB-231, BT-20, and MDA-MB-468 cells with a 100x objective show the characteristic actin organization (stained with Alexa Fluor 488 phalloidin, green) and nucleus (counter stained with DAPI, blue).
To confirm the results of fluorescence microscopy, F-actin quantities in cells were measured using Alexa Fluor® 488 phalloidin and flow cytometry. Representative graphs of forward scatter (FSC, indicative of cell size) vs. Alexa Flour 488 are shown in Fig. 10. The FSC results show that Hs578T cells extend to higher values (and hence larger sizes) than the other cell types, consistent with the R c values in Table 1. The Alexa Fluor 488 geometric means were 4801, 4676, 21917, and 53086 for the Hs578T, MDA-MB-231, BT-20, and MDA-MB-468 breast cancer cells shown, respectively. While roughly four fold to ten fold greater differences in F-actin measurements were consistently observed between the CSC-like and non-CSC-like cell lines, the size distribution varied among the cell lines over only an approximate three fold range. Thus, F-actin contents of Hs578T and MDA-MB-231 cells were, on average, less dense than that of BT-20 and MDA-MB-468 cell lines, implying that Hs578T and MDA-MB-231 cell lines were likely to be more deformable compared to the other two cell lines.
Figure 10.

Representative flow cytometry contour plots of forward scatter (FSC) vs. Alexa Flour 488. The Alexa Fluor 488 geometric means were 4801, 4676, 21917, and 53086 for Hs578T, MDA-MB-231, BT-20, and MDA-MB-468 breast cancer cell lines, respectively, while the FSC values range from 70,000-222,000. Data are representative of n = 3 individual experiments.
Discussion
Employing both micropipette aspiration and IPT microrheology, the whole-cell and local viscoelastic properties of BT-20, MDA-MB-468, Hs578T, and MDA-MB-231 breast cancer cell lines were measured so that overall and local mechanical label-free biomarkers can be tested for their ability to discriminate between CSC phenotypes.
The micropipette aspiration results were analyzed in terms of the infinite viscoelastic half-space model, which assumes that the cytoplasm is a standard linear solid.29 The SLS is an engineering model that provides a reasonable description of the observed strain history for cells, but without much connection to the microstructure of the cell. As summarized in Fig. 4, the long-time or equilibrium elastic constant, k 1 (which is related to Young’s modulus by E = 3/2 k 1 24) for the non-CSC-like MDA-MB-468 cell line was much higher than the other studied cancer cell lines, showing that this cell type was significantly less deformable. CSC-like Hs578T cells had the smallest k 1 values of all the cell types and were thus the most deformable or least stiff of all the cell lines. BT-20 and MDA-MB-231 cell lines had intermediate k 1 values that were not significantly different from one another. The other important elastic parameter in the SLS model is the initial or “instantaneous” stiffness, k 1 + k 2 which arises from the quasi-instantaneous stretch immediately after application of pressure to the cell. From this, one can define an initial “instantaneous” Young’s modulus E 0 = (3/2)(k 1 + k 2).24 As shown in Fig. 4b, the two non-CSC-like BT-20 and MDA-MB-468 cell lines were found to have significantly higher initial instantaneous stiffnesses than the CSC-like Hs578T and MDA-MB-231 cancer cell lines, while each of these two cell-type pairs were significantly different from the other in that pair. For the viscosity parameter, the viscosities of the non-CSC-like MDA-MB-468 and BT-20 cell lines were found to be significantly larger than the viscosities of the CSC-like Hs578T and MDA-MB-231 breast cancer cell lines.
Interestingly, the time constant τ for deformation at constant load was very similar (approximately 150 s) for three of the cell times. Only the MDA-MB-231 cell line had a time constant that was substantially (but not statistically significantly) smaller (75 s). Sato et al. defined a second time constant τ ε = μ/k 2 and that corresponds to the relaxation time of the load at a constant strain. This time constant was approximately 50 s for all cell types.29 These time scales are both quite long which suggests that the frequency range for whole cell viscoelastic deformations are in the mHz to cHz range, somewhat below the range probed by microrheology here.
IPT microrheology, which measures the local viscoelastic properties of the cytoplasm, revealed a rheological difference between the body section of the cell that is near to or inside the nucleus and both the cytoplasm-dominated tail and head regions of the cell. Though we found that, in general, the head and tail regions had the same properties for each of the breast cancer cell lines, the elastic storage modulus, the viscous loss modulus, and magnitude of the complex modulus of the body region all were noticeably larger than those of the head and tail regions. Petrie et al. found that for migrating fibroblasts, which spontaneously adopted a very similar tube-like shape while moving through 3D matrix, the nucleus and associated membranes formed a piston-like plug in the middle of the cell that acted as a significant barrier to diffusion of cytoplasmic photoactivatable green fluorescent protein in live cells.27 The cell nucleus was not always observable in our experiments but when it was visible, it did seem to extend across the width of the cell. It is, thus, not implausible to suspect that it might have acted as the fibroblast nuclei did to inhibit diffusion from the head compartment to the tail compartment and to establish regions that might have different mechanical properties. Yanai et al. have previously observed a regional rheological difference between the body and head regions in migrating neutrophils,43,44 but for our non-migrating cancer cells, the head and tail regions were indistinguishable. The only difference was that the head region was aspirated into the micropipette first with the tail region following later. Evidently any differences due to stress history had been smoothed out by the time the particle tracking measurements were made. We found that the body of the cancer cells was stiffer (larger elastic modulus) and more viscous (larger viscous modulus) compared to the cell endcaps. The body region mostly contains the nucleus as well as a dense cytoskeletal network in many of the cell types (as shown in the representative images in Fig. 9), while the head and tail regions contain primarily cytoplasm with a less dense filamentous network. The results would be consistent with the nuclear and perinuclear region being stiffer and more viscous than the more peripheral regions, as has been found by others. Studies on nuclear mechanical properties have confirmed that depending on the cell type, the nucleus is about 3-10 times stiffer than the surrounding cytoplasm.16 The fact that the head and tail regions were indistinguishable in micropipette aspiration experiments agrees well with Pai et al.’s experimental observations that once deformed and activated, the cell chooses the direction to move independent of the direction it was aspirated in Pai et al. 25
Moreover, in looking at regional differences between the cell types, local viscoelasticity measurements showed that the elastic modulus for non-CSC like MDA-MB-468 cell line was significantly stiffer than the rest of the cell lines in all of the regions, except for the head region which was not statistically different from the BT-20 head region value (Fig. 7a). The MDA-MB-231 was locally the most deformable (smaller elastic modulus) in all the regions, although the elastic storage modulus is not significantly different in the head region from the similarly CSC-like Hs578T which was the second most deformable. In agreement with the results of the whole-cell elasticity measurements, the BT-20 cell line has an intermediate value of elastic modulus, which is the same as that of the Hs578T in the tail and body parts. As shown in Fig. 7b, the viscous modulus for the MDA-MB-468 cell line was again the largest of all the cell types in all the regions. On the other extreme, Hs578T, with the smallest value of viscous modulus for all the regions, is the least flow resistant. MDA-MB-231 and BT-20 are somewhat more flow resistant than Hs578T cells, however, the body regions of all these three cell lines, i.e. Hs578T, MDA-MB-231, and BT-20, had the same viscous modulus or flow resistance.
A consistent result from both methods is that the MDA-MB-468 cell line was the stiffest cell line while Hs578T and MDA-MB-231 cell lines were the softest cell lines among the four breast cancer cell lines studied, though the body region of MDA-MB-231 is significantly softer than that of the Hs578T. The BT-20 cell line is as deformable as Hs578T in the tail and body regions, however, its head region is stiffer than that of Hs578T. This suggests that BT-20 cells not only have intermediate whole-cell viscoelasticity properties, but also they have intermediate local viscoelastic properties. Altogether, these findings support the hypothesis that CSC-like and non-CSC-like cells possess distinguishable mechanical properties, and that further levels of discrimination in terms of mechanical properties put the cells on a continuum that may be less binary than the distinction of CSC-like or non-CSC-like. Specifically, BT-20 cells seem to be intermediate in term of mechanical properties and this may represent an intermediate phenotype. Further research will be needed to clarify what distinct biophysical characteristics can be used to complement, or supersede, cell surface molecular expression as biomarker(s) of cancer cell stemness, in light of CSC subpopulations3,10,31 and recent investigations in cell movement through tight constrictions.15,34,35
Although the trends for the IPT microrheology are in good agreement with the results of micropipette aspiration measurements, one should note that the specific values for moduli are not directly comparable, since the time scales, assumptions and models are different. The advantage of comparing the methods is that we can probe the cell on different length scales and time scales from the whole-cell as one compartment in the micropipette experiments to the highly localized results from IPT.
While the results of local and whole cell mechanical properties were consistent, it is more difficult to discern what this similarity means for cytoskeletal structure. There are currently a number of models that may be capable of deriving overall cell rheological properties from the underlying crosslinked filamentous structure.11,20 Examples include sol-gel transitions, soft glassy rheology, pre-stressed tensegrity models and multiphase models that include fluid and solid networks that interact. All of these can explain some aspects of the frequency dependent moduli under some circumstances. One thing that can be expected, however, is that the moduli should be proportional to the density and crosslinking of the filamentous networks.2 It is, thus, reasonable to expect that MDA-MB-468 and BT-20 cancer cells will have denser or more closely spaced microfilament networks than Hs578T and MDA-MB-231 cells. The observed ranking of both local and whole cell moduli was, indeed, consistent with the relative density of the F-actin cytoskeleton as seen in fluorescence microscopy and flow cytometry for F-actin quantification (Figs. 9 and 10). Using a fluorescent phalloidin probe, the evaluation of F-actin levels by flow cytometry showed substantially more F-actin content for MDA-MB-468 and BT-20 cells compared to Hs578T and MDA-MB-231 cell lines. Similarly, fluorescence images of stained cells plated on substrates showed a lower F-actin filament density as well as a more dispersed cytoskeletal construction for stem-like Hs578T and MDA-MB-231 cancer cells. This allows them to be more deformable and have more cytoplasmic space to reconstruct the cytoskeleton while undergoing extravasation and intravasation during the metastatic process.9,38,40,42 Fluorescence imaging also showed that Hs578T and MDA-MB-231 cells each have a smaller nucleus than BT-20 and MDA-MB-468 cells in comparison to the size of the cell. It has been shown that the nuclei of cancer cells are ten times stiffer than that of the normal cells,16 therefore having a smaller volume fraction for the nucleus could make Hs578T and MDA-MB-231 cells more deformable and increase their metastatic potential.
In conclusion, stem-like breast cancer cells, Hs578T and MDA-MB-231, were found to be more deformable and less flow resistant compared to non-stem-like ones, BT-20 and MDA-MB-468. The enhanced deformability of stem-like cancer cell lines has a strong correlation with low F-actin content, which provides a potential mechanism for enhanced aggressiveness by allowing easier intravasation and extravasation during the metastatic process. Our results have established rheological properties as a potential biomarker for cancer stem cells which can eventually help with the development of new cancer diagnostic and therapeutic methods.
Acknowledgments
This work was supported by National Science Foundation grants CBET-1106118 and Major Research Instrumentation CBET-1039869. The authors would like to thank Mr. Grady Carlson (Department of Chemical and Biomolecular Engineering, Ohio University) for his collaboration and help in lab instruction.
Conflict of interest
Amina Mohammadalipour, Monica Burdick and David Tees declare that they have no conflict of interest.
Ethical Standards
No human studies or animal studies were carried out by the authors for this article.
References
- 1.Al-Hajj M, Wicha MS, Benito-Hernandez A, Morrison SJ, Clarke MF. Prospective identification of tumorigenic breast cancer cells. Proc. Natl. Acad. Sci. 2003;100:3983–3988. doi: 10.1073/pnas.0530291100. [DOI] [PMC free article] [PubMed] [Google Scholar]
- 2.Boal D. Three-Dimensional Networks in Mechanics of the Cell. New York: Cambridge University Press; 2002. pp. 97–131. [Google Scholar]
- 3.Burdick MM, Henson KA, Delgadillo LF, Choi YE, Goetz DJ, Tees DFJ, Benencia F. Expression of E-selectin ligands on circulating tumor cells: cross-regulation with cancer stem cell regulatory pathways? Front. Oncol. 2012;2(103):1–11. doi: 10.3389/fonc.2012.00103. [DOI] [PMC free article] [PubMed] [Google Scholar]
- 4.Caspi A, Granek R, Elbaum M. Enhanced diffusion in active intracellular transport. Phys. Rev. Lett. 2000;85:5655–5658. doi: 10.1103/PhysRevLett.85.5655. [DOI] [PubMed] [Google Scholar]
- 5.Crocker JC, Hoffman BD. Multiple-particle tracking and two-point microrheology in cells. Methods Cell Biol. 2007;83:141–178. doi: 10.1016/S0091-679X(07)83007-X. [DOI] [PubMed] [Google Scholar]
- 6.Curran-Everett D. Multiple comparisons: philosophies and illustrations. Am. J. Physiol. Regul. Integr. Comp. Physiol. 2000;279:R1–R8. doi: 10.1152/ajpregu.2000.279.1.R1. [DOI] [PubMed] [Google Scholar]
- 7.Duits MHG, Li Y, Vanapalli SA, Mugele F. Mapping of spatiotemporal heterogeneous particle dynamics in living cells. Phys. Rev. E. 2009;79:1–11. doi: 10.1103/PhysRevE.79.051910. [DOI] [PubMed] [Google Scholar]
- 8.Egeblad M, Nakason SN, Werb Z. Tumors as organs: complex tissues that interface with the entire organism. Dev. Cell. 2010;18(6):884–901. doi: 10.1016/j.devcel.2010.05.012. [DOI] [PMC free article] [PubMed] [Google Scholar]
- 9.Guck J, Schinkinger S, Lincoln B, Wottawah F, Ebert S, Romeyke M, Lenz D, Erickson HM, Ananthakrishnan R, Mitchell D, Kas J, Ulvick S, Bilby C. Optical deformability as an Inherent Cell marker for testing malignant transformation and metastatic competence. Biophys. J. 2005;88:3689–3698. doi: 10.1529/biophysj.104.045476. [DOI] [PMC free article] [PubMed] [Google Scholar]
- 10.Hanahan D, Weinberg RA. Hallmarks of cancer: the next generation. Cell. 2011;144:646–674. doi: 10.1016/j.cell.2011.02.013. [DOI] [PubMed] [Google Scholar]
- 11.Hoffman BD, Crocker JC. Cell mechanics: dissecting the physical responses of cells to force. Ann. Rev. Biomed. Eng. 2009;11:259–288. doi: 10.1146/annurev.bioeng.10.061807.160511. [DOI] [PubMed] [Google Scholar]
- 12.Hoffman BD, Massiera G, Van Citters KM, Crocker JC. The consensus mechanics of cultured mammalian cells. Proc. Natl. Acad. Sci. USA. 2006;103:10259–10264. doi: 10.1073/pnas.0510348103. [DOI] [PMC free article] [PubMed] [Google Scholar]
- 13.Jacobs CR, Huang H, Kwon RY. Introduction to cell mechanics and mechanobiology. Garland Sci. 2012;19:151–153. [Google Scholar]
- 14.Kim Y, Joo KM, Jin J, Nam D. Cancer stem cells and their mechanism of chemo-radiation resistance. Int. J. Stem Cells. 2009;2(2):109–114. doi: 10.15283/ijsc.2009.2.2.109. [DOI] [PMC free article] [PubMed] [Google Scholar]
- 15.Kojić N, Milošević M, Petrović D, Isailović V, Sarioglu AF, Haber DA, Kojić M, Toner MA. Computational study of circulating large tumor cells traversing microvessels. Comput. Biol. Med. 2015;63:187–195. doi: 10.1016/j.compbiomed.2015.05.024. [DOI] [PMC free article] [PubMed] [Google Scholar]
- 16.Lammerding J, Dahl KN, Discher DE, Kamm RD. Methods in cell biology. Nucl. Mech. Methods. 2007;83:269–294. doi: 10.1016/S0091-679X(07)83011-1. [DOI] [PubMed] [Google Scholar]
- 17.Lee GYH, Lim CT. Biomechanics approaches to studying human diseases. Trends Biotechnol. 2007;25:111–118. doi: 10.1016/j.tibtech.2007.01.005. [DOI] [PubMed] [Google Scholar]
- 18.Lekka M, Laidler P, Gil D, Lekki J, Stachura Z, Hrynkiewicz AZ. Elasticity of normal and cancerous human bladder cells studied by scanning force microscopy Eur. Biophys. J. 1999;28:312–316. doi: 10.1007/s002490050213. [DOI] [PubMed] [Google Scholar]
- 19.Li Y, Schnekenburger J, Duits MHG. Intracellular particle tracking as a tool for tumor cell characterization. J. Biomed. Opt. 2009;14(6):1–7. doi: 10.1117/1.3257253. [DOI] [PubMed] [Google Scholar]
- 20.Lim CT, Zhou EZ, Quek ST. Mechanical models for living cells– a review. J. Biomech. 2006;39:195–216. doi: 10.1016/j.jbiomech.2004.12.008. [DOI] [PubMed] [Google Scholar]
- 21.Lincoln B, Erickson HM, Schinkinger S, Wottawah F, Mitchell D, Ulvick S, Bilby C, Guck J. Deformability-based flow cytometry. Cytom. A. 2004;59(2):203–209. doi: 10.1002/cyto.a.20050. [DOI] [PubMed] [Google Scholar]
- 22.Louie E, Nik S, Chen J, Schmidt M, Song B, Pacson C, Chen XF, Park S, Ju J, Chen E. Identification of a stem-like cell population by exposing metastatic breast cancer cell lines to repetitive cycles of hypoxia and reoxygenation. Breast Cancer Res. 2010;12(6):R94. doi: 10.1186/bcr2773. [DOI] [PMC free article] [PubMed] [Google Scholar]
- 23.Mason TG, Ganesan K. Particle tracking microrheology of complex fluids. Phys. Rev. Lett. 1997;79:3282–3285. doi: 10.1103/PhysRevLett.79.3282. [DOI] [Google Scholar]
- 24.Merryman WD, Bieniek PD, Guilak F, Sacks MS. Viscoelastic properties of the aortic valve interstitial cell. J. Biomech. Eng. 2009;131(4):041005. doi: 10.1115/1.3049821. [DOI] [PMC free article] [PubMed] [Google Scholar]
- 25.Pai A, Sundd P, Tees DFJ. In situ microrheological determination of neutrophil stiffening following adhesion in a model capillary. Ann. Biomed. Eng. 2008;36:596–603. doi: 10.1007/s10439-008-9437-8. [DOI] [PubMed] [Google Scholar]
- 26.Pangarkar C, Dinh AT, Mitragotri S. Dynamics and spatial organization of endosomes in mammalian cells. Phys. Rev. Lett. 2005;95:158101. doi: 10.1103/PhysRevLett.95.158101. [DOI] [PubMed] [Google Scholar]
- 27.Petrie RJ, Koo H, Yamada KM. Generation of compartmentalized pressure by a nuclear piston governs cell motility in 3D matrix. Science. 2014;345(6200):1062–1065. doi: 10.1126/science.1256965. [DOI] [PMC free article] [PubMed] [Google Scholar]
- 28.Prise KM, Saran A. Concise review: stem cell effects in radiation risk. Stem Cells. 2011;29:1315–1321. doi: 10.1002/stem.690. [DOI] [PubMed] [Google Scholar]
- 29.Sato M, Theret DP, Wheeler LT, Ohshima N, Nerem RM. Application of the micropipette technique to the measurement of cultured porcine aortic endothelial cell viscoelastic properties. J. Biomech. Eng. 1990;112:263–268. doi: 10.1115/1.2891183. [DOI] [PubMed] [Google Scholar]
- 30.Schmid-Schonbein GW, Sung KL, Tozeren H, Skalak R, Chien S. Passive mechanical properties of human leukocytes. Biophys. J. 1981;36:243–256. doi: 10.1016/S0006-3495(81)84726-1. [DOI] [PMC free article] [PubMed] [Google Scholar]
- 31.Sehl ME, Shimada M, Landeros A, Lange K, Wicha MS. Modeling of cancer stem cell state transitions predicts therapeutic response. PLoS ONE. 2015;10(9):e0135797. doi: 10.1371/journal.pone.0135797. [DOI] [PMC free article] [PubMed] [Google Scholar]
- 32.Sheridan C, Kishimoto H, Fuchs RK, Mehrotra S, Bhat-Nakshatri P, Turner CH, Jr R. Goulet, S. Badve, and H. Nakshatri. CD44+/CD24- breast cancer cells exhibit enhanced invasive properties: an early step necessary for metastasis. Breast Cancer Res. 2006;8(5):R59. doi: 10.1186/bcr1610. [DOI] [PMC free article] [PubMed] [Google Scholar]
- 33.Snider J, Lin F, Zahedi N, Rodionov V, Yu CC, Gross SP. Intracellular actin-based transport: how far you go depends on how often you switch. Proc. Natl. Acad. Sci. USA. 2004;101:13204–13209. doi: 10.1073/pnas.0403092101. [DOI] [PMC free article] [PubMed] [Google Scholar]
- 34.Stroka KM, Gu Z, Sun SX, Konstantopoulos K. Bioengineering paradigms for cell migration in confined microenvironments. Curr. Opin. Cell Biol. 2014;30:42–50. doi: 10.1016/j.ceb.2014.06.001. [DOI] [PMC free article] [PubMed] [Google Scholar]
- 35.Stroka KM, Jiang H, Chen S, Tong Z, Wirtz D, Sun SX, Konstantopoulos K. Water permeation drives tumor cell migration in confined microenvironments. Cell. 2014;157:611–623. doi: 10.1016/j.cell.2014.02.052. [DOI] [PMC free article] [PubMed] [Google Scholar]
- 36.Sundd P, Zou X, Goetz DJ, Tees DFJ. Leukocyte adhesion in capillary-sized, P selectin-coated micropipettes. Microcirculation. 2008;15:109–122. doi: 10.1080/10739680701412971. [DOI] [PubMed] [Google Scholar]
- 37.Tees DFJ, Waugh RE, Hammer DA. A microcantilever device to assess the effect of force on the lifetime of selectin-carbohydrate bonds. Biophys. J. 2001;80:668–682. doi: 10.1016/S0006-3495(01)76047-X. [DOI] [PMC free article] [PubMed] [Google Scholar]
- 38.Thiery JP, Sleeman JP. Complex networks orchestrate epithelial-mesenchymal transitions. Nat. Rev. Mol. Cell Biol. 2006;7:131–142. doi: 10.1038/nrm1835. [DOI] [PubMed] [Google Scholar]
- 39.Tseng Y, Kole TP, Wirtz D. Micromechanical mapping of live cells by multiple-particle-tracking microrheology. Biophys. J. 2002;83:3162–3176. doi: 10.1016/S0006-3495(02)75319-8. [DOI] [PMC free article] [PubMed] [Google Scholar]
- 40.Wirtz D, Konstantopoulos K, Searson PC. The physics of cancer: the role of physical interactions and mechanical forces in metastasis. Nat. Rev. Cancer. 2011;11:512–522. doi: 10.1038/nrc3080. [DOI] [PMC free article] [PubMed] [Google Scholar]
- 41.Wu ZZ, Zhang G, Long M, Wang HB, Song GB, Cai SX. Comparison of the viscoelastic properties of normal hepatocytes and hepatocellular carcinoma cells under cytoskeletal perturbation. Biorheology. 2000;37:279–290. [PubMed] [Google Scholar]
- 42.Wyckoff JB, Jones JG, Condeelis JS, Segall JE. A critical step in metastasis: in vivo analysis of intravasation at the primary tumor. Cancer Res. 2000;60:2504–2511. [PubMed] [Google Scholar]
- 43.Yanai M, Butler JP, Suzuki T, Kanda A, Kurachi M, Tashiro H, Sasaki H. Intracellular elasticity and viscosity in the body, leading, and trailing regions of locomoting neutrophils. Am. J. Physiol. Cell Physiol. 1999;277:C432–C440. doi: 10.1152/ajpcell.1999.277.3.C432. [DOI] [PubMed] [Google Scholar]
- 44.Yanai M, Butler JP, Suzuki T, Sasaki H, Higuchi H. Regional rheological differences in locomoting neutrophils. Am. J. Physiol. Cell Physiol. 2004;287:C603–C611. doi: 10.1152/ajpcell.00347.2003. [DOI] [PubMed] [Google Scholar]
- 45.Yap B, Kamm RD. Mechanical deformation of neutrophils into narrow channels induces pseudopod projection and changes in biomechanical properties. J. Appl. Physiol. 2005;98:1930–1939. doi: 10.1152/japplphysiol.01226.2004. [DOI] [PubMed] [Google Scholar]
- 46.Zhou EH, Quek ST, Lim CT. Power-law rheology analysis of cells undergoing micropipette aspiration. Biomech. Model. Mechanobiol. 2010;9:563–572. doi: 10.1007/s10237-010-0197-7. [DOI] [PubMed] [Google Scholar]