

Abstract
Introduction
Controlling gene expression is a fundamental goal of basic and synthetic biology because it allows insight into cellular function and control of cellular activity. We explored the possibility of generating an optogenetic repressor of gene expression in the model organism Saccharomyces cerevisiae by using light to control the nuclear localization of nuclease-dead Cas9, dCas9.
Methods
The dCas9 protein acts as a repressor for a gene of interest when localized to the nucleus in the presence of an appropriate guide RNA (sgRNA). We engineered dCas9, the mammalian transcriptional repressor Mxi1, and an optogenetic tool to control nuclear localization (LINuS) as parts in an existing yeast optogenetic toolkit. This allowed expression cassettes containing novel dCas9 repressor configurations and guide RNAs to be rapidly constructed and integrated into yeast.
Results
Our library of repressors displays a range of basal repression without the need for inducers or promoter modification. Populations of cells containing these repressors can be combined to generate a heterogeneous population of yeast with a 100-fold expression range. We find that repression can be dialed modestly in a light dose- and intensity-dependent manner. We used this library to repress expression of the lanosterol 14-alpha-demethylase Erg11, generating yeast with a range of sensitivity to the important antifungal drug fluconazole.
Conclusions
This toolkit will be useful for spatiotemporal perturbation of gene expression in Saccharomyces cerevisiae. Additionally, we believe that the simplicity of our scheme will allow these repressors to be easily modified to control gene expression in medically relevant fungi, such as pathogenic yeasts.
Electronic supplementary material
The online version of this article (10.1007/s12195-019-00598-9) contains supplementary material, which is available to authorized users.
Keywords: Optogenetics, dCas9, Gene expression, LINuS, Fungal drug resistance
Introduction
The modified type II CRISPR (clustered regularly interspersed palindromic repeats) system from bacteria serves as a versatile platform for genome editing23,25 and transcriptional modulation50 due to its ability to be targeted to specific DNA sequences using complementary guide RNAs.25 This single RNA-single protein CRISPR system is derived from the natural adaptive immune response of bacteria and archaea. In the type II CRISPR/Cas system, a ribonucleoprotein complex formed from a single protein (Cas9), a short CRISPR RNA (crRNA), and a trans-acting crRNA (tracrRNA) can carry out efficient crRNA-directed recognition and site-specific cleavage of foreign DNA.9,25 This system was further simplified by the development of a chimeric single-guide RNA (sgRNA) and a Cas9 protein from the Streptococcus pyogenes CRISPR. Together these two components are sufficient for targeting the Cas9 protein to a specific DNA sequence dictated entirely by the sgRNA which is complementary to it.
In addition to functioning as a site-specific nuclease, the endonuclease domains of the Cas9 protein can be mutated to create a programmable RNA-dependent DNA binding protein.50 Targeting of the catalytically inactive Cas9 protein (nuclease-dead or dCas9) to the promoter or coding region of a gene can block transcription initiation or sterically block RNA polymerase binding or elongation, leading to suppression of transcription. Nuclease-dead dCas9 is attractive as a repressor, as Cas9 is known to have a long residence time (on the order of hours) when guide RNAs with full complementarity to the genomic target are utilized.39 Use of dCas9 as a repressor at endogenous loci avoids the need for extensive engineering or circuitry as repression requires only two components: dCas9 and the sgRNA. When dCas9 is used to block transcription in bacteria, gene repression up to 99.9% is possible.50 Using dCas9 and a single gRNA in yeast has been shown to have only modest effects on gene expression regulation ranging from no effect to 2–3 fold repression,8,12,62 though Gilbert and colleagues reported up to 18-fold downregulation of reporter gene activity.18,32 The repressor ability of dCas9 can be increased by addition of a yeast or mammalian transcriptional repressor domain. The mammalian transcriptional repressor, Mxi1, is reported to interact with the chromatin modifying histone deacetylase Sin3 homolog in yeast.18,54 Targeting repression with dCas9-Mxi1 has been shown to repress reporter gene activity up to 53-fold.18 Other fusions with different repressive domains have been tested, with most failing to achieve as strong a repression as Mxi114 (though see Lian et al. for an exception35).
The ability to temporally and spatially control the repressive ability of dCas9 and dCas9-Mxi1 fusions would enable the study and control of gene function at specific times and places in individual or populations of yeast cells.15 A relatively straightforward approach to temporally control dCas9 activity is to regulate its transcription through an inducible promoter.11,19 It is also possible to regulate dCas9 by controlling expression of the guide RNA, for example, through drug-inducible sgRNA expression.2,28 However, these approaches have slow response times due to the timescale required for transcription and translation.19 To circumvent these issues, post-translational control methods have been developed.15 Insertion of ligand-responsive inteins and hormone-binding domains into Cas9 have been used to make the activity of the protein controllable with addition of small molecules.7,36,46 Strategies based on chemically induced dimerization of split protein fragments, for example the rapamycin-mediated dimerization of FK506 binding protein 12 (FKBP) and FKBP rapamycin binding domain (FRB),13 also reconstitute Cas9 activity in the presence of a small molecule.64 Small molecule-mediated inhibition or degradation of Cas9 add variety to the repertoire of control approaches.29,41,51,52,55 It is also possible to control Cas9 activity through chemical control of the guide RNA activity.31,37,61
Optical approaches have the added advantage of allowing for spatial precision, so that dCas9 repressive activity can be triggered in specific places as well as at specific times. Spatial control is important for understanding the role of gene expression in regulating spatially heterogeneous processes, such as the development of a fungal biofilm. Light-inducible approaches have largely mimicked the chemical approaches including complementation of Cas9 fragments, light-induced two-hybrid systems, and photolysis of a caged unnatural amino acid.20,43,44,49 Development of these systems required extensive engineering and screening in addition to the expression of multiple genes, e.g. fusions of photo-associating domains with Cas9 fragments.
In this article, we explore the possibility of using light-induced nuclear localization to optogenetically control the activity of dCas9 variants in a single polypeptide format. Repressors require access to the nucleus to function, and control of localization is a conceptually simple method of regulation that might allow for control of different Cas9 variants as well as control in diverse eukaryotic species. We put the nuclear accumulation of the dCas9 or dCas9-Mxi1 repressors under optogenetic control using LINuS, an optogenetic tool for controlling the nuclear localization of proteins of interest with blue light.45 By testing different configurations of the dCas9, Mxi1, and LINuS domains we were able to achieve weak light-controlled repression. Our results suggest future directions to improve repression through optical control of nuclear localization. To improve the utility of our tool, we engineered the repressors into an existing yeast optogenetic toolkit1,33 to allow for rapid construction and integration of the repressor targeted to a gene of interest through an appropriate guide RNA. Interestingly, we found that basal (dark) repression by different repressor configurations allowed us to create populations of yeast with gene expression spanning a 100-fold range. This could be a powerful tool for generating heterogeneous populations of cells and studying their response to stimuli, including stress and drug treatment. This work provides a useful foundation for developing an optogenetic toolkit for repressing gene expression at a S. cerevisiae gene of interest. We expect that the simplicity of our scheme will allow it to be adapted to other important fungal organisms, including Candida albicans, to allow the role of gene expression in biofilm formation, drug resistance, and virulence to be better studied.
Materials and Methods
Yeast Strains and Growth Conditions
All yeast strains used in this study are listed in the supplemental information (Supplemental Table S1). The strain background used in this study is FY HAP1+22,63 or BY4741.4TEF1-GFP and TEF1-mCherry reporter strains were created to test the function of the light-inducible repressors. We utilized yeast strain yMM1032 (FY Matα ura3Δ0 his3Δ200 leu2Δ0 lys2-1280 trp1Δ63 HAP1+) and tagged the TEF1 gene at its endogenous locus by amplifying either mCherry-hphMX or GFP-KanMX with primers containing appropriate homology downstream to the native TEF1 (Supplemental Table S1) and transforming this product using standard lithium-acetate transformation.17 After selection on appropriate media (YPD agar + 300 µg/mL Hygromycin B or 200 µg/mL G418) and confirmation by colony PCR and confirmation of tagging by Sanger sequencing we obtained yMM1384 (FY Matα ura3Δ0 his3Δ200 leu2Δ0 lys2-1280 trp1Δ63 HAP1 + TEF1-mCherry-hphMX) and yMM1385 (FY Matα ura3Δ0 his3Δ200 leu2Δ0 lys2-1280 trp1Δ63 HAP1 + TEF1-GFP-KanMX). To test for light-induced nuclear-localization of our dCas9 LINuS fusion proteins we obtained a strain with a fluorescently labelled nucleus by utilizing yeast strain yMM84 (Matα ura3Δ0 his3Δ1 leu2Δ0 lys2Δ0) and tagging the nuclear protein Nhp6A by amplifying iRFP with primers containing appropriate homology downstream to the native NHP6A (Supplemental Table 1) and proceeding with transformation and verification as described for TEF1 tagging.
Standard yeast media was used for all experiments.6 Yeast strains for transformation were grown to mid-log in YPD. Once transformed, yeast strains containing plasmids were maintained on appropriate Synthetic Complete (SC) media lacking amino acids needed to select for the plasmids (i.e. SC-URA-LEU). Selective SC consisted of yeast nitrogen base (BD Difco #291940), amino acid mix with appropriate amino acids dropped out and a final concentration of 2% glucose. Yeast assayed for fluorescence via flow cytometry were grown in low fluorescence media lacking riboflavin and folic acid as previously described40,56 with the modification that we used a commercially available low fluorescence yeast nitrogen base (Formedium #CYN6501).
Plasmid Construction
All plasmids use in this study are listed in Supplemental Table S2. Plasmids were constructed using recombination-mediated plasmid construction as previously described.10,38,47 The backbone plasmids, donor plasmids, and primers used are listed in Supplemental Table S4. Briefly, appropriate primers were used to amplify from donor DNA a cassette containing appropriate overhangs to recombine with the linearized backbone. Insert(s) and backbones were transformed into yeast strain yMM1032 and selected on SC-URA or SC-LEU to select for yeast containing appropriately repaired plasmid. Plasmids from separate colonies were then prepped from yeast using the Zymoprep Yeast Plasmid Miniprep Kit (ZymoResearch #D2004) and transformed into chemically competent DH5alpha E. coli to be further amplified. Plasmids were then prepped from E. coli and correct plasmid construction was confirmed by restriction enzyme digest followed by Sanger sequencing.
Induction of Repression and Blue Light Delivery
Blue light induction of repression was done in one of two ways. Cultures of yeast were either exposed to blue light on (1) a Light Plate Apparatus (LPA)16 in a dark coffin-shaker (250 rpm) at 30°C or (2) in culture tubes on a roller drum inside a light-proof 30°C incubator using LEDs fitted to the incubator and roller drum using custom hardware. Light intensity was measured using a standard photodiode power sensor and power meter (Thorlabs #S120VC, Thorlabs #PM100D). For illumination via LPA yeast cells carrying appropriate plasmid combinations were grown overnight to saturation and then diluted to an OD600 of 0.01. Cells were grown overnight (12–16 h) in a black 24-well polystyrene assay plate (Artic White, AWLS-303008) on the LPA. One glass microbead (Fisher Scientific 11-312A 3 mm or 11-312B 4 mm) was added to each well of the plate to increase aeration. All LPAs utilized in this study were calibrated as described in Sweeney et al.60 so that uniform light doses could be delivered between LPAs and between experiments. LPAs were programmed to deliver varying light intensities or duty cycles as described in the main text. For illumination via custom hardware on the roller drum, yeast cells carrying appropriate plasmid combinations were grown overnight to saturation and then diluted to an OD600 of 0.01. Cells were grown overnight (12–16 h) in either clear (Falcon #1495970C) or black (Millipore Sigma LightSafe # TB1500) 15 mL conical tubes capped with aluminum foil to allow for gas exchange. Tubes were placed on a roller drum in an incubator fitted with blue LEDs in a custom configuration. An average illumination of ~ 25 µW/cm2 was measured for cultures grown in this configuration. At each light intensity and for each dCas9 construct, we performed experiments in at least triplicate with biological replicates (individual colonies from the transformation with dCas9).
Time-Course of Repression
Cultures were grown in low fluorescence media without leucine or uracil (LFM-L-U). Yeast strain yMM1385 transformed with dCas9 repressors (pMM469, 472, 488, or 499) and a guide RNA or empty control (pMM473 or pMM7) was grown overnight in black 15 mL conical tubes. In the morning, cells were diluted to OD600 0.01 and 1 mL of this diluted culture was transferred to the Light Plate Apparatus (LPA) with a glass bead (Fisher Scientific 11-312A 3 mm or 11-312B 4 mm). Cultures were grown at 30°C in a light-proof coffin shaker at 100 µW/cm2 blue light and samples were taken every 4 h. At each timepoint, 50 µL of culture was removed and stored in 150 µL of PBS2 + 2% Tween-20 at 4°C. After 24 h all samples were taken for flow cytometry as described below.
Multiple dilution experiments were performed in LFM-L-U. Yeast strain yMM1385 transformed with dCas9 repressors (pMM469, 472, 488, or 499) and a guide RNA or empty control (pMM473 or pMM7) was grown overnight in black 15 mL conical tubes. In the morning, cells were diluted to OD600 0.01 and 1 mL of this diluted culture was transferred to the Light Plate Apparatus (LPA) with a glass bead (Fisher Scientific 11-312A 3 mm or 11-312B 4 mm). Cultures were grown at 30°C in a light-proof coffin shaker at 100 µW/cm2 blue light and samples (50 µL) were taken every 6 h. After 12 h samples were diluted to an OD600 of ~ 0.01. Flow cytometry was carried out every 24 h. Rainbow beads (Thermo Fisher Scientific #556286) were used to calibrate the voltage settings on the flow cytometer so that samples could be compared between days.
Flow Cytometry
Repression and gene expression variability of Tef1-GFP was assayed by fluorescence using flow cytometry. Two different cytometry instruments were employed. Samples analyzed using a BD LSRII multi-laser analyzer (488 nm laser and 505 LP dichroic filter) were grown overnight to saturation and diluted back to OD600 0.01. Blue light was delivered as described above for 16 h. Cells were then diluted by adding 250 µL of culture to 800 µL of PBS/0.1% Tween-20 and kept on ice until measurement. Samples analyzed on an Attune NxT Flow Cytometer were grown overnight to saturation and diluted back to OD600 0.01. Blue light was delivered for 12–16 h as described above. To prepare for cytometry, 50 µL of culture was diluted into 150 µL of PBS/0.1% Tween-20 in a 96-well plate (Corning #3788) and kept on ice until measurement. Samples were analyzed on the Attune using a 96-well autosampler and the 488 nm laser and 530/30 filter.
Quantification of Flow Cytometry Data
Flow cytometry data was analyzed using FlowJo or custom-written MATLAB code. Samples were gated by forward and side-scatter to include single cells. Samples were then gated by fluorescence based on non-fluorescent control strains. Unless otherwise indicated, the median fluorescence value was used to quantify the fluorescence of a population of cells. Appropriate statistical tests were used to determine the significance of changes in fluorescence, as described in the main text and figure captions where appropriate.
Localization of dCas9-mRUBY2-LINuS
To generate strains containing fluorescently tagged dCas9 fused to LINuS we created plasmid pMM771 (ConLS-pCCW12-dCas9-mRuby-LINuS-tENO1-ConRE-Ura3-Ura3’-ColE1-KanR-Ura5’) using the yeast toolkit construction scheme (see below), digested this plasmid with NotI and transformed the resulting linear DNA into yMM1442 (MAT alpha his3Δ1 leu2Δ0 lys2Δ0 MET15 ura3Δ0 NHP6A-iRFP) using standard yeast transformation techniques as described above. Confirmed transformants were grown overnight in black 15 mL conical tubes in low fluorescence media lacking uracil (LFM-U). Overnight cultures were then diluted to OD600 0.05 and grown for ~ 5 h. Optical 96-well plates (Nunc #265300) were then coated with 30 µL of 2 mg/mL concanavalin A as previously described21 and incubated at room temperature for 5 min. Then 100 µL of culture was added to the wells and allowed to settle for 10 min. Excess culture was removed and cells were washed with fresh LFM-U to remove nonadherent cells followed by the addition of 100 µL of fresh LFM-U. Cells were imaged and stimulated on a Nikon Eclipse-TI inverted microscope using a ×40 air objective (Nikon 40x Plan Apo) and Clara CCD camera (Andor DR328G, South Windsor, Connecticut, United State of America). Cells were stimulated with 470 nm blue light (Chroma 49002 GFP filter Cube, 470/40x) at ND16, resulting in a light intensity of 1.0 W/cm2. mRUBY2 fluorescence was visualized at excitation 560 nm and 630 nm emission (Chroma 96365, ex560/40x, em630/75 m) and iRFP was visualized at 650 nm excitation, 720 nm emission (Chroma 49006, ex650/45x, em720/60 m). For the dark control, mRUBY2 and iRFP images were taken every 2 min for 8 min. For the blue light stimulated samples, the program was the same, except that cells were stimulated with blue light for 1 min after the first image was taken, followed by mRUBY2 and iRFP images for 8 min.
Growth Curve
Cells were grown to an OD600 of 0.2–0.7 then diluted to an OD600 of 0.05 and put in a 96-well plate (Corning #3370). Growth curves were generated by a Tecan Infinite M1000 plate reader. Cells were grown for 60 h with continuous double orbital shaking (120 rpm) and OD600 readings taken every 30 min. Four readings were taken for each well for every time point. Growth rate µ was determined for the culture in each well (except for the dCas9-Mxi1 samples) by fitting the log-transformed OD600 readings to the modified Gompertz equation described in Reference 65 using the Trust Region Reflective algorithm implemented in SciPy.5,26 The dCas9-Mxi1 strains grew too slowly to fit well to the Gompertz equation, and so µ was not determined for these strains. We observed that in some cases the early time points were too dilute to give consistent readings in the Tecan so rather than normalizing by the starting reading as described in Zwietering et al.65 we added a fourth parameter N0 to represent the starting concentration and fit the equation y = A exp(− exp(µ * e * (λ − t)/A + 1)) + log N0 where y is the log-transformed OD600 readings.
Domestication and Creation of yOTK Parts Plasmids
Part plasmids added to the yeast optogenetic toolkit (yOTK)1,33 format are shown in Supplemental Table S5. To comply with the yeast optogenetic toolkit (yOTK) format parts must be domesticated by removal of BsmBI, BsaI, and NotI restriction enzyme sites. dCas9 (pMM386) was mutated using the Q5 mutagenesis kit and protocol to remove an internal BsaI site. The restriction enzyme site went from GAGACC to GAAACC. This was confirmed using Sanger sequencing and resulted in pMM814.
Part plasmids were constructed using Golden Gate assembly as previously described.33 Briefly, the region of interest was amplified using PCR with appropriate primers allowing for Golden Gate Assembly by adding a BsmBI digestion site. This product was then combined with the entry vector (pMM452) at a 1:1 molar ratio (20 fmol of both) as well as 1 µL of T4 ligase buffer, 0.5 µL of T7 ligase, and 0.5 µL of BsmBI. This reaction was put in a thermocycler with the following protocol: 25 cycles of 2 min at 42°C and 5 min at 16°C, then 10 min at 60°C and 10 min at 80°C. This reaction was then transformed into E. coli, plasmids were confirmed by screening for white colonies and then prepped for confirmation by restriction enzyme digestion followed by Sanger sequencing.
To create guide RNA parts to target dCas9 constructs to specific genomic loci, guide RNAs (sgRNAs) were constructed according to Reference 33. Oligos were annealed together by adding 0.5 µL of the top oligo (100 µM), 0.5 µL of the bottom oligo (100 µM), 5 µL of 10x T4 Ligase Buffer, 1 µL of T4 polynucleotide Kinase, and 43 µL of H20. This was run in the thermocycler for 30 min at 37°C, 5 min at 95°C, and slowly cooled to 4°C. Then 2 µg of the sgRNA entry vector (pMM736) was digested with 1 µL BsmBI, 5 µL 10x NEB3.1, and H2O to 50 µL. This was digested for 1 h at 55°C. Then 1 µL of alkaline phosphatase (CIP, New England Biolabs #M0290) was added and incubated for 1 h at 37°C. The backbone was purified using the GeneJet gel extraction protocol. Then, 0.5 µL of the annealed oligos, 0.5 µL of T4 DNA ligase, 1 µL of 10x T4 DNA ligase buffer, 20–40 ng of vector and H2O to 10 µL were combined. This was run in the thermocycler for 30 min at 16°C, 10 min at 65°C, and cooled to 25°C, 5 µL of the ligated sgRNA was transformed into chemically competent E. coli, plasmids were confirmed by screening for white colonies and then prepped for confirmation by restriction enzyme digestion followed by Sanger sequencing.
Golden Gate Assembly of Cassette and Multigene Plasmids
Part plasmids (Supplemental Table S5) were used to construct cassette plasmids (consisting of transcriptional units, i.e. promoter-coding sequence-terminator, Supplemental Table S6) and multigene plasmids (consisting of multiple transcriptional units linked together through assembly connectors with appropriate homology to integrate into the yeast genome, Supplemental Table S7). These were assembled using BsaI or BsmBI assembly as outlined in Lee et al.33 and An-Adirekkun et al.1 NEB Golden Gate assembly mix (E1600) was used for BsaI assembly. The 10 μL Golden Gate reaction mixture consisted of 1 μL of NEB Golden Gate Buffer (10x), 0.5 μL NEB Golden Gate assembly mix, 20 fmol of each plasmid, and water. We found that using commercially available NEB Golden Gate assembly mixture, as opposed to using BsaI, T7 Ligase, and T4 Ligase buffer, increases the reaction efficiency greatly. For BsmBI assembly, the protocol was adapted from Lee et al.33 and each 10 μL BsmBI reaction mixture consisted of 0.5 μL BsmBI, 0.5 μL T7 Ligase, 1 μL T4 Ligase buffer, 20 fmol of each plasmid, and H2O.
The thermocycler program was adapted from Lee et al.33 and consisted of 20-30 cycles of digestion and ligation (2 min at 37–42°C; 5 min at 16°C) followed by a final digestion (55–60°C) and a heat inactivation step (80°C for 10–20 min). For final cassettes with internal BsaI cut sites (i.e. integration vectors), the reaction was ended with ligation, and final digestion and inactivation steps were omitted. 5 μL of reaction mixture was then transformed into DH5α competent E. coli cells and plated on LB plates with appropriate antibiotics. Plasmids were then extracted, digested with BsmBI or NotI-HF as a first-pass test, and sequenced with appropriate primers for final verification. For both BsaI and BsmBI assemblies, the efficiencies were found to be at least 50%. However, final cassettes with internal BsaI cut sites have notably lower assembly efficiency.
Assessment of Fluconazole Resistant Phenotypes
Yeast strains (yMM1518-1524, Supplemental Table S1) carrying different dCas9 constructs as well as an ERG11 sgRNA were grown overnight in black 15 mL conical tubes in low fluorescence media without uracil (LFM-U). These overnight cultures were diluted to an OD600 of 0.1 and serially diluted 1:10, 1:100, 1:1000. A spot analysis was performed by frogging these dilutions onto a synthetic complete agar plate lacking uracil (SC-U) with or without 32 mg/mL fluconazole (Sigma-Aldrich #1271700). The working stock of fluconazole was dissolved in DMSO, and equal amounts of DMSO were added to both the control and fluconazole plates. Strains were grown at room temperature in ambient (~ 45 μW/cm2, 488 nm wavelength) light for 3 days before imaging.
Results
Generation of a Light-Inducible Repressor Using LINuS
We used the promoter of the TEF1 gene as a proof-of-principle target of repression. TEF1 codes for the translational elongation factor EF-1α.53 Loss of function of TEF1 is buffered by the presence of a paralog, TEF2. It has previously been shown that targeting dCas9 to the TEF1 promoter leads to repression of gene expression due to steric hinderance.18,24 We verified that a constitutively localized dCas9 (dCas9 containing a C-terminal SV40 NLS18) induced repression in our TEF1-GFP reporter strain when co-transformed with an appropriate guide RNA (sgTEF1) under the control of the SNR52 RNA polymerase III promoter (Supplemental Fig. 1).18
In order to control the nuclear concentration of the dCas9 repressor, we removed the SV40 NLS and fused dCas9 to LINuS, an optogenetic tool that allows blue light control of nuclear import of proteins of interest.45 LINuS is based on the second Light Oxygen Voltage (LOV) domain of Avena sativa phototrophin 1 (AsLOV2). A nuclear localization signal (NLS) is introduced into the C-terminal Jα helix of the AsLOV2 domain such that, when the Jα helix unfolds and undocks from the AsLOV2 core in response to blue (~ 450 nm to 495 nm) light absorption, the NLS can be recognized and bound by endogenous importins (Fig. 1a). We experimented with fusing LINuS to both dCas9 and dCas9 tagged with the red fluorescent protein mCherry (dCas9-mCherry) (Fig. 1b) to allow blue light-mediated nuclear localization and repression by dCas9 (Fig. 1c). Plasmids containing either dCas9-LINuS or dCas9-mCherry-LINuS were co-transformed with a plasmid carrying the sgTEF1 guide RNA18 into yeast expressing the Tef1 protein tagged with GFP (Tef1-GFP). Repression of gene expression was assayed by flow cytometry. We verified for all blue light stimulation experiments that repression was not due to photobleaching. Indeed, stimulation with maximal (100 µW/cm2) blue light for up to 12 h does not lead to detectable photobleaching (Supplemental Fig. 2).
Figure 1.

(a) In the dark state, the Jα helix in LINuS is folded and interacts with the AsLOV2 core domain. This sequesters the nuclear localization signal (NLS) and prevents it from interacting with importins. Upon blue light exposure, the Jα helix unfolds rendering the NLS accessible. (b) Schematic of the dCas9-LINuS and dCas9-mCherry-LINuS used in this study. pTDH3 is a constitutively strong promoter. (c) Blue light induces unfolding of the Jα helix, allowing endogenous importins to interact with the nuclear localization signal allowing dCas9-mCherry-LINuS to be imported into the nucleus where it sterically inhibits transcription by binding to promoters or coding regions as guided by the appropriate sgRNA.
In dark conditions, when the NLS within LINuS is photocaged, we observed in the dCas9-LINuS-expressing cells a small (1.5-fold) but significant repression of gene expression (Supplemental Fig. 3). We attribute this basal repression to the known low levels of unfolding of the LOV2 Jα helix even in the dark, which leads to accumulation of the repressor in the nucleus.59 Fusion of dCas9 to mCherry alleviates this basal repression, perhaps due to increased protein size or accessibility of the NLS. Exposing the cells containing both dCas9-mCherry-LINuS and sgTEF1 to 100 µW/cm2 blue light (470 nm) resulted in a modest (1.6-fold), but significant light-induced repression in Tef1-GFP protein levels (Fig. 2). In an attempt to reduce the leakiness of the system, we added a nuclear export signal (NES) to the constructs. The NES is constitutively active, and therefore able to bring the proteins that are imported in the nucleus during the dark phase back into the cytosol.45 We selected two NESs with different strengths, namely the stronger PKIt and the weaker SNUPN. Both NESs reduced the level of light-induced repression (Supplemental Fig. 4). Addition of the PKIt NES also reduced the level of basal repression in the dark while the SNUPN NES did not. This result suggests that even small amounts of basal (dark) nuclear dCas9 in the dCas9-SNUPN-mCherry-LINuS fusion are enough to cause basal repression of gene expression. Weak basal repression of TEF1 by the dCas-mCherry-LINuS and dCas9-SNUPN-mCherry-LINuS constructs did not cause a measurable growth defect, in contrast to strong repression by dCas9-Mxi1 which caused a significant reduction in cell growth (Supplemental Fig. 5a, b).
Figure 2.
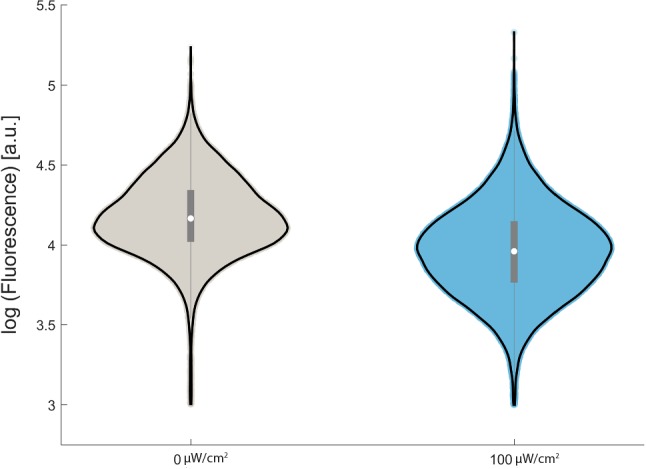
Growth in 100 µW/cm2 blue light induces a significant 1.6-fold repression of Tef1-GFP expression from the TEF1 promoter (median population fluorescence, n = 3, p < 0.00005, Welch’s T test) relative to growth in the dark. Violin plots of Tef1-GFP fluorescence in representative populations indicate that there is significant overlap between gene expression in the blue light population and the dark population.
We attempted to measure the nuclear localization of our dCas9-mCherry-LINuS construct but found that the mCherry signal was weak and difficult to measure. We therefore tagged dCas9 with a brighter red fluorescent protein, mRuby2, which is approximately 2.5 times as bright as mCherry.57 We generated the dCas9-mRuby2-LINuS construct utilizing the yeast toolkit cloning format discussed below. Using a yeast strain with a fluorescently labelled nucleus (Nhp6a-iRFP) we were able to visualize the co-localization of dCas9-mRuby2-LINuS to the nucleus in response to stimulation with blue light (Fig. 3). We found that dCas9-mRuby2-LINuS localized to the nucleus within minutes, and stayed there, consistent with its lack of an NES. However, there was also clearly some dCas9-mRuby2-LINuS nuclear localization in the dark, in agreement with the Tef1-GFP expression data (Supplemental Fig. 3).
Figure 3.

In response to stimulation with blue light, dCas9-mRuby2-LINuS localizes to the nucleus in Saccharomyces cerevisiae. Cells were stimulated with 1 W/cm2 blue light for 1 min (blue bar). Time points T1-T6 are 0, 1.3, 3.3, 5.3, 7.3, 9.3 min respectively. Localization is measured by comparing the nuclear mRuby2 signal (co-localized with Nhp6A-iRFP) to the cytoplasmic signal in individual cells (n = 108, 143 for light and dark respectively). Fold-change is measured relative to the T = 0 nuclear to cytoplasmic signal and error bars represent the 95% confidence interval.
The Mammalian Transcriptional Repressor Mxi1 Increases Light-Induced Repression and Variability of Gene Expression Within the Population
We sought to improve the repressive ability of our construct by adding the mammalian transcriptional repressor domain Mxi1.18 In our TEF1-GFP strain, dCas9-NLS-Mxi1 in combination with the sgTEF1 guide led to 52-fold repression in Tef1-GFP expression (Supplemental Fig. 1), consistent with previous results.18 We hypothesized that the order of dCas9, Mxi1 and LINuS in the fusion would be important to ensuring function of all three elements. We therefore created three different fusion proteins: Mxi1-dCas9-mCherry-LINuS, dCas9-Mxi1-mCherry-LINuS and dCas9-mCherry-LINuS-Mxi1 (Fig. 4). The N-terminal fusion of Mxi1 to dCas9 resulted in a protein that caused very modest basal repression and no additional light-induced repression (Supplemental Fig. 6) at 25 µW/cm2 light. We therefore focused on the dCas9-Mxi1-mCherry-LINuS and dCas9-mCherry-LINuS-Mxi1 fusions. The dCas9-Mxi1-mCherry-LINuS fusion produced 5-fold repression (Fig. 5a). However, this repression occurred in both the light and the dark, and we could not induce further repression by growing the cells in 25 µW/cm2 light.
Figure 4.
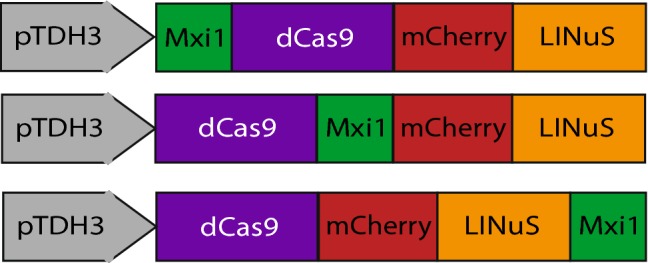
In order to explore how the orientation of the Mxi1 repressor domain affected our ability to make a light-inducible repressor we made three fusion proteins with Mxi1 in different orientations: Mxi1-dCas9-mCherry-LINuS, dCas9-Mxi1-mCherry-LINuS and dCas9-mCherry-LINuS-Mxi1.
Figure 5.

Yeast strains carrying dCas9-Mxi1-mCherry-LINuS with or without the sgTEF1 guide RNA were compared for repression in light and dark. (a) Co-transformation of dCas9-Mxi1-mCherry-LINuS with sgTEF1 leads to a 5-fold repression in median Tef1-GFP expression with or without light relative to the no guide control (median fluorescence, n = 3, p < 0.01, Welch’s t-test). (b) Violin plots demonstrate the increase in expression range in the dCas9-Mxi1-mCherry-LINuS + sgTEF1 strains with or without light relative to the control. Violin plots represent median, interquartile range, and 95% confidence interval on a representative population of cells (biological replicates).
Though dCas9-Mxi1-mCherry-LINuS reduced expression of Tef1-GFP from the TEF1 promoter, there was still significant overlap in the range of the repressed (dCas9-Mxi1-mCherry-LINuS + sgTEF1) and unrepressed (dCas9-Mxi1-mCherry-LINuS + no guide) populations (Fig. 5b). Subpopulations of yeast that express specific genes at lower levels can serve as reservoirs of phenotypic heterogeneity important for surviving environmental perturbations and drug treatments.3,34 The relative fraction of a population considered a low expresser can be defined by a relevant subpopulation ratio.3 Using the 25th and 75th quartiles of the uninduced population to define low- and high-expressors respectively, we define NL as the fraction of the population in the low state and NH as the fraction of the population in the high state. The subpopulation ratio (NL/NH) increases 60-fold due to repression by dCas9-Mxi1-mCherry-LINuS, indicating that this construct, though not light-inducible, could be used to understand the consequences of changing the ratios of low- and high-expressors in populations of S. cerevisiae.
In contrast, the dCas9-mCherry-LINuS-Mxi1 construct showed less basal repression in the dark than the dCas9-Mxi1-mCherry-LINuS construct and a modest light-induced repression when grown in both 25 µW/cm2 (data not show) and 130 µW/cm2 blue light (Fig. 6). An examination of the fluorescence distributions indicates that light increases the population of cells in a low-expressing state but also leaves a substantial fraction of the population in the high expressing state. Indeed, in response to blue light the dCas9-mCherry-LINuS-Mxi1 cells start to show bimodality in expression levels. This is potentially due to plasmid maintenance, as yeast strains maintaining two low-copy CEN6/ARS4 plasmids have been shown to display bimodality in expression.33 However, when comparing all of our dCas9 constructs, we have only seen the emergence of bimodality in strains with the Mxi1 repressor. The Mxi1 repressor is known to interact with chromatin remodelers,54 and perhaps converts a fraction of the population into a more deeply repressed state, leading to expression bimodality.48
Figure 6.
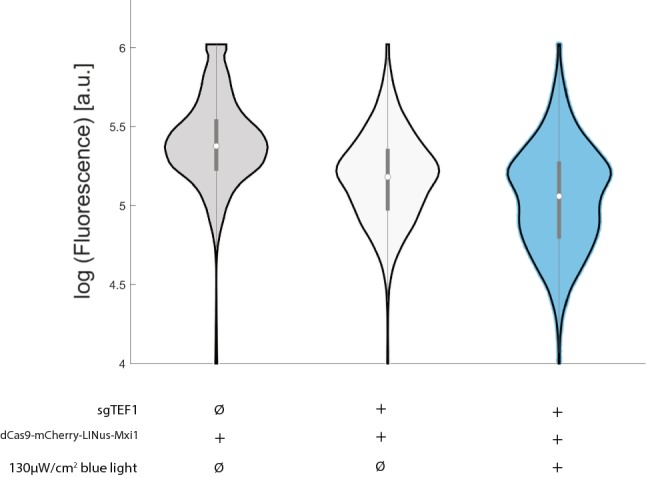
Yeast strains carrying dCas9-mCherry-LINuS-Mxi1 with or without the sgTEF1 guide RNA were compared for repression in light and dark. Co-transformation of dCas9-mCherry-LINuS-Mxi1 with sgTEF1 led to basal repression (1.7 fold) in the dark but light was able to cause a significant moderate increase in repression (1.3 fold, n = 3, p < 0.0001, Welch’s t-test). Violin plots represent median, interquartile range, and 95% confidence interval on a representative population of cells with or without 130 µW/cm2 blue light.
Modulation of Light Duty Cycle Regulates Expression Level Through the dCas9-mCherry-LINuS Repressor
We next explored the tunability of our dCas9-mCherry-LINuS repressor as a function of duty cycle. Cells containing dCas9-mCherry-LINuS and the sgTEF1 guide were grown for 12 h in the light plate apparatus at either 15 µW/cm2 or 135 µW/cm2 light intensity. Duty cycle was varied at 0%, 5%, 25%, 50%, 75%, and 100% corresponding to 1 s on/19 s off; 5 s on/15 s off; 10 s on/10 s off; 15 s on/5 s off and constantly on. Maximal repression occurred for constant light at 135 µW/cm2 (1.5-fold) corresponding to the same maximal repression we saw previously with the dCas9-mCherry-LINuS repressor. We could continuously change repression between minimal and maximal levels by varying the duty cycle (Figs. 7a and 7b). By changing duty cycle, we noticed that we could change the relative fraction of the population at the highest and lowest levels of fluorescence. Defining the subpopulation ratio as above (NL/NH), we saw that, despite a maximal change in median fluorescence of 1.5-fold, we were able to increase the subpopulation ratio up to 6-fold (Fig. 7c). This relationship holds when defining the subpopulation ratio using different thresholds (Supplemental Fig. 7). Thus by tuning the light duty cycle we can modulate the distribution of low expressors in the population, which may allow us to better understand the importance of relative expression populations.3
Figure 7.
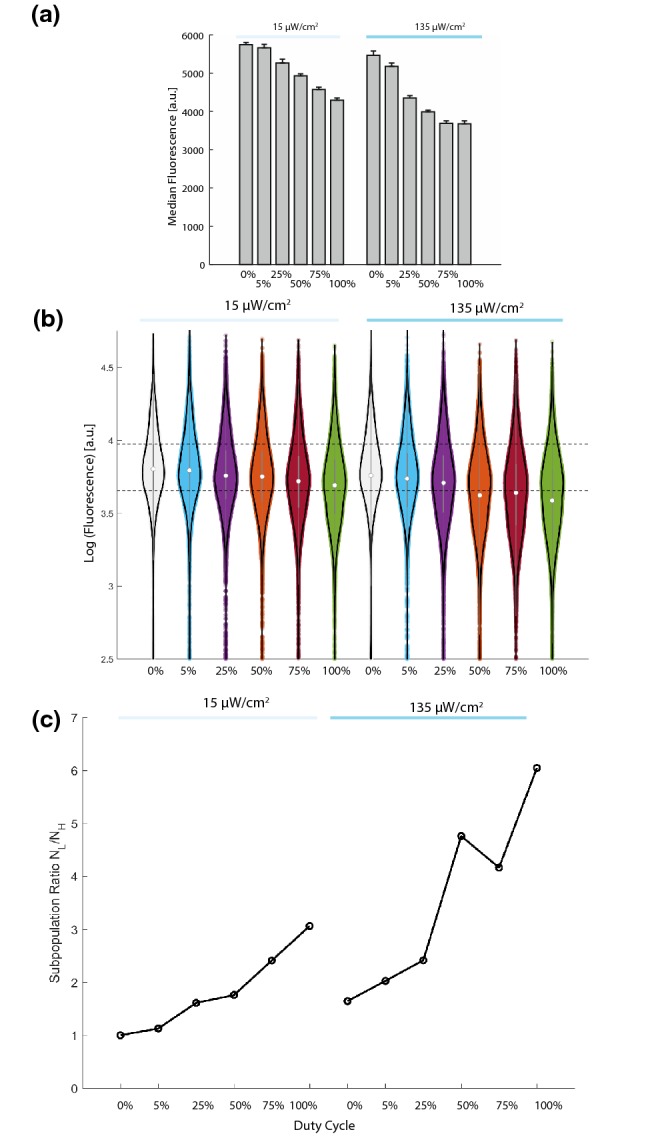
Duty cycle increases repression and expression variability in strains carrying the dCas9-mCherry-LINuS repressor. (a) Strains carrying dCas9-mCherry-LINuS and the sgTEF1 guide RNA were exposed to cycles of 15 µW/cm2 or 135 µW/cm2 blue light at increasing duty cycle (0% off 5% 1 s on/19 s off, 25% 5 s on/15 s off, 50% 10 s on 10 s off 75% 15 s on 5 s off 100% on). Increasing duty cycle increases repression up to a maximum of 1.5-fold. Error bars represent 95% confidence intervals on the average of the median fluorescence from n = 3 biological replicates. (b) Duty cycle increases the population of low expressing cells while leaving a significant fraction of the population distributed through the wild-type (dark) expression levels. Dashed lines represent the first and third quartile for cells carrying dCas9-mCherry-LINuS/sgTEF1 in the dark. (c) Plotting the subpopulation ratio (NL/NH) shows that increasing light dosage increases the ratio of low expressors to high expressors in the population (up to 6-fold for dCas9-mCherry-LINuS-Mxi1).
Modulation of Light Intensity Regulates Expression Level Through the dCas9-mCherry-LINuS and dCas9-mCherry-LINuS-Mxi1 Repressors
We also wanted to understand the dynamic range achievable by modulating light intensity. We included the dCas9-mCherry-LINuS-Mxi1 strains to determine how the chromatin remodeler affects our ability to repress gene expression. Cells containing dCas9-mCherry-LINuS or dCas9-mCherry-LINuS-Mxi1 and the sgTEF1 guide (as well as guideless controls) were grown for 13 h at the indicated light intensities. No change in expression was evident in no-guide controls grown at different light intensities (Supplemental Fig. 8). Maximal repression for the dCas9-mCherry-LINuS (1.7-fold) and the dCas9-mCherry-LINuS-Mxi1 (2-fold) strains occurred at 100 µW/cm2 (Figs. 8a and 8b). We determined that further illumination at 200 µW/cm2 and 300 µW/cm2 did not increase repression (data not shown). Plotting the subpopulation ratio (NL/NH) shows that dCas9-LINuS-Mxi1 allows us to change the ratio of low to high expressors by 10-fold, despite a mere 2-fold change in median expression level (Fig. 8c).
Figure 8.

Light intensity increases repression and expression variability in strains carrying the dCas9-mCherry-LINuS and dCas9-mCherry-LINuS-Mxi1 repressors. (a) Strains carrying dCas9-mCherry-LINuS or dCas9-mCherry-LINuS-Mxi1 and the sgTEF1 guide RNA were exposed to increasing light intensities. Increasing light intensity increases repression in both the dCas9-mCherry-LINuS repressor and the dCas9-mCherry-LINuS-Mxi repressor, consistent with previous results. Error bars represent 95% confidence intervals on the average of the median fluorescence from n = 3 biological replicates. (b) Light intensity increases the population of low expressing cells while leaving a significant fraction of the population distributed through the wild-type (dark) expression levels. Dashed lines represent the first and third quartile for cells carrying dCas9-mCherry-LINuS/sgTEF1 in the dark. The most variable population is dCas9-mCherry-LINuS-Mxi1 at 100 µW/cm2. This population has significant overlap with both the dark population as well as the constitutively repressed (dCas9/sgTEF1) population. Controls (dCas9 +sgTEF1, dark grey) and dCas9-Mxi1 +sgTEF1, light grey) are shown for comparison. (c) Plotting the subpopulation ratio (NL/NH) shows that increasing light intensity increases the ratio of low expressors to high expressors in the population (up to 10-fold for dCas9-mCherry-LINuS-Mxi1). The controls (dCas9, dCasi-Mx1) change the subpopulation ratio (NL/NR) 450- and 1500-fold respectively and are therefore not shown on this plot.
Incorporation of the Light-Inducible Repressors into a Yeast Optogenetic Toolkit
The utility of our tool depends on the ability to rapidly integrate both the desired repressor (dCas9 variants) and an appropriate guide RNA targeting the gene of interest into the desired yeast strain. In order to make this possible, we implemented the unique aspects of our toolkit as “parts” in an existing yeast optogenetic toolkit format (Fig. 9).1,33 In the toolkit format, each part is characterized as a type (e.g. promoter types, coding sequence types, terminator types) based on function and location in the complete gene expression cassette (Fig. 9). The yeast toolkit33 contains a part that can be modified to integrate the appropriate guide RNA with complementarity to the desired genomic region (234 Combination Parts). Parts can be assembled into cassettes, fully assembled transcriptional units which express a single component, e.g. dCas9-mRuby2-LINuS, and then further assembled into multigene plasmids which contain both the dCas9-based repressor and the required guide RNA. The implementation of the essential elements (dCas9, LINuS, Mxi1, LINuS-Mxi1, see Supplemental Table S5) as parts allows us to build multigene plasmids containing the light-controlled repressor and appropriate guide in as little as 2 days using a Golden Gate cloning scheme.
Figure 9.

We generated dCas9, LINuS, and Mxi1 as either coding sequence or terminator parts, with and without stop codons and constitutive NLSs to allow for versatile repressors to be constructed using the toolkit. Part plasmids contain unique upstream and downstream BsaI-generated overhangs to assemble into the appropriate position in “Cassette” plasmids. Cassette plasmids are fully functional transcriptional units that are further assembled into multigene plasmids using BsmBI assembly and appropriate Assembly Connectors. This figure utilizes the color scheme and organization from Lee et al.33 and An-Adirrekun et al.1 to illustrate how the new optogenetic components integrate with the existing yeast toolkit. (P, Promoter; T, Terminator; S, Scar)
Using the toolkit, we reconstructed five repressors containing varying configurations of dCas9, LINuS, mRuby2, and Mxi1 (Fig. 10a) based on our initial results with the LINuS and Mxi1 configurations. We found that dCas9-mRuby2 was a more effective constitutive repressor than dCas9 alone (Fig. 10a, Supplemental Fig. 9), perhaps due to increased steric hindrance. All constructs containing LINuS showed light-induced repression at 100 µW/cm2 similar to that seen for our original mCherry constructs ranging from 1.2 (dCas9-mRuby2-LINuS) to 1.3-fold (dCas9-mRuby2-LINuS-Mxi1) (data not shown). We found that the repressors showed varying levels of basal (dark) repression ranging from 2- to 20-fold (Fig. 10a). We took advantage of this basal repression to in silico generate a population of yeast cells with expression varying over a 100-fold range (Figs. 10a and 10b) by sampling from each of the repressor populations.
Figure 10.

(a) Basal (dark) repression of Tef1-GFP varies in the different repressor configurations. Each violin plot represents median, interquartile range, and 95% confidence interval on a representative population of cells (three biological replicates). (b) By randomly combining cells from each population, we can in silico generate a population of cells with expression varying over a 100-fold range, from the highest values to the most repressed (dCas9-Mxi1-mRuby2) values (“Combined”).
Generation of Yeast Strains with Varying Sensitivity to Fluconazole
Though we did not set out to make repressors with varying levels of basal (dark) activity, this finding presented us with the opportunity to generate yeast with varying levels of (dark) repression for important drug resistance genes. As a proof-of-principle, we generated multigene cassettes containing the five repressors shown in Fig. 10a and a guide RNA targeting the gene ERG11.58 The ERG11 gene encodes lanosterol 14-alpha-demethylase, the enzyme which catalyzes C-14 demethylation of lanosterol to form 4,4″-dimethyl cholesta 8,14,24-triene-3-beta-ol in the ergosterol biosynthesis pathway in Saccharomyces cerevisiae.27 Mutants in the ERG11 gene are known to be sensitive to fluconazole, an antifungal medication that targets ergosterol synthesis and is widely used to treat a number of fungal infections.30 A spot test demonstrated that these strains, each containing a different repressor, exhibited a > 10-fold range of sensitivity to fluconazole in line with the expression differences in Tef1-GFP from the TEF1 promoter seen in Fig. 10a (Fig. 11). Strains without a dCas9 repressor construct (Fig. 11) or containing dCas9 repressors without a guide RNA showed no increased sensitivity to fluconazole (Supplemental Fig. 10a). The various repressors with the ERG11 guide showed no difference in growth on plates lacking fluconazole (Supplemental Fig. 10b). We also tested repression of ERG25, C-4 methyl sterol oxidase, another enzyme involved in ergosterol biosynthesis. Repression of ERG25 has been shown to cause increased resistance to fluconazole,58 but we could not detect this effect in our assays (data not shown).
Figure 11.
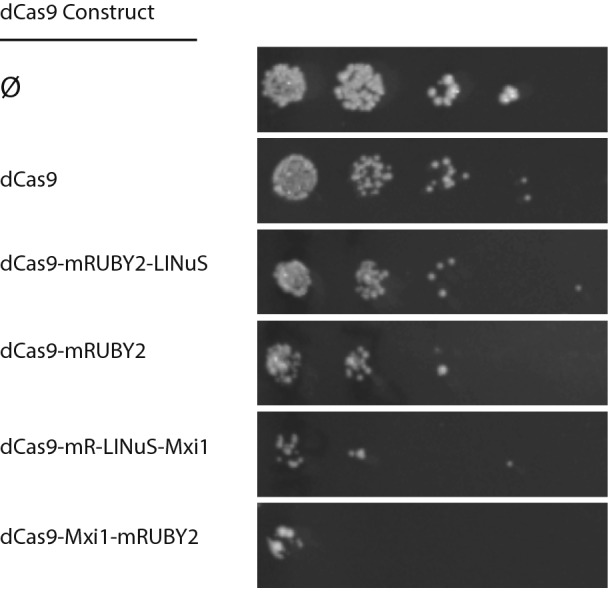
Repressors in Fig. 10 were assembled into multigene cassettes containing a guide RNA for the ERG11 gene. Repression of ERG11 confers sensitivity to the antifungal drug fluconazole. Dilutions (1:1, 1:10, 1:100, 1:1000 left to right) of cells were spotted onto plates containing 32 mg/mL fluconazole and grown in ambient light. The strain without a repressor shows no additional fluconazole sensitivity relative to wild-type cells. Sensitivity in strains carrying the dCas9 repressors agrees qualitatively with the repression of Tef1-GFP seen in Fig. 10a.
Discussion
In this study, we demonstrated that light-controlled nuclear localization of dCas9 achieved by fusing it to the light-inducible nuclear localization tool LINuS45 can be used to manipulate gene expression in populations of Saccharomyces cerevisiae yeast cells. Moreover, we showed that the construct bearing an additional repressor domain (Mxi1) more strongly repressed gene expression. We selected the model protein Tef1 (translational elongation factor EF-1) because it has commonly been utilized to characterize the dCas9 and dCas9-Mxi1 repressors in S. cerevisiae. However, our choice of dCas9 as the DNA binding element means that specificity of the repressor can be changed by modifying the co-expressed guide RNA. To make creation of cassettes containing both the repressor of choice and an appropriate guide RNA (sgRNA) a rapid and simple process, we have integrated the essential elements of our repressors into “parts” that can be used with an existing yeast toolkit34 to generate episomal or integrating constructs using a Golden Gate cloning scheme. Using this strategy we can assemble and verify a repressor to target a gene of interest in less than 2 weeks. We demonstrated this by targeting the ERG11 gene and demonstrating a range of drug sensitivity due to variable basal repression (discussed further below).
The light-induced repression achieved by our repressors over the timescale we have studied is relatively modest (up to 2-fold). We hypothesize that basal repression, as well as time for dilution of the existing Tef1-GFP protein, leads to this low level of light-inducible repression. This suggests future avenues for improving the light inducibility of our repression including utilizing stronger nuclear localization signals, tethering of dCas9 in the cytoplasm to reduce basal repression, tuning expression levels of the dCas9 repressors, and balancing LINuS with a different nuclear export signal. Despite being modest, the light-inducible repression achieved is still enough to change the relative proportions of high- and low-expressors in populations of yeast up to 6-fold (dCas9-mCherry-LINuS) or 10-fold (dCas9-mCherry-LINuS-Mxi1).
We discovered that our different repressor constructs, in addition to light-inducible repression, show a 20-fold range in median basal (dark) gene repression. Using a combination of these repressors, we demonstrated that we can generate populations of yeast that repress the expression of Tef1-GFP over a 100-fold range (Fig. 10). Yeast promoters used in metabolic engineering naturally span a 1000-fold expression range.33 However, generation of expression heterogeneity by transforming a library of repressors is attractive as it requires modification of only one genetic locus (with a dCas9 repressor and guide RNA) and does not require modifying the promoter of the gene of interest. We are particularly excited to use this basal repression to better understand the emergence of drug sensitivity and resistance, particularly in fungal populations. Fungal and human cells share very similar cellular structures and machineries, making it difficult to find drugs that aggressively target the fungal cell without significant toxicity in humans. Only four major classes (azoles, echinocandins, polyenes, and nucleoside analogs) of fungal drugs exist, making fungal drug resistance an emerging health concern. Gene expression variability is known to play a role in promoting yeasts’ ability to evolve and adapt to drug treatment.3,42 We demonstrated using our repressors that we could generate yeast with a > 10-fold range of fluconazole resistance (Fig. 11). The simplicity of our scheme should allow it to be adopted in other organisms, particularly pathogenic fungi, where promoter engineering to study the importance of gene expression on drug resistance and sensitivity is much more difficult than in S. cerevisaie.
Electronic supplementary material
Below is the link to the electronic supplementary material.
Acknowledgments
The authors would like to acknowledge discussion and helpful comments from the members of the McClean lab throughout the project. We acknowledge Taylor Scott for help analyzing the growth curve data, Kieran Sweeney for supplying MATLAB code to analyze nuclear localization, and Jidapas (My) An-Adirekkun for assistance with figures. This work was supported by the American Cancer Society [IRG-15-213-51] to M.N.M and by the BMBF 031L0079 grant to B.D.V. Flow cytometry was enabled by the University of Wisconsin Carbone Cancer Center Support Grant P30 CA014520. Megan Nicole McClean, Ph.D., holds a Career Award at the Scientific Interface from the Burroughs Wellcome Fund.
Conflict of interest
Authors Stephanie H. Geller, Enoch B. Antwi, Barbara Di Ventura and Megan N. McClean declare that they have no conflicts of interest.
Ethical Standards
No human or animal studies were carried out by the authors for this article.
Footnotes
Megan N. McClean is an Assistant Professor in the Department of Biomedical Engineering at the University of Wisconsin-Madison. She received her B.A. from the University of California-Berkeley and her Ph.D. from Harvard University, both in Applied Mathematics. During her thesis work with Dr. Sharad Ramanathan, she used computational modeling in combination with single-cell microscopy to understand the mechanisms of crosstalk prevention and signaling specificity in Saccharomyces cerevisiae MAP kinase pathways. Prior to joining UW-Madison, Dr. McClean was a Lewis-Sigler Fellow at Princeton University where she utilized optogenetics, control theory, and synthetic biology to develop tools for controlling biological circuits. At UW-Madison, Dr. McClean’s research group employs systems and synthetic biology approaches to understand biological signal processing in fungi, including human fungal pathogens, with implications for improving treatment strategies. Dr. McClean holds a Career Award at the Scientific Interface from the Burroughs Wellcome Fund and a Maximizing Investigators’ Research Award from the National Institute of General Medical Sciences.
This article is part of the CMBE 2019 Young Innovators special issue.
Publisher's Note
Springer Nature remains neutral with regard to jurisdictional claims in published maps and institutional affiliations.
References
- 1.Anadirekkun J, Stewart C, Geller S, Patel M, Melendez J, Oakes B, Noyes M, McClean M. A yeast optogenetic toolkit (yOTK) for gene expression control in Saccharomyces cerevisiae. BioRxiv. 2019 doi: 10.1101/663393. [DOI] [PMC free article] [PubMed] [Google Scholar]
- 2.Aubrey B, Kelly G, Brennan KAM, O’Connor L, Milla L, Wilcox S, Tai L, Strasser A, Herold M. An inducible lentiviral guide RNA platform enables the identification of tumor-essential genes and tumor-promoting mutations in vivo. Cell Reports. 2015;10:1422–1432. doi: 10.1016/j.celrep.2015.02.002. [DOI] [PubMed] [Google Scholar]
- 3.Bódi Z, Farkas Z, Nevozhay D, Kalapis D, Lázár V, Csörgö B, Nyerges Á, Szamecz B, Fekete G, Papp B, Araújo H, Oliveira J, Moura G, Santos M, Székely T, Jr, Balázsi G, Pál C. Phenotypic heterogeneity promotes adaptive evolution. PLOS Biology. 2017;15(5):e2000644. doi: 10.1371/journal.pbio.2000644. [DOI] [PMC free article] [PubMed] [Google Scholar]
- 4.Brachmann C, Davies A, Cost G, Caputo E, Li J, Heiter P, Boeke J. Designer deletion strains derived from Saccharomyces cerevisiae S288C: a useful set of strains and plasmids for PCR-mediated gene disruption and other applications. Yeast. 1998;14:115–132. doi: 10.1002/(SICI)1097-0061(19980130)14:2<115::AID-YEA204>3.0.CO;2-2. [DOI] [PubMed] [Google Scholar]
- 5.Branch M, Coleman T, Li Y. A Subspace, Interior, and Conjugate Gradient Method for Large-Scale Bound-Constrained Minimization Problems. SIAM Journal of Scientific Computing. 1999;21(1):1–23. doi: 10.1137/S1064827595289108. [DOI] [Google Scholar]
- 6.Burke D, Amberg DC, Stearns T. Methods in Yeast Genetics: A Cold Spring Harbor Laboratory Course Manual. Woodbury, NY: Cold Spring Harbor Laboratory Press; 2000. [Google Scholar]
- 7.Davis K, Pattanayak V, Thompson D, Zuris J, Liu D. Small molecule-triggered Cas9 protein with improved genome-editing specificity. Nature Chemical Biology. 2015;11:316–318. doi: 10.1038/nchembio.1793. [DOI] [PMC free article] [PubMed] [Google Scholar]
- 8.Deaner M, Mejia J, Alper HS. Enabling graded and large-scale multiplex of desired genes using a dual-mode dCas9 activator in Saccharomyces cerevisiae. ACS Synthetic Biology. 2017;6:1931–1943. doi: 10.1021/acssynbio.7b00163. [DOI] [PubMed] [Google Scholar]
- 9.Deltcheva E, Chylinski K, Sharma CM, Gonzales K, Chao Y, Pirzada ZA, Eckert MR, Vogel J, Charpentier E. CRISPR RNA maturation by trans-encoded small RNA and host factor RNase III. Nature. 2011;471(7340):602–607. doi: 10.1038/nature09886. [DOI] [PMC free article] [PubMed] [Google Scholar]
- 10.Dexter J, Xu P, Gunawardena J, McClean M. Robust network structure of the Sln1-Ypd1-Ssk1 three-component phospho-relay prevents unintended activation of the HOG MAPK pathway in Saccharomyces cerevisiae. BMC Systems Biology. 2015;9(1):17. doi: 10.1186/s12918-015-0158-y. [DOI] [PMC free article] [PubMed] [Google Scholar]
- 11.Dow L, Fisher J, O’Rourke K, Muley A, Kastenhuber E, Livshits G, Tschaharganeh D, Socci N, Lowe S. Inducible in vivo genome editing with CRISPR-Cas9. Nature Biotechnology. 2015;33:390–394. doi: 10.1038/nbt.3155. [DOI] [PMC free article] [PubMed] [Google Scholar]
- 12.Farzadfard F, Perli SD, Lu TK. Tunable and multifunctional eukaryotic transcription factors based on CRISPR/Cas. ACS Synthetic Biology. 2013;2(10):604–613. doi: 10.1021/sb400081r. [DOI] [PMC free article] [PubMed] [Google Scholar]
- 13.Fegan A, White B, Carlson J, Wagner C. Chemically controlled protein assembly: Techniques and applications. Chemical Reviews. 2010;110:3315–3336. doi: 10.1021/cr8002888. [DOI] [PubMed] [Google Scholar]
- 14.Gander M, Vrana J, Voje W, Carothers J, Klavins E. Digital logic circuits in yeast with CRISPR-dCas9 NOR gates. Nature Communications. 2017;8:15459. doi: 10.1038/ncomms15459. [DOI] [PMC free article] [PubMed] [Google Scholar]
- 15.Gangopadhyay S, Cox K, Manna D, Lim D, Maji B, Zhou Q, Coudhary A. Precision Control of CRISPR-Cas9 Using Small Molecules and Light. Biochemistry. 2019;58:234–244. doi: 10.1021/acs.biochem.8b01202. [DOI] [PMC free article] [PubMed] [Google Scholar]
- 16.Gerhardt KP, Olson EJ, Castillo-Hair SM, Hartsough LA, Landry BP, Ekness F, Yokoo R, Gomez EJ, Ramakrishnan P, Suh J. An open-hardware platform for optogenetics and photobiology. Scientific Reports. 2016;6:35363. doi: 10.1038/srep35363. [DOI] [PMC free article] [PubMed] [Google Scholar]
- 17.Gietz RD, Schiestl RH. High-efficiency yeast transformation using the LiAc/SS carrier DNA/PEG method. Nature Protocols. 2007;2(1):31–34. doi: 10.1038/nprot.2007.13. [DOI] [PubMed] [Google Scholar]
- 18.Gilbert LA, Larson MH, Morsut L, Liu Z, Brar GA, Torres SE, Stern-Ginossar N, Brandman O, Whitehead EH, Doudna JA, Lim WA, Weissman JS. CRISPR-mediated modular RNA-guided regulation of transcription in eukaryotes. Cell. 2013;154(2):442–451. doi: 10.1016/j.cell.2013.06.044. [DOI] [PMC free article] [PubMed] [Google Scholar]
- 19.Gonzalez F, Zhu Z, Shi Z, Lelli K, Verma N, Li Q, Huangfu D. An iCRISPR platform for rapid, multiplexable, and inducible genome editing in human pluripotent stem cells. Cell Stem Cell. 2014;15:215–226. doi: 10.1016/j.stem.2014.05.018. [DOI] [PMC free article] [PubMed] [Google Scholar]
- 20.Hemphill J, Borchardt E, Brown K, Asokan A, Deiters A. Optical control of CRISPR/Cas9 gene editing. Journal of the American Chemical Society. 2015;137:5642–5645. doi: 10.1021/ja512664v. [DOI] [PMC free article] [PubMed] [Google Scholar]
- 21.Hersen P, McClean M, Mahadevan L, Ramanathan S. Signal processing by the HOG MAP kinase pathway. Proceedings of the National Academy of Sciences. 2008;105(20):7165–7170. doi: 10.1073/pnas.0710770105. [DOI] [PMC free article] [PubMed] [Google Scholar]
- 22.Hickman MJ, Winston F. Heme levels switch the function of Hap1 of Saccharomyces cerevisiae between transcriptional activator and transcriptional repressor. Molecular and Cellular Biology. 2007;27(21):7414–7424. doi: 10.1128/MCB.00887-07. [DOI] [PMC free article] [PubMed] [Google Scholar]
- 23.Hsu P, Lander E, Zhang F. Development and applications of CRISPR-Cas9 for genome engineering. Cell. 2014;157:1262–1278. doi: 10.1016/j.cell.2014.05.010. [DOI] [PMC free article] [PubMed] [Google Scholar]
- 24.Jensen M. Design principles for nuclease-deficient CRISPR-based transcriptional regulators. FEMS Yeast Research. 2018 doi: 10.1093/femsyr/foy039. [DOI] [PMC free article] [PubMed] [Google Scholar]
- 25.Jinek M, Chylinski K, Fonfara I, Hauer M, Doudna JA, Charpentier E. A programmable dual-RNA–guided DNA endonuclease in adaptive bacterial immunity. Science. 2012;337(6096):816–821. doi: 10.1126/science.1225829. [DOI] [PMC free article] [PubMed] [Google Scholar]
- 26.E. Jones, E. Oliphant, and P. Peterson. SciPy: Open Source Scientific Tools for Python. 2001. http://www.scipy.org/. Accessed 26 Feb 2019.
- 27.Karst F, Lacrout F. Ertosterol biosynthesis in Saccharomyces cerevisiae: mutants deficient in the early steps of the pathway. Molecular Genetics and Genomics. 1977;154(3):269–277. doi: 10.1007/BF00571282. [DOI] [PubMed] [Google Scholar]
- 28.Kiani S, Beal J, Ebrahimkhani M, Huh J, Hall R, Xie Z, Li Y, Weiss R. CRISPR transcriptional represion devices and layered circuits in mammalian cells. Nature Methods. 2014;11:723–726. doi: 10.1038/nmeth.2969. [DOI] [PMC free article] [PubMed] [Google Scholar]
- 29.Kleinjan D, Wardrope C, Nga Sou S, Rosser S. Drug-tunable multidimensional synthetic gene control using inducible degron-tagged dCas9 effectors. Nature Communications. 2017;8:1191. doi: 10.1038/s41467-017-01222-y. [DOI] [PMC free article] [PubMed] [Google Scholar]
- 30.Kontoyiannis D, Sagar N, Hirschi K. Overexpression of Erg11p by the regulatable GAL1 promoter confers fluconazole resistance in Saccharomyces cerevisiae. Antimicrobial Agents and Chemotherapy. 1999;43(11):2798–2800. doi: 10.1128/AAC.43.11.2798. [DOI] [PMC free article] [PubMed] [Google Scholar]
- 31.Kundert K, Lucas J, Watters K, Fellmann C, Nh A, Heineike B, Fitzsimmons C, Oakes B, Qu J, Prasad N, Rosenberg O, Savage D, El-Samad H, Doudna J, Kortemme T. Controlling CRISPR-Cas9 with ligand-activated and ligand-deactivated sgRNAs. Nature Communications. 2019;10:2127. doi: 10.1038/s41467-019-09985-2. [DOI] [PMC free article] [PubMed] [Google Scholar]
- 32.Lawhorn I, Ferreira J, Wang C. Evaluation of sgRNA target sites for CRISPR-mediated repression of TP53. PloS ONE. 2014;9(11):e113232. doi: 10.1371/journal.pone.0113232. [DOI] [PMC free article] [PubMed] [Google Scholar]
- 33.Lee ME, Deloache W, Cervantes D, Dueber J. A highly characterized yeast toolkit for modular, multipart assembly. ACS Synthetic Biology. 2015;4(9):975–986. doi: 10.1021/sb500366v. [DOI] [PubMed] [Google Scholar]
- 34.Li S, Giardina D, Siegal M. Control of nongenetic heterogeneity in growth rate and stress tolerance of Saccharomyces cerevisiae by cyclic AMP-regulated transcription factors. PLoS Genetics. 2018;14(11):e1007744. doi: 10.1371/journal.pgen.1007744. [DOI] [PMC free article] [PubMed] [Google Scholar]
- 35.Lian J, HamediRad M, Hu S, Zhao H. Combinatorial metabolic engineering using an orthogonal tri-functional CRISPR system. Nature Communications. 2017;8:1688. doi: 10.1038/s41467-017-01695-x. [DOI] [PMC free article] [PubMed] [Google Scholar]
- 36.Liu K, Ramli M, Woo C, Wang Y, Zhao T, Zhang X, Yim G, Chong B, Gowher A, Chua M, Jung J, Lee J, Tan M. A chemical-inducible CRISPR–Cas9 system for rapid control of genome editing. Nature Chemical Biology. 2016;12:980–987. doi: 10.1038/nchembio.2179. [DOI] [PubMed] [Google Scholar]
- 37.Liu Y, Zhan Y, Chen Z, He A, Li J, Wu H, Liu L, Zhuang C, Lin J, Guo X, Zhang Q, Huang W, Cai Z. Directing cellular information flow via CRISPR signal conductors. Nature Methods. 2016;13:938–944. doi: 10.1038/nmeth.3994. [DOI] [PubMed] [Google Scholar]
- 38.Ma H, Kunes S, Schatz P, Botstein D. Plasmid construction by homologous recombination in yeast. Gene. 1987;58:201–216. doi: 10.1016/0378-1119(87)90376-3. [DOI] [PubMed] [Google Scholar]
- 39.Ma H, Tu L-C, Naseri A, Huisman M, Zhang S, Grunwald D, Pederson T. CRISPR-Cas9 nuclear dynamics and target recognition in living cells. Journal of Cell Biology. 2016;214(5):525–537. doi: 10.1083/jcb.201604115. [DOI] [PMC free article] [PubMed] [Google Scholar]
- 40.Melendez J, Patel M, Oakes BL, Xu P, Morton P, McClean MN. Real-time optogenetic control of intracellular protein concentration in microbial cell cultures. Integrative Biology. 2014;6(3):366–372. doi: 10.1039/c3ib40102b. [DOI] [PubMed] [Google Scholar]
- 41.Natsume T, Kanemaki M. Conditional degrons for controlling protein expression at the protein level. Annual Reviews of Genetics. 2017;51:83–102. doi: 10.1146/annurev-genet-120116-024656. [DOI] [PubMed] [Google Scholar]
- 42.Nevozhay D, Zal T, Balazsi G. Transferring a synthetic gene circuit from yeast to mammalian cells. Nature Communications. 2013;4:1451. doi: 10.1038/ncomms2471. [DOI] [PMC free article] [PubMed] [Google Scholar]
- 43.Nihongaki Y, Kawano F, Nakajima T, Sato M. Photoactivatable CRISPR-Cas9 for optogenetic genome editing. Nature Biotechnology. 2015;33:755–760. doi: 10.1038/nbt.3245. [DOI] [PubMed] [Google Scholar]
- 44.Nihongaki Y, Yamamoto S, Kawano F, Suzuki H, Sato M. CRISPR-Cas9 based photoactivatable transcription system. Chemical Biology. 2015;22:169–174. doi: 10.1016/j.chembiol.2014.12.011. [DOI] [PubMed] [Google Scholar]
- 45.Niopek D, Benzinger D, Roensch J, Draebing T, Wehler P, Eils R, DiVentura B. Engineering light-inducible nuclear localization signals for precise spatiotemporal control of protein dynamics in living cells. Nature Communications. 2014;5:4404. doi: 10.1038/ncomms5404. [DOI] [PMC free article] [PubMed] [Google Scholar]
- 46.Oakes B, Nadler D, Flamholz A, Christof F, Staahl B, Doudna J, Savage D. Profiling of engineering hotspots identifies an allosteric CRISPR-Cas9 switch. Nature Biotechnology. 2016;34:646–651. doi: 10.1038/nbt.3528. [DOI] [PMC free article] [PubMed] [Google Scholar]
- 47.Oldenburg K, Vo K, Michaelis S, Paddon C. Recombination-mediated PCR-directed plasmid construction in vivo in yeast. Nucleic Acids Research. 1997;25:451–452. doi: 10.1093/nar/25.2.451. [DOI] [PMC free article] [PubMed] [Google Scholar]
- 48.Pelet S, Rudolf F, Nadal-Ribelles M, de Nadal E, Posas F, Peter M. Transient activation of the HOG MAPK pathway regulates bimodal gene expression. Science. 2011;332(6030):732–735. doi: 10.1126/science.1198851. [DOI] [PubMed] [Google Scholar]
- 49.Polstein L, Gersbach C. A light-inducible CRISPR-Cas9 system for controlling endogenous gene activation. Nature Chemical Biology. 2015;11:198–200. doi: 10.1038/nchembio.1753. [DOI] [PMC free article] [PubMed] [Google Scholar]
- 50.Qi LS, Larson MH, Gilbert LA, Doudna JA, Weissman JS, Arkin AP, Lim WA. Repurposing CRISPR as an RNA-guided platform for sequence-specific control of gene expression. Cell. 2013;152(5):1173–1183. doi: 10.1016/j.cell.2013.02.022. [DOI] [PMC free article] [PubMed] [Google Scholar]
- 51.Rose JC, Huang PS, Camp ND, Ye J, Leidal AM. A computationally engineered RAS rheostat reveals RAS-ERK signaling dynamics. Nature Chemical Biology. 2017;13:119–126. doi: 10.1038/nchembio.2244. [DOI] [PMC free article] [PubMed] [Google Scholar]
- 52.Rose J, Stephany J, Valente W, Trevillian B, Dang H, Bielas J, Maly D, Fowler D. Rapidly inducible Cas9 and DSB-ddPCR to probe editing kinetics. Nature Methods. 2017;14:891–896. doi: 10.1038/nmeth.4368. [DOI] [PMC free article] [PubMed] [Google Scholar]
- 53.Schirmaier F, Philippsen P. Identification of two genes coding for the translation elongation factor EF-1 alpha of S. cerevisiae. EMBO Journal. 1984;3(13):3311–3315. doi: 10.1002/j.1460-2075.1984.tb02295.x. [DOI] [PMC free article] [PubMed] [Google Scholar]
- 54.Schreiber-Agus N, Chin L, Chen K, Torres R, Rao G, Guida P, Skoultchi AI, DePinho RA. An amino-terminal domain of Mxi1 mediates anti-Myc oncogenic activity and interacts with a homolog of the yeast transcriptional repressor SIN3. Cell. 1995;80(5):777–786. doi: 10.1016/0092-8674(95)90356-9. [DOI] [PubMed] [Google Scholar]
- 55.Senturk S, Shirole N, Nowak D, Corbo V, Pal D, Vaughan A, Tuveson D, Trotman L, Kinney J, Sordella R. Rapid and tunable method to temporally control gene editing based on conditional Cas9 stabilization. Nature Communications. 2017;8:14370. doi: 10.1038/ncomms14370. [DOI] [PMC free article] [PubMed] [Google Scholar]
- 56.Sheff M, Thorn K. Optimized cassettes for fluorescent protein tagging in Saccharomyces cerevisiae. Yeast. 2004;21:661–670. doi: 10.1002/yea.1130. [DOI] [PubMed] [Google Scholar]
- 57.Siegel A, Baird M, Davidson M, Day R. Strengths and Weaknesses of Recently Engineered Red Fluorescent Proteins Evaluated in Live Cells Using Fluorescence Correlation Spectroscopy. International Journal of Molecular Sciences. 2013;14:20340–20358. doi: 10.3390/ijms141020340. [DOI] [PMC free article] [PubMed] [Google Scholar]
- 58.Smith JD, Suresh S, Schlecht U, Wu M, Wagih O, Peltz G, Davis RW, Steinmetz LM, Parts L, Onge RPS. Quantitative CRISPR interference screens in yeast identify chemical-genetic interactions and new rules for guide RNA design. Genome Biology. 2016;17:45. doi: 10.1186/s13059-016-0900-9. [DOI] [PMC free article] [PubMed] [Google Scholar]
- 59.Strickland D, Yao X, Gawlak G, Rosen MK, Gardner KH, Sosnick TR. Rationally improving LOV domain–based photoswitches. Nature Methods. 2010;7(8):623–626. doi: 10.1038/nmeth.1473. [DOI] [PMC free article] [PubMed] [Google Scholar]
- 60.Sweeney K, Moreno Morales N, Burmeister Z, Nimunkar A, McClean M. Easy calibration of the light plate apparatus for optogenetic experiments. MethodsX. 2019;6:1480–1488. doi: 10.1016/j.mex.2019.06.008. [DOI] [PMC free article] [PubMed] [Google Scholar]
- 61.Tang W, Hu J, Liu D. Aptazyme-embedded guide rnas enable ligand-responsive genome editing and transcriptional activation. Nature Communications. 2017;8:15939. doi: 10.1038/ncomms15939. [DOI] [PMC free article] [PubMed] [Google Scholar]
- 62.Vanegas K, Lehka B, Mortensen U. SWITCH: a dynamic CRISPR tool for genome engineering and metabolic pathway control for cell factory construction in Saccharomyces cerevisiae. Microbial Cell Factories. 2017 doi: 10.1186/s12934-017-0632-x. [DOI] [PMC free article] [PubMed] [Google Scholar]
- 63.Winston F, Dollard C, Ricupero-Havasse R. Construction of a set of convenient Saccharomyces cerevisiae strains that are isogenic to S288C. Yeast. 1995;11:53–55. doi: 10.1002/yea.320110107. [DOI] [PubMed] [Google Scholar]
- 64.Zetsche B, Volz S, Zhang F. A split-Cas9 architecture for inducible genome editing and transcription modulation. Nature Biotechnology. 2015;33:139–142. doi: 10.1038/nbt.3149. [DOI] [PMC free article] [PubMed] [Google Scholar]
- 65.Zwietering M, Jongenburger I, Rombouts F, Van’t Riet K. Modeling the bacterial growth curve. Applied and Environmental Microbiology. 1990;56(6):1875–1881. doi: 10.1128/aem.56.6.1875-1881.1990. [DOI] [PMC free article] [PubMed] [Google Scholar]
Associated Data
This section collects any data citations, data availability statements, or supplementary materials included in this article.