

Abstract
Dual action agents containing a cysteine protease inhibitor and Rubased photosensitizer for photodynamic therapy (PDT) were designed, synthesized, and validated in 2D culture and 3D functional imaging assays of triple-negative human breast cancer (TNBC). These combination agents deliver and release Rubased PDT agents to tumor cells and cause cancer cell death upon irradiation with visible light, while at the same time inactivating cathespin B (CTSB), a cysteine protease strongly associated with invasive and metastatic behavior. In total five Rubased complexes were synthesized with the formula [Ru(bpy)2(l)](O2CCF3)2 (3), where bpy = 2,2′-bipyridine and 1 = a bipyridine-based epoxysuccinyl inhibitor; [Ru(tpy)(NN)(2)](PF6)2, where tpy = terpiridine, 2 = a pyridine-based epoxysuccinyl inhibitor and NN = 2,2′-bipyridine (4); 6,6′-dimethyl-2,2′-bipyridine (5); benzo[i]dipyrido[3,2-a:2′,3′-c]phenazine (6); and 3,6-dimethylbenzo[i]-dipyrido[3,2-a:2′,3′ -c]phenazine (7). Compound 3 contains a [Ru(bpy)3]2+ fluorophore and was designed to track the subcellular localization of the conjugates, whereas compounds 4–7 were designed to undergo either photoactivated ligand dissociation and/or singlet oxygen generation. Photochemical studies confirmed that complexes 5 and 7 undergo photoactivated ligand dissociation, whereas 6 and 7 generate singlet oxygen. Inhibitors 1–7 all potently and irreversibly inhibit CTSB. Compounds 4–7 were evaluated against MDA-MB-231 TNBC and MCF-10A breast epithelial cells in 2D and 3D culture for effects on proteolysis and cell viability under dark and light conditions. Collectively, these data reveal that 4–7 potently inhibit dye-quenched (DQ) collagen degradation, whereas only compound 7 causes efficient cell death under light conditions, consistent with its ability to release a Ru(II)-based photosensitizer and to also generate 1O2.
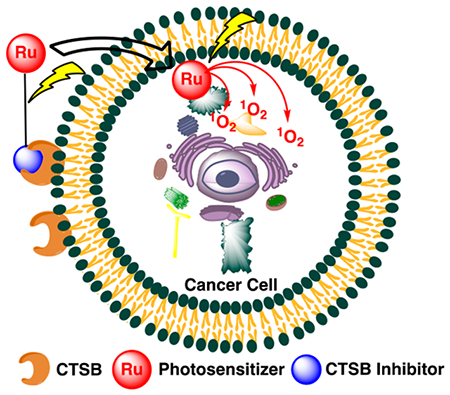
Graphical Abstract
INTRODUCTION
Cysteine cathepsins are a family of 11 human cysteine proteases that are highly expressed in a variety of cancers.1–3 Collectively, these enzymes contribute to tumor progression, growth, invasion, angiogenesis, and metastasis. In addition to being found intracellularly in lysosomes, cysteine cathepsins are secreted and bind to the surface of cancer cells.3 Activity-based probes (ABPs) that target cysteine cathepsins rapidly differentiate between normal and tumor tissue in vivo, allowing for visual imaging of cells left behind at the tumor margins after resection.4–11 These results show that surface-bound cathepsins can be targeted to achieve selective delivery of agents to the invasive edges of tumors.12 Prodrug activation strategies that take advantage of proteolytic activity of pericellular cathepsin B have also shown promise, confirming that these enzymes are active at the surface of tumors.13–15 Relative to this project, inhibitors of cysteine cathepsins have shown efficacy in preclinical models of cancer, including breast cancer.16–20 Given the crucial role, secretion, and membrane association of cysteine cathepsins in cancer, designing inhibitordrug conjugates that simultaneously block invasive behaviors and deliver drugs is an attractive approach. In addition to cancer cells, tumor-associated macrophages (TAMs) and stromal cells that express cathespin B (CTSB) and contribute to invasiveness, but are difficult to kill with conventional approaches, can be targeted with CTSB inhibitors as delivery vehicles.21 It is also important to note that TAMs play a critical role in breast cancer malignancy.22
Photodynamic therapy (PDT) is a clinically approved technique for the treatment of many cancers.23–33 PDT is commonly used after tumor surgical resection to kill cancer cells that invade outside the margins and are left behind within the tumor cavity. It is a two-step process that involves uptake of a photosensitizer by cancer cells, followed by drug activation using low energy light, resulting in the generation of reactive oxygen species (ROS) that cause oxidative damage and cell death. The precision of PDT is dependent upon selective uptake of the photosensitizer by cancer cells as well as the region where irradiation occurs. Due to suboptimal tumor targeting and uptake of current PDT drugs, considerable efforts have been made to enhance PDT drug efficacy using standard drug delivery strategies.34 However, in all of these approaches, the uptake of the photosensitizer into the cancer cell is a primary concern. In order for the PDT drug to do the most damage to cancer cells, it must be able to reach intracellular organelles, especially the mitochondria; generation of ROS at the cancer cell surface is not sufficient to achieve efficient cell killing.29 In addition, subcellular localization can vary as a function of the method of conjugation to the delivery agent. Importantly, none of the current delivery strategies for PDT drugs inhibit crucial activity in cancer. Instead these approaches rely on ligand–receptor interactions on the surface, which on their own show little anticancer activity.35–37 Recently, researchers have taken advantage of high extracellular concentrations of proteases, including cysteine cathepsins, at tumor sites to effect the proteolytic release of PDT agents and other drugs.14,15 While the strategy does provide an advantage in that multiple equivalents of drug can be released through the catalytic action of tumor-associated proteases, it does nothing to inactivate cathepsins and other proteases that are associated with invasiveness and metastatic behavior.
We chose a different strategy to achieve highly effective PDT; namely, the use of Ru(II)-based photosensitizers that are resistant to photobleaching, are water-soluble, cell permeable, and known to accumulate within the mitochondria of cancer cells due to their lipophilic cationic nature.38 Ruthenium complexes are a potent class of metallopharmaceuticals that have advanced to clinical trials (Figure 1).39–42 Due to their rich photochemistry and resistance to photobleaching,43 a common problem with current photosensitizers,44 ruthenium complexes are undergoing active development as a new class of PDT drugs.45–48 Most recently the PDT drug TLD-1433 advanced to Phase Ib clinical trials for the treatment of bladder cancer.49–51 These complexes show attractive properties, including high stability and cell permeability,52,53 low toxicity,54–57 and higher light to dark ratios for cell killing than current PDT drugs. The Turro group recently developed complexes that efficiently release pyridine as well as hybrid complexes that show dual reactivity with low energy light, with high quantum yields observed for photoactivated ligand dissociation and ROS generation.58,59 These ruthenium complexes provide a perfect lead for the development of highly efficacious agents with two mechanisms of action, where a ruthenium photosensitizer could be released, taken up by cells, and activated with light to generate ROS at a tumor site (Figure 2). However, in order for these complexes to reach their full potential, methods for tumor-specific delivery must be developed.
Figure 1.

Structures of ruthenium-based drugs.
Figure 2.

Dual therapeutic for tumor-specific delivery, cysteine cathepsin inhibition, and cell death through generation of ROS.
In this manuscript we describe the synthesis as well as the biochemical and biological characterization of a dual-action compound that potently inhibits CTSB and releases a Ru(II)-based photosensitizer upon irradiation with visible light. This complex includes a delivery vector that not only carries the Ru(II)-based photosensitizer to cancer and tumor-associated cells but also irreversibly inactivates CTSB. Our lead compound is a derivative of CA-074 and NS-134 (Figure 3), which are highly potent, selective, and irreversible inhibitors of CTSB.60,61 In addition to our lead dual-action compound, we synthesized four other Ru(II) conjugates that were used to test the role of the inhibitor, photoactivated release, and generation of 1O2 on compound efficacy, as well as the subcellular localization of the complexes. These complexes were evaluated in a 3D pathomimetic model of triple negative human breast cancer (TNBC) in order to probe the efficacy of our compounds in an environment that mimics the in vivo tumor microenvironment, including acidification of the extracellular space. Our results confirm that photoactivated ligand release and generation of 1O2 are vital in achieving efficient cell death.
Figure 3.

Epoxysuccinyl-based inhibitors of CTSB.
EXPERIMENTAL SECTION
General Considerations.
NMR spectra were recorded on a Varian FT-NMR Mercury-400 MHz spectrometer. Mass spectra were recorded on a time-of-flight Micromass LCT Premier XE spectrometer. IR spectra were recorded on a Nicolet IS5 FT-IR spectrophotometer (thin film). UV–Vis spectra were recorded on a Varian Cary 60 spectrophotometer. All reactions were performed under ambient atmosphere unless otherwise noted. Anaerobic reactions were performed by purging the reaction solutions with Ar or nitrogen.
Methods.
Stability Studies.
DMSO stock solutions of complexes 3–7 (10.0 μL, 40 mM) were added to individual wells on a clear microtiter plate containing 190 μL of DMSO in the dark. Plates were loaded into a Tecan Infinite M200 monochromator-based modular multifunction microplate reader preequilibrated at 25.0 °C, and absorbance spectra were recorded every 4 h for 24 h. Similarly DMSO stock solutions of complexes 3–7 (40 mM) were diluted in cell growth media [phenol red-free Dulbecco’s modified Eagle’s cell growth medium (DMEM) supplemented with 10% FBS, 10 mM HEPES, 100 U/mL of penicillin-streptomycin, 25 mM PIPES, and acidified to pH 6.8] pre-equilibrated at 37 °C to A ≈ 1 (<10% final concentration DMSO). Electronic absorption spectra were recorded every 4 h for 24 h at 37 °C (Figures S58–67), respectively.
Photochemistry.
Electronic absorption spectra were obtained using a Hewlett-Packard 8453 diode array spectrophotometer, and luminescence was measured using a Horiba Fluoromax-4 spectrometer in 1 × 1 cm quartz cuvettes. Luminescence decay traces were collected using an Edinburgh EPL-445 pulsed diode laser (λ = 444.4 nm, pulse width = 84.4 ps) focused on a sample at 90° to an Edinburgh M300 emission monochromator and Bentham DH-00-Te PMT detector. Sample irradiation was performed using a 150 W Xe arc lamp (USHIO) in a MilliArc lamp housing unit with an LPS-220 power supply and an LPS-221 igniter (PTI). The desired irradiation wavelengths were controlled by selecting the appropriate long-pass (CVI Melles Griot) or bandpass (Thorlabs) filters. In general, the samples were irradiated in water (<5% methanol) or acetonitrile in a quartz cuvette. For photolysis experiments, electronic absorption spectra were recorded at various time points of irradiation. The ligand exchange quantum yields (ΦLE) were determined by irradiating the samples in water or acetonitrile using a 500 nm band-pass filter together with a 475 nm long-pass filter. Electronic absorption spectra were recorded at early irradiation times (<10% conversion) during the quantum yield determination, and the rate of consumption of the reactant was determined from the slope of the line of a plot of the moles of reactant vs irradiation time. The photon flux of the lamp was determined using potassium ferrioxalate as the chemical actinometer.62 The quantum yield for ligand dissociation using 500 nm light was calculated as the rate of moles of reactant consumed divided by the photon flux and corrected for the mean fraction of light absorbed by the sample. The quantum yields for 1O2 production (ΦΔ) were measured using [Ru(bpy)3]2+ as a standard, with ΦΔ = 0.81 in CH3OH and 1,3-diphenylisobenzofuran (DPBF) as an 1O2 trap.63 DPBF is emissive in CH3OH, and the resulting product from the reaction of DPBF with 1O2 is nonemissive. The absorbance values of samples in methanol were matched at the irradiation wavelength (A = 0.01 at 460 nm) in a 1 × 1 cm quartz cuvette. The samples were irradiated in the sample compartment of the fluorimeter (λirr = 460 nm) in the presence of 1.0 μM DPBF, and the quenching of the DPBF emission λexc = 405 nm; λem = 479 nm) was monitored as a function of irradiation time. The quantum yield was determined by comparing the rate of DPBF emission quenching for the sample with that obtained for the [Ru(bpy)3]2+ standard. The emission quantum yield was measured using [Ru(bpy)3]2+ in nitrogen-sparged H2O as the reference (Φem = 0.042).64
Enzyme Inhibition.
Thermodynamic and kinetic parameters for inhibition of CTSB were determined as previously described.65 Briefly, hydrolysis of Z-Arg-Arg-AMC to form the fluorophore AMC was monitored over time in the presence of compounds 1–7 (0–10 nM). Solutions of activated CTSB (25 μL) were added via a multichannel pipet to individual wells containing Z-Arg-Arg-AMC, inhibitor, and buffer that were prepared in the dark. Plates were immediately loaded into a Tecan plate reader, and the formation of free AMC over time was determined using excitation (360 nm) and emission (430 nm) filters. The CTSB stock was diluted to 16 nM (4 nM final concentration) in buffer solution (400 mM sodium acetate, 4 mM EDTA, pH 5.5) containing 8 mM DTT and activated for 15 min at 37 °C. Inhibitors were prepared as <1% DMSO stock solutions in assay buffer (400 mM sodium acetate, 4 mM EDTA, 0.01% Triton-X 100, pH 5.5). The substrate Z-Arg-Arg-AMC in assay buffer (200 μM, 50 μL) was diluted to achieve a final concentration of 100 μM. Data were fit to a two-step irreversible enzyme inhibition model using Dynafit as previously described.65 Experiments were performed in triplicate: Ki, kinact and kinact/Ki values are averages of three runs, and errors are standard deviations.
2D Cell Culture and Cytotoxicity Assays.
MDA-MB-231, a well-studied human breast carcinoma line, and MCF-10A, a normal breast epithelial line, were purchased from American Type Culture Collection (ATCC; Manassas, VA, USA). MDA-MB-231 cells were cultured in DMEM supplemented with penicillin (10,000 U/mL), streptomycin (10 mg/mL), and 10% fetal bovine serum. MCF-10A cells were cultured in DMEM supplemented with 5% horse serum, EGF (20 ng/mL), hydrocortisone (0.5 mg/mL), insulin (10 μ/mL), penicillin (10,000 U/mL), and streptomycin (10 mg/mL). Cells were incubated at 37 °C and kept under 5% CO2 atmosphere. Cells were cultured in 10 cm2 cell-treated dishes from ThermoFisher Scientific. Cell media was replaced 48 h after incubation, and cells were removed from the plate and reseeded 24–48 h after changing of the media.
For viability experiments cells were seeded at 5000 cells/well on 96-well plates in 100 μL of the appropriate media. The plates were incubated for 16–18 h. After incubation, the media was aspirated from each well; then the control wells were replaced with 100 μL of fresh media, while the treatment wells were filled with 100 μL of media containing 4–7 (1–10 μM). After addition of the treatment media, plates for irradiation (Light) were transferred to the incubator, while the plates which would not undergo irradiation were covered in aluminum foil and then transferred to the incubator (Dark). After a 4 h incubation period the Light plates were removed and irradiated with an Ealing 250 W tungsten halogen lamp with an 8 A 15 V power supply for 20 min. The light beam was filtered through 10 cm of water, and the distance between the light source and the plate was situated so that the entire plate could be irradiated evenly. After irradiation, the plates were incubated for an additional hour and were then irradiated for an additional 25 min. The plates were then incubated for 72 h. After incubation, 10 μL of MTT reagent (5 mg/mL) was added to each well, and the plates were incubated at 37 °C for 2 h. The plates were then removed from the incubator, and the cell media was carefully aspirated off, as not to disturb the newly formed formazan crystals. DMSO (100 μL) was added to each well, and the plates were rocked for 20 min. Absorbance data were recorded at 570 nm using a plate reader.
3D Cell Culture.
MDA-MB-231 cells were grown and maintained in phenol red-free DMEM supplemented with 10% FBS, 10 mM HEPES, and 100 U/mL of penicillin–streptomycin, at pH 7.4. For experimental conditions, the media was altered to additionally contain 25 mM PIPES and acidified to pH 6.8. During all conditions, cells were grown in a 37 °C humidified incubator ventilated with 5% CO2.
DQ-Collagen IV 3D Live Cell Proteolysis Assay.
Cleavage of DQ–collagen IV substrate (Life Technologies, Carlsbad, CA, USA) by live MDA-MB-231 cells was assayed in real time and quantified based on published protocols66–68 with some modifications. Briefly, single cell suspensions of tumor cells were plated on top of coverslips coated with Cultrex (Trevigen, Gaithersburg, MD, USA) containing DQ-collagen IV (1:40) and overlaid with 2% Cultrex. Cells were treated with 4, 5, 6, 7, or vehicle (0.2% DMSO) 24 and 72 h after seeding. With treatment, cells were incubated under dark and light for 20 min at room temperature, incubated 60 min at 37 °C, exposed to dark or light conditions again for 25 min at room temperature, and then placed back in the incubator. The overlay was replaced with treatment at 72 h. At 96 h, proteolysis of DQ-collagen IV was imaged by capturing z-stacks through the depth of structures using a Zeiss LSM 780 confocal microscope with a 40× water immersion objective. The intensity of green fluorescence/tumor spheroid was quantified in each 3D reconstructed spheroid using Volocity Software (PerkinElmer, Waltham, MA, USA).
3D Cytotoxicity Assay.
The cytotoxicity of the compounds was assayed on live MDA-MB-231 cells using the Molecular Probes Live/Dead Viability/Cytotoxicity Kit (Invitrogen, Carlsbad, CA, USA). Briefly, single cell suspensions of tumor cells were plated on top of coverslips coated with Cultrex and overlaid with 2% Cultrex. Cells were treated with 4, 5, 6, 7, or vehicle (0.2% DMSO) at 24 and 72 h after seeding. With treatment, cells were kept under dark (no irradiation) and light (250 W, 395–750 nm) conditions for 20 min at room temperature, incubated 60 min at 37 °C, exposed to dark or light conditions again for 25 min at room temperature, and then placed back in the incubator. The Cultrex overlay was replaced, and treatments were replenished at 72 h. At 96 h, coverslips were stained with 2 μM calcein AM and 5 μM ethidium homodimer-1 (Live/Dead Viability/Cytotoxicity Kit) for 30 min at room temperature and then rinsed and immediately imaged by capturing z-stacks through the depth of structures using a Zeiss LSM 780 confocal microscope with a 10× water immersion objective. The live cells, stained green by the calcein AM, were recorded using excitation at 488 nm and emission at 507 nm. The dead cells, stained red by the ethidium homodimer-1, were recorded using excitation at 488 nm and emission at 730 nm. Care was taken so there was no overlap between emission from red and green channels. The sum of channel intensity was quantified using Volocity software, and percentage of live cells to total cells was calculated, indicative of compound toxicity.
Fluorescent Cathepsin B Imaging.
The ability of 3 to track the localization of CTSB in live MDA-MB-231 cells was examined by confocal microscopy. Briefly, single-cell suspensions of tumor cells were plated on top of coverslips coated with Cultrex and overlaid with 2% Cultrex. After 72 h of growth, cells were treated with 3 (5–10 μM) or vehicle (0.2% DMSO) for 30 min at 37 °C. During the final 3–5 min, 10 μM DRAQ5 DNA fluorescent probe was added (to label the nuclei). Cells were washed with PBS and imaged by capturing z-stacks through the depth of structures using a Zeiss LSM 780 confocal microscope with a 40× water immersion objective (Ex. 458 nm/Em. 610 nm). Detection wavelengths of 561–659 nm were used to determine the localization of CTSB. The intensity of fluorescence/tumor spheroid was quantified in each 3D reconstructed spheroid using Volocity Software.
RESULTS AND DISCUSSION
Compound Design.
Dual-action conjugates were designed based on known Ru(II) complexes with pyridine as the leaving ligand (Figure 4). Prior studies revealed that variation of bidentate ligands (NN) in complexes of the general formula [Ru(tpy)(NN)(py)]2+, where NN was equal to 2,2′-bipyridine (bpy), 6,6′-dimethyl-2,2′-bipyridine (Me2bpy), benzo[i]-dipyrido[3,2-a:2′,3′-c ]phenazine (dppn), or 3,6-dimethylbenzo[i]dipyrido[3,2-a:2′,3′-c]phenazine (Me2dppn), provided high levels of control over quantum efficiencies of monodentate pyridine photorelease and generation of 1O2.58,59 The complex [Ru(tpy)(bpy)(py)]2+ represents a control that neither photoreleases pyridine nor produces 1O2.58b The dppn ligand in [Ru(tpy)(dppn)(py)]2+ produces 1O2 with 98% efficiency due to the lowest energy dppn-centered 3ππ* excited state but does not undergo ligand dissociation.58a In contrast, incorporation of methyl groups that point toward the metal in Me2bpy and Me2dppn provides the necessary steric bulk to lower the energy of the dissociative 3MC state, promoting ligand release upon irradiation. Of particular interest was [Ru(tpy)(Me2dppn)(py)]2+, which is able to both photorelease pyridine and generate 1O2 in water. We surmised that the dual photoreactivity of [Ru(tpy)(Me2dppn)(py)]2+ could be especially useful in targeting cancer cells for PDT if methods for cell-specific delivery were developed. In particular, photorelease was postulated to provide an advantage for achieving cellular uptake and favorable subcellular localization of the Ru(II) photosensitizer.
Figure 4.

Dual active Ru(II) complexes of the general formula [Ru(tpy)(NN)(py)]2+ that show photorelease and 1O2 photosensitization.
CTSB was chosen as a target for cell-specific delivery because it is highly upregulated in a broad range of cancers (breast, melanoma, GBM, esophageal, pancreatic, colorectal, and prostate), trafficked to the cell surface, and secreted by cancer cells and TAMs.69 CTSB is associated with invasive and metastatic behavior and serves as an essential enzyme for activating various signaling pathways at tumor sites, including activation of matrix metalloproteases (MMPs) and urokinase plasmodium activators that cleave the extracellular matrix,1,70,71 as well as an adaptive response to chemotherapy.20 We chose to use compound 2, a derivative of the potent and selective CTSB inhibitor CA-074,72 as the inhibitor and delivery vector (Figure 3). Derivative 2 (Figure 5) was designed based on NS-134 (Figure 3),61 a CA-074 analogue that spans the entire active site cleft of CTSB and has shown promising results as a vector for in vivo delivery of liposomal nanoparticles to tumor and stromal cells.21 The structure of NS-134 was modified to include isoleucine (Ile) residues and a terminal propyl nicotinamide group for Ru(II) binding to afford 2. In addition, bipyridyl derivative 1 (Figure 5) was prepared to provide access to an emissive tris-chelated Ru(II) complex similar to [Ru(bpy)3]2+ for subcellular tracking. This compound was needed because none of the derivatives from 2 were expected to be luminescent.
Figure 5.

Structures of (A) epoxysuccinyl inhibitors 1 and 2 and (B) Ru(II) epoxysuccinyl conjugates 3–7.
A series of Ru(II) conjugates (4–7) with the general formula [Ru(tpy)(NN)(2)](PF6)2 were designed with bidentate ligands NN = bpy (4), Me2bpy (5), dppn (6), and Me2dppn (7), and their molecular structures are depicted in Figure 5. In addition, complex 3 was designed to contain a [Ru(bpy)3]2+ fluorophore to track the subcellular localization of the conjugates, whereas compounds 4–7 were designed to independently undergo each of the four possible combinations of photoactivated ligand dissociation and/or 1O2 generation as shown in Figure 4. Compound 7, containing the Me2dppn ligand, was the only complex expected to exhibit dual behavior, whereas 4–6 would serve as controls for evaluating the role that Ru(II) conjugation, ligand dissociation, and ROS formation had independently in controlling biological behavior and cytotoxicity. With each compound, additional control experiments would be performed in cells without irradiation, which was expected to neither release the Ru(II) fragment nor produce ROS.
Compound Synthesis.
The syntheses of inhibitors 1 and 2 were accomplished starting from commercially available 8 (Scheme 1). DCC-HOBT coupling of Z-1-Ile-OH (8) with H-Pro-Ot-Bu (9) gave dipeptide 10 in 98% yield. Compound 10 was subjected to hydrogenolysis using Pearlman’s catalyst to remove the Cbz protecting group, which was followed by EDC coupling with known diacid 11, obtained in four steps from d-tartatric acid,73 to give monoacid 12 in a moderate yield over two steps.
Scheme 1.

Synthesis of Carboxylic Acid 12
Synthesis of the pyridyl and bipyridyl linkers 17 and 18 began from known dipeptide 13 (Scheme 2).74 Dipeptide 13 was subjected to KOH saponification followed by EDC coupling with ethyl glycinate giving tripeptide 14 in a combined yield of 69% over two steps. Tripeptide 14 was saponified with KOH, and the resultant carboxylic acid was coupled with primary amines 1575 or 1676 using EDC, giving 17 and 18 in 52% and 54% yields over two steps, respectively. Compounds 17 and 18 were subjected to Boc deprotection using a 1:1 mixture of TFA:DCM to form TFA salts, which were combined with a p-nitrophenol ester derived from 12, giving 19 and 20 in moderate yields (Scheme 3).
Scheme 2.

Synthesis of Linkers 17 and 18
Scheme 3.

Synthesis of Pyridine-Based CTSB Inhibitors 19 and 20
The syntheses of [Ru(bpy)2(l)](O2CCF3)2 (3) and [Ru-(tpy)(NN)(l)](PF6)2 (4–7) are shown in Schemes 4A and 4B, respectively. Analogue 19 was treated with cis-[Ru-(bpy)2Cl2] with heating at 80 °C in ethanol giving [Ru-(bpy)2(1)]Cl2 as an intermediate which was then subjected to t-butyl ester deprotection using TFA:DCM (1:1) to obtain compound 3 as a mixture of Δ and Λ stereoisomers in 32% yield over the two steps. Counteranion exchange of chloride for trifluoroacetate occurred during this step through removal of volatile HCl gas. In order to synthesize ruthenium conjugate complexes 4–7, the respective [Ru(tpy)(NN)Cl]Cl77,78 complexes were converted into [Ru(tpy)(NN)OTf]OTf complexes by overnight heating in ethanol at 80 °C with AgOTf, followed by filtration over Celite to remove AgCl formed in the reaction. Treating respective [Ru(tpy)(NN)-OTf]OTf complexes with 1.1 equiv of inhibitor 2 in EtOH at 80 °C for 6 h, followed by concentration, resulted in inhibitor metalation, which upon chromatographic purification over neutral alumina and subsequent t-butyl ester deprotection using 1:1 TFA:DCM gave final complexes [Ru(tpy)(NN)-(2)](PF6)2 4–7 in 25% to 34% yield over three steps. Compounds 3–7 were characterized by using UV–Vis absorption, 1H NMR and IR spectroscopies, mass spectrometry, and elemental analysis.
Scheme 4.

Synthesis of (A) Δ,Λ-[Ru(bpy)2(1)](O2CCF3)2 (3) and (B) [Ru(tpy)(NN)(2)](PF6)2 Complexes, Where NN = bpy (4), Me2bpy (5), dppn (6), and Me2dppn (7)a
aSee Figure 4 for bidentate ligand (NN) structures.
Structural Characterization Data.
1H NMR spectroscopic analysis of Ru(II) conjugates 4–7 shows resonances corresponding to the Ru(II) complex and epoxysuccinyl inhibitor fragments of the conjugates. The 1H NMR spectrum of compound 7 in methanol-d4 shows an additional peak in the aromatic region at 7.30 ppm which corresponds to the 5-pyridyl C–H of the monodentate nicotinamide donor. The doublet at 7.93 ppm is assigned to the 4-pyridyl C–H based on its coupling constant. A resonance corresponding to the 2-pyridyl CH proton is merged with other peaks in the multiplet at ~8.25 ppm. Two singlets at 2.38 and 1.82 ppm, which integrate to three protons each, belong to the two methyl groups on the Me2dppn ligand that are in unique chemical environments, one above and one below the plane formed by the Ru(tpy) unit. Similar data were observed for compounds 3–6.
Electrospray mass spectra of conjugates 3 and 4 show major peaks at 610.7, along with expected isotopic distributions, which are consistent with [Ru(bpy)2(1)]2+ and [Ru(tpy)-(bpy)(2)]2+ dications derived from 3 and 4, respectively (Figures S41–S44). Similarly, spectra for complexes 5, 6, and 7 show major peaks at m/z values of 624.7, 698.7, and 712.7, respectively, which are consistent with dications [Ru(tpy)-(Me2bpy)(2)]2+, [Ru(tpy)(dppn)(2)]2+, and [Ru(tpy)-(Me2dppn)(2)]2+(Figures S45–S50).
Complexes 4–7 were evaluated for stability in DMSO at 25 °C and phenol red-free Dulbecco’s modified Eagle’s cell growth medium (DMEM) at 37 °C over the course of 24 h by electronic absorption spectroscopy (Figures S58–67). With the exception of 5, which showed spectral changes consistent with partial release of 2 at 37 °C in DMEM over the course of 24 h, all complexes were exceptionally stable in the dark, with no observable spectral changes during this time.
Electronic Absorption Spectroscopy and Photochemistry.
The electronic absorption spectra for ruthenium complexes 3–7 are shown in Figure 6. Complexes 3–7 exhibit maxima between ~450 and 490 nm in methanol, consistent with metal-to-ligand charge transfer (MLCT) bands. The maximum of 4 is observed at 461 nm (ε = 8800 M−1 cm−1), and a shoulder is visible at ~415 nm. The 1MLCT maximum of 5, at 469 nm, is bathochromically shifted relative to 4, consistent with the corresponding pyridine analogues previously reported and attributed to the distorted octahedral geometry of the former, thus destabilizing the HOMO.58 Complex 6 exhibits a 1MLCT maximum at 471 nm (ε = 13 800 M−1 cm−1) and two peaks at 385 and 405 nm associated with the known dppn-centered lππ* transitions.58 In a manner similar to the red-shift between complexes 4 and 5, the 1MLCT maximum of 7 is observed at 482 nm. This complex also possesses Me2dppn-centered bands at 380 and 402 nm as previously reported for [Ru(tpy)(Me2dppn)-(py)]2+.58
Figure 6.

Electronic absorption spectra of 3 (brown), 4 (blue), 5 (green), 6 (black), and 7 (red) in MeOH.
The irradiation of complexes 5 and 7 with visible light (λirr ≥ 475 nm) in H2O results in the release of 2, with the concomitant coordination of solvent to generate the corresponding aqua complex (Figure 7). Irradiation of 5 in CH3CN results in a blue shift of the 1MLCT transition from 469 to 453 nm (Figure S51A), whereas a red shift from 469 to 481 nm is observed in H2O, consistent with the formation of the corresponding [Ru(tpy)(Me2bpy)(L)]2+ (L = CH3CN, H2O) complex, as previously reported for related complexes.58,59,65 Similarly, the irradiation of N2-purged solutions of 7 results in a blue shift of the 1MLCT maximum from 482 to 464 nm in CH3CN and a modest red shift from 482 to 487 nm in H2O. The quantum yields of photoinduced ligand exchange with λirr = 500 nm, Φ500, were determined to be 0.15(1) and 0.11(1) for 5 and 7, respectively, in CH3CN under N2 (Table 1). In H2O, Φ500 values for 5 and 7 were measured to be 0.092(4) and 0.0070(6), respectively. The lower quantum yields observed in H2O are attributed to the lower solubility of 2 in this solvent, reducing the escape of 2 from the solvent cage in H2O relative to CH3CN, as previously observed for related systems.79 To confirm the release of 2 from 5 and 7, changes to the 1H NMR spectrum as a function of irradiation time were recorded in D2O (λirr ≥ 475 nm), which resulted in new resonances corresponding to free 2 with the concomitant appearance of resonances corresponding to [Ru(tpy)(Me2bpy)(D2O)]2+ and [Ru(tpy)(Me2dppn)-(D2O)]2+ (Figures S52–S57).80
Figure 7.

Changes to the electronic absorption spectra of 5 (A) and N2-purged 7 (B) in H2O as a function of irradiation time (λirr ≥ 475 nm) for 0–4 min and 0–11 min, respectively.
Table 1.
Quantum Yields for Ligand Exchange (Φ500) and 1O2 Production Singlet Oxygen (ΦΔ) by Ru(II) Compounds 3–7
| compound | Φ500a | Φ500b | ΦΔc | Φemc |
|---|---|---|---|---|
| 3 | -- | -- | -- | 0.0031(1) |
| 4 | <10−4 | <10−4 | -- | -- |
| 5 | 0.092(1) | 0.15(1) | -- | -- |
| 6 | <10−4 | <10−4 | 0.83(3) | -- |
| 7 | 0.0070(6) | 0.11(1) | 0.58(3) | -- |
In 2% CH3OH/H2O with λirr = 500 nm.
In CH3CN with λirr = 500 nm.
In CH3OH.
The presence of the dppn and Me2dppn ligands in 6 and 7, respectively, is known to afford a long-lived dppn-centered 33ππ* excited state in this class of complexes that is able to undergo energy transfer with ground-state 3O2 in solution.58,59 Therefore, in addition to the release of 2, complex 7 sensitizes 1O2 with ΦΔ = 0.58(3) with λirr = 460 nm. Complex 6, for which ligand photodissociation is not observed (ΦLE < 10−4), sensitizes 1O2 more efficiently, resulting in ΦΔ = 0.83(3) with λirr = 460 nm. The lower yield of 1O2 sensitization in 7 is attributed to competitive population of 3MC and 3ππ* states, as previously discussed in detail for the corresponding pyridine parent complexes, [Ru(tpy)(dppn)(py)]2+ and [Ru(tpy)-(Me2dppn)(py)]2+.58,59 Complex 3 is moderately emissive at room temperature with a maximum at 675 nm, luminescence lifetime, τem, of 69.1 ns (λexc = 444.4 nm), and emission quantum yield, Φem, of 0.0029(1) in H2O (λexc = 460 nm). In contrast to [Ru(bpy)3]2+, the short excited-state lifetime of 3 precludes its bimolecular sensitization of 1O2, which allows for the use of 3 as a nontoxic emissive probe.
Distribution Coefficients.
The cellular uptake and localization of ruthenium complexes rely significantly on their lipophilicity,81 exhibiting enhanced cellular uptake with an increase in the lipophilic character of the compounds. Also, the lipophilicity of compounds containing acidic or basic functional groups varies considerably with pH. The distribution measured between octanol and aqueous buffer at a particular pH is termed as the distribution coefficient.82 The distribution coefficient between octanol and buffer at pH = 7.00 preeminently mimics physiological conditions. Therefore, we evaluated the distribution coefficient (log D7.00) for complexes 3–7. As shown in Table 2, the log D7.00 values for 6 and 7 were measured to be −0.11 and −0.06, respectively, and are more lipophilic than 3–5, as expected from the presence of the hydrophobic dppn and Me2dppn ligands in the former. Contrasting data for [Ru(tpy)-(Me2dppn)(py)](PF6)2, with log D7.00 = 0.26, to conjugate 7 reveal that the CTSB inhibitor plays a significant role in reducing the overall hydrophobicity, driving the log D7.0 value for 7 to −0.06. The lower log D7.00 value of 7 relative to the py model complex [Ru(tpy)(Me2dppn)(py)]2+ is expected to favor the targeting of extracellular CTSB. In addition, these data underscore the importance of controlling the overall charge of the complex: dication [Ru(tpy)(Me2dppn)(py)]2+ is 1 order of magnitude less lipophilic than monocation [Ru(tpy)(Me2dppn)(Cl)]+ (Table 3), which is consistent with literature data.83 Importantly, we do not yet understand what form the photosensitizer takes after release from 7, i.e., what ligand traps the vacant coordination site on Ru(II) after photolysis. Given the high extracellular chloride concentration found in vitro and in vivo (100–140 mM), monocationic chloride derivatives such as [Ru(tpy)(Me2dppn)(Cl)]+ could be formed in the extracellular space that are taken up by cells. Indeed, treating [Ru(tpy)(bpy)(H2O)]2+ with 110 mM NaCl in H2O results in the formation of [Ru(tpy)(bpy)(Cl)]+ within ~1 h at 37.5 °C (data not shown), and recent data confirm that [Ru(tpy)(bpy)(Cl)]+ is relatively slow to aquate in aqueous media.84 Treating [Ru(tpy)(Me2bpy)(H2O)]2+ with 110 mM NaCl in H2O at 37.5 °C also results in conversion to the respective monocationic chloride complex, but with lower efficiency; the steric bulk afforded by the methyl groups on the bidentate ligand is most likely responsible for the observed shift in the equilibrium. Similarly, addition of [Ru(tpy)-(Me2dppn)(H2O)]2+ to an aqueous solution containing 110 mM NaCl results in the formation of [Ru(tpy)(Me2dppn)Cl]+, albeit in low yield (~10%). Taken together these data strongly suggest that our Ru(II) photosensitizers that undergo chloride exchange may accumulate in the mitochondria, which is favored for cations with log P values of 1–585 and has already been shown for similar Ru(II)-based photosensitizers.86
Table 2.
Distribution Coefficients of Complexes 3−7 between Octanol and 10 mM Sodium Phosphate Saline Buffer (PBS) Measured Using the “Shake-Flask” Method82
| compound | log D7.00a |
|---|---|
| 3 | −1.37 (0.16) |
| 4 | −1.69 (0.01) |
| 5 | −1.12 (0.19) |
| 6 | −0.11 (0.05) |
| 7 | −0.06 (0.02) |
| [Ru(tpy)(Me2dppn)(py)](PF6)2 | 0.26 (0.04) |
| [Ru(tpy)(Me2dppn)Cl]Cl | 1.27 (0.06) |
Concentrations of complexes ranged between 55 and 75 μM.
Table 3.
Kinetic and Thermodynamic Parameters for Inhibition of CTSBa
| compound | Ki (μM) × 10−3 | kinact (s−1) × 10−3 | kinact/Ki (M−1 s−1) × 103 |
|---|---|---|---|
| 1 | 6.8 ± 0.4 | 34.5 ± 2.1 | 5100 ± 600 |
| 2 | 8.5 ± 1.3 | 44.6 ± 9.7 | 5300 ± 1300 |
| 3 | 4.3 ± 0.8 | 23.7 ± 3.8 | 5600 ± 400 |
| 4 | 7.6 ± 0.7 | 38.0 ± 6.1 | 5000 ± 1300 |
| 5 | 8.8 ± 1.1 | 37.0 ± 5.6 | 4300 ± 800 |
| 6 | 7.4 ± 1.2 | 40.6 ± 12 | 5500 ± 1400 |
| 7 | 8.5 ± 1.4 | 51.0 ± 11 | 6300 ± 2100 |
Conditions: The CTSB stock was diluted to 16 nM (4 nM final concentration) in buffer solution (400 mM sodium acetate, 4 mM EDTA, pH 5.5) containing 8 mM DTT. Inhibitors were prepared as <1% DMSO stock solutions in assay buffer (400 mM sodium acetate, 4 mM EDTA, 0.01% Triton-X 100, pH 5.5) to achieve final concentrations ranging from 0.25 to 10 nM. The substrate Z-Arg-Arg-AMC in assay buffer (200 μM, 50 μL) was diluted to achieve a final concentration of 100 μM.
CTSB Inhibition.
Compounds 1—7 were examined for inhibition of purified CTSB. Inhibition was determined in the dark by progress curve analysis using hydrolysis of the fluorogenic substrate Z-Arg-Arg-AMC (Table 3). Data were fit to a two-step model for irreversible inhibition, which provides the equilibrium constant for the reversible association between inhibitor and CTSB (Ki) and the rate constant for irreversible inactivation (kinact), including covalent bond formation via epoxide opening. The quotient kinact/Ki represents the second-order rate constant for enzyme inactivation. Inhibitors 1–7 all potently and irreversibly inhibit CTSB at extremely low concentrations (0.25–10 nM), with kinact/Ki values ranging from 4.3 to 6.3 × 10⁶ M−1 s−1, which are among the most potent irreversible inhibitors of CTSB known to date.87–91 Taken together, these inhibition data confirm that a broad range of Ru(II) complexes are tolerated by CTSB.
Cell Studies.
After confirming that 4–7 potently inhibit purified CTSB compounds, these complexes were evaluated against MDA-MB-231 TNBC cells in 2D culture. Cells were treated with 4–7 (1–10 μM), incubated for 4 h, and then irradiated (light, λirr > 395 nm) using a two-stage irradiation sequence to allow for Ru(II) photodissociation (Stage 1, t = 0–20 min), a 60 min delay to allow uptake of the photosensitizer, and then irradiation for ROS generation (Stage 2, t = 80–105 min). Cells under dark conditions were treated in the same manner without irradiation. After 72 h, viability was determined using the MTT assay. Results indicated that no growth inhibitory effects were observed for compounds 4–7 at concentrations of 1 and 5 μM (data not shown). At concentrations of 10 ,μM, 7 was the only complex that reduced viability outside the range of error relative to the control cells treated with vehicle only (Figure 8). Furthermore, the Me2ddpn derivative 7 showed significantly enhanced cell killing relative to that observed in the dark, reducing viability to roughly 60% of the control level under light conditions vs ~90% in the dark. In order to gain insight into the selectivity of 7 for cancer vs noncancer cell lines, 7 was evaluated against the normal breast epithelial cell line MCF-10A under the same conditions as those used with the TNBC MDA-MB-231 line. Viability was determined after 72 h using the MTT assay, and results showed that 7 did not reduce viability in the normal breast epithelial line under light or dark conditions (Figure 8) below the level of control, confirming that selectivity between cancer vs noncancer cell lines can be obtained.
Figure 8.

Cell viability assay results for compounds 4–7 (10 μM) against MDA-MB-231 TNBC cells and compound 7 (10 μM) against MCF-10A breast epithelial cells. Cells were treated with 1% DMSO (control), or indicated compound and placed under dark conditions (dark), or irradiated with light (light, λirr > 395 nm, t = 0–20 then 80–105 min). Cell viability was determined by the MTT assay after 72 h and is reported relative to control with only vehicle added. Error bars represent the standard error of mean of triplicate wells, and data are representative of three independent experiments.
Next, compounds 4–7 were evaluated in a 3D pathomimetic model of TNBC. As opposed to assays using purified enzymes or 2D monolayer culture, where in vivo characteristics are not recapitulated, 3D culture experiments take into consideration interactions of cells with the extracellular matrix (ECM), cell polarity, and cell-to-cell contacts, thus providing a more accurate context in which to evaluate compound activity and protease inhibition.92,93 As a result, efficacy studies from 3D culture experiments correlate closer with in vivo results than 2D culture experiments.94 In addition to employing 3D reconstituted basement membrane overlay cultures with the MDA-MB-231 TNBC cells, we performed all experiments at an acidified extracellular medium at a pH of 6.8. Extracellular acidification is a critical property of invasive and metastatic tumors. At later stages, as cancer cells become more aggressive and shift their metabolism from oxidative phosphorylation (OXPHOS) to aerobic glycolysis, they produce more lactic acid, which in turn is secreted into the extracellular space and favors the proteolytic activity of cysteine proteases.12 This process is essential for cancer cells to invade outside the tumor margins. Importantly, previous studies confirmed that 3D culturing of cells at pH 6.8 increases the translocation of CTSB from lysosomes to the cell surface and extracellular milieu as compared with pH 7.4.12 CTSB was a major contributor to the enhanced proteolytic degradation of collagen IV in the pericellular space in these experiments.
The first goal with compounds 4–7 was to measure their ability to inhibit extracellular proteolysis and CTSB in 3D culture. A dye-quenched version of collagen IV (DQ-collagen IV) was used to mimic the ECM found in vivo. DQ-collagen IV is labeled with multiple equivalents of fluorescein and is quenched until proteolytically degraded. When the fluorophore–peptide fragments become separated, the dye is no longer quenched, and green fluorescence is observed. Our data confirm that all four compounds (4–7) potently inhibit DQ-collagen IV degradation vs DMSO control (P < 0.001 for 6–7) under both light and dark conditions. For light conditions, the same irradiation sequence was used as for the 2D experiments (λirr > 395 nm, Stage 1, t = 0–20 min, Stage 2, t = 80–105 min). Data representative of the group are shown for compounds 6 and 7 in Figures 9 and 10. Data for 5 and 6 are shown in Figures S11–S12. In our previously published examples of Ru(II)-caged inhibitors, high dark to light ratios were achieved because the Ru-bound inhibitors did not interact with the enzyme.56,65,95–97 This behavior was not expected for 4–7 since the inhibition is not affected by the coordination to the metal, such that similar levels of inhibition under light and dark conditions were predicted for these complexes. These data prove that the coordination of the inhibitors to the Ru(II) center does not strongly influence inhibition of CTSB in the 3D assay by our compounds, similar to results achieved with purified CTSB described above. Furthermore, the large-scale reduction in extracellular proteolysis observed with 4–7 strongly suggests that CTSB is the major contributor to proteolytic degradation of the ECM at pH 6.8, a key feature of invasive cancer cells, which agrees well with previously reported data.12
Figure 9.

Representative images of DQ-collagen IV proteolysis by MDA-MB-231 cells in the absence or presence of complexes 7 and 6. Cells were treated with DMSO (Control, A, D), 5 μM complex 7 (B, E), or 5 μM complex 6 (C, F) and treated under dark conditions (Dark, A–C) or irradiated with light (Light, λirr. > 395 nm, t = 0–20 then 80–105 min, D–F). Cells were imaged, and the z-stack was reconstructed to show DQ-collagen IV degradation (green): 1 grid unit = 21.34 μm.
Figure 10.

Quantification of DQIV proteolysis by MDA-MB-231 cells. Cells were treated with DMSO (Control) or 5 μM complex 6 or 5 μM complex 7 and placed under dark conditions (Dark) or irradiated with light (Light, λirr > 395 nm, t = 0–20 then 80–105 min). DQ-collagen IV degradation was quantified using Volocity software. Data are shown as fluorescence intensity upon treatment relative to control (no treatment) conditions. Results shown depict representative experiment with four individual spheroid reconstructions.
Following the confirmation that our compounds inhibit proteolysis, the cytotoxicity for 4–7 was measured in the 3D pathomimetic assay. Cells were seeded and then treated with 4–7 (5 μM) at 24 and 72 h. With treatment, cells were incubated under dark (Dark) and light (Light, λirr > 395 nm, t = 0–20 then 80–105 min) conditions. After 96 h viability was assessed using Calcein AM, which labels live cells (green), and ethidium homodimer-1 that labels dead cells (red) upon DNA intercalation. Strikingly, our data show that only compound 7, which combines photodissociation and 1O2 generation into one chemical entity, is able to reduce viability to <10% relative to vehicle control under light conditions (P < 0.001); in the dark, 7 is not toxic (Figure 7B–D). Compounds 4–6 all show high levels of cell viability under dark and light conditions that were within error of the 100% viability with vehicle control; representative imaging data for compounds 6 and 7 are shown in Figure 11; imaging data for compounds 4 and 5 are shown in Figure S10, and the quantification of cell death for compounds 4–7 is shown in Figure 12. Importantly, 7 under light conditions was significantly more toxic in the 3D experiment (Figure 12) than under 2D culture (Figure 8), which may be attributed to the greater translocation of the CTSB to the cell surface in 3D culture vs 2D. Taken together, these data prove that photoactivated ligand release and 1O2 generation are highly important in achieving efficient cell death. Contrasting 6 and 7, which both generate ROS, strongly suggests that release of the lipophilic Ru(II) photosensitizer to achieve favorable subcellular localization is a critical factor for achieving potent cell death.
Figure 11.

Representative cytotoxicity images of MDA-MB-231 cells. Cells were treated at 24 and 72 h with DMSO (Control, left; A, D), 5 μM complex 7 (middle; B, E), or 5 μM complex 6 (right; C, F) and placed under dark conditions (Dark, A–C) or irradiated with light (Light, λirr > 395 nm, t = 0–20 then 80–105 min, D–F). After 96 h, cells were stained with 2 μM Calcein AM and 5 μM ethidium homodimer-1 for 30 min and imaged. Green fluorescence indicates live cells, and red fluorescence indicates dead cells. Cell morphology is shown by DIC images (differential interference contrast). (G) For negative control (100% dead cells) cells were permeablized with 0.2% Triton-X in PBS for 30 min prior to staining; bar; 100 μm.
Figure 12.

Quantification of viability assay results for MDA-MB-231 cells in the absence or presence of 7 (A), 6 (B), 5 (C), and 4 (D). Cells were treated with DMSO (Control) or 5 μM of the indicated compound at 24 and 72 h, and viability was determined at 96 h using 5 μM Calcein AM and 5 μM ethidium homodimer-1 as described in Figure 11. Cells were imaged by capturing z-stacks through the depth of structures using a Zeiss LSM 780 confocal microscope. Calcein AM fluorescence intensity indicating live cells was quantified using Volocity Software (PerkinElmer, Waltham, MA, USA). Data were analyzed using GraphPad Prizm software and are shown as percent of live/total cells under dark (black) or light (green) conditions.
In order to gain insight into the subcellular localization of the Ru(II) conjugates, a live cell 3D imaging assay was carried out with the fluorogenic [Ru(bpy)3]2+ derivative 3. Cells were seeded and treated after 72 h with 3 (5–10 μM) or vehicle control, incubated for 30 min at 37 °C, and then the DRAQ5 DNA fluorescent probe was added to label the nuclei (Figure 13). These imaging experiments show that pericellular staining of CTSB occurs along the invasive edge of the cell groups, which is consistent with the known association of CTSB with the cell membrane of MDA-MB-231 cells. Because cells were washed after staining, secreted CTSB stained with 3 was likely washed away, similar to previous reports with ABPs.12
Figure 13.

Evaluation of Cathepsin B labeling in MDA-MB-231 spheroids. Cells were treated with DMSO (A, D), 5 μM complex 3 (B, E), and 10 μM complex 3 (C, F). Cells were imaged, and the z-stack was reconstructed to visualize complex 3-labeled CTSB (red); 1 grid unit = 21.34 μm.
This manuscript describes the combination of a photochemotherapy (PCT) agent and a PDT 1O2 photosensitizer into a single molecule, where light triggers ligand dissociation and generation of 1O2. An important feature of Ru(II) complexes is that they absorb strongly in the visible range into metal-to-ligand charge transfer (MLCT) states that undergo intersystem crossing with 100% yield to populate the corresponding 3MLCT state.98 Coordination of a ligand that possesses a ligand-centered 3ππ* state that falls below the 3MLCT results in excited states with long lifetimes, 20–50, μs, that efficiently produce 1O2.59 In addition, in complexes with a coordination environment distorted from ideal octahedral geometry, the metal-centered state(s) of antibonding character are lower in energy and can be populated from the 3MLCT state, resulting in ligand dissociation; this is the major mechanism exploited here for photosensitizer release. We have already shown that it is possible to both generate 1O2 and release a ligand upon irradiation.58 The presence of the Ru(II) center provides several advantages: low-energy absorption by the MLCT state not possible with the ligand alone, overall positive charge for solubility, cell penetration, and subcellular localization, and the ability of these systems to populate two excited states with good yield for dual activity.
Many methods for drug delivery take advantage of the differences between cancer and normal cell surfaces. However, our method uses a delivery vector to achieve irreversible inactivation of a cancer target. Importantly, current delivery strategies for PDT drugs do not irreversibly inhibit crucial activity in cancer.99ȃ104 Instead these approaches rely on ligand-receptor interactions on the surface, which on their own show little anticancer activity. A notable exception is photodynamic-quenched ABPs based on cathepsin inhibitors.105 While these probes do inactivate cysteine cathepsins, accumulate in tumors in vivo, and contain an innovative method for photosensitizer activation, the PDT agent remains covalently bound and is not released from the enzyme–inhibitor conjugate after inactivation which limits their efficacy. These probes accumulate in lysosomes, which is typically less effective for PDT than agents that can reach mitochondria or other organelles.29,106 In contrast, our method of photosensitizer release allows for a traceless and clean break of the PDT agent from the delivery vector, presumably from the CTSB–inhibitor conjugate. We expect this will provide a distinct advantage over other deliverable PDT agents that either stay ligated to the delivery vector or rely on enzymatic reactions to cleave the linker between the photosensitizer and the vector because the vector and/or linker can alter membrane permeability and subcellular localization of the PDT agent.107,108 Further experiments will be needed to determine the subcellular localization of our Ru(II) photosensitizers before and after irradiation.
Our delivery strategy is strongly supported by recent developments in activity-based probes (ABPs) and fluorescence-guided surgery, which demonstrate that overexpression of cysteine cathepsins can be used to identify cancer and tumor-associated cells in vivo.6–12,109Importantly, researchers have taken advantage of high extracellular concentrations of proteases at tumor sites to effect the proteolytic release of PDT agents and other drugs.110–114 While the strategy does provide an advantage in amplification, where multiple equivalents of drug can be released through the catalytic action of tumor-associated proteases, it does nothing to inactivate proteases that are associated with invasiveness and metastatic behavior. Our strategy is a true combination therapy that achieves stoichiometric inactivation of the CTSB target with release of a catalyst that generates 1O2 to induce cell death. Given that high levels of synergy have already been reported in combining PDT and cysteine cathepsin inhibition in vivo for the treatment of breast cancer,115 our conjugates or derivatives thereof are promising leads for the development of novel breast cancer therapeutics. Although our method will be more effective for early-stage and localized disease than for late-stage metastatic cancer, we propose it will extend PDT to breast cancer, a cancer type for which there are no clinically approved protocols in place.116,117 In particular, new approaches for treating TNBC are needed because TNBC is especially hard to eradicate with follow-up chemotherapy including tamoxifen or trastuzumab that work for ER or HER2 positive types.118 We plan to explore topical application of our dual-action conjugates after surgical resection with subsequent irradiation inside the tumor cavity, which would help to avoid issues of hypoxia associated with larger tumors and light penetration through the skin, where melanin is the principle component that absorbs light >600 nm.
CONCLUSION
In conclusion, we report the synthesis and biological evaluation of dual-action Ru(II) photosensitizer conjugates. Epoxysuccinyl-based inhibitors of CTSB conjugated to five Ru(II) complexes (3–7) were synthesized and fully characterized. Compounds 3–7 inactivate purified CTSB in the low nM range and halt degradation of the extracellular matrix in a 3D pathomimetic model of TNBC. Collectively our data confirm that photoactivated ligand release of the photosensitizer (PCT) and generation of 1O2 (PDT) are crucial for achieving potent cell death. Further development of compounds that combine protease inactivation as a delivery method with photorelease and photosensitization, including Ru(II) complexes that are released and activated in the red visible and near-IR ranges, is ongoing in our laboratories.
Supplementary Material
ACKNOWLEDGMENTS
We gratefully acknowledge the National Institutes of Health (EB 016072), National Science Foundation (CHE 1800395), and Wayne State University (Rumble Fellowship to K.A.) for support of this research.
Footnotes
Supporting Information
The Supporting Information is available free of charge on the ACS Publications website at DOI: 10.1021/jacs.8b08853.
Experimental procedure for synthesis of 1–20 with spectral characterization data; progress curves for CTSB inactivation; live/dead cell and DQ-collagen proteolysis imaging data; photochemical data including time-resolved electronic absorbance and 1H NMR spectra for 5 and 7 after irradiation; time-resolved electronic absorption spectra for 4–7 in DMSO (25 °C); and DMEM cell growth media (37 °C) (PDF)
The authors declare no competing financial interest.
REFERENCES
- (1).Mohamed MM; Sloane BF Nat. Rev. Cancer 2006, 6, 764–775. [DOI] [PubMed] [Google Scholar]
- (2).Joyce JA; Hanahan D Cell Cycle 2004, 3, 1516–1519. [DOI] [PubMed] [Google Scholar]
- (3).Kramer L; Turk D; Turk B Trends Pharmacol. Sci 2017, 38, 873–898. [DOI] [PubMed] [Google Scholar]
- (4).Yim JJ; Tholen M; Klaassen A; Sorger J; Bogyo M Mol. Pharmaceutics 2018, 15, 750–758. [DOI] [PubMed] [Google Scholar]
- (5).Sensarn S; Zavaleta CL; Segal E; Rogalla S; Lee W; Gambhir SS; Bogyo M; Contag CH Mol. Imaging Biol 2016, 18, 820–829. [DOI] [PMC free article] [PubMed] [Google Scholar]
- (6).Withana N; Garland M; Verdoes M; Ofori L; Segal E; Bogyo M Labeling of active proteases in fresh-frozen tissues by topical application of quenched activity-based probes. Nat. Protoc 2016, 11, 184–91. [DOI] [PubMed] [Google Scholar]
- (7).Segal E; Prestwood TR; van der Linden WA; Carmi Y; Bhattacharya N; Withana N; Verdoes M; Habtezion A; Engleman EG; Bogyo M Chem. Biol 2015, 22, 148–158. [DOI] [PMC free article] [PubMed] [Google Scholar]
- (8).Verdoes M; Oresic Bender K; Segal E; van der Linden WA; Syed S; Withana NP; Sanman LE; Bogyo M J. Am. Chem. Soc 2013, 135, 14726–14730. [DOI] [PMC free article] [PubMed] [Google Scholar]
- (9).Cutter JL; Cohen NT; Wang J; Sloan AE; Cohen AR; Panneerselvam A; Schluchter M; Blum G; Bogyo M; Basilion JP PLoS One 2012, 7, e33060. [DOI] [PMC free article] [PubMed] [Google Scholar]
- (10).Blum G; von Degenfeld G; Merchant MJ; Blau HM; Bogyo M Nat. Chem. Biol 2007, 3, 668–677. [DOI] [PubMed] [Google Scholar]
- (11).Blum G; Mullins SR; Keren K; Fonovic M; Jedeszko C; Rice MJ; Sloane BF; Bogyo M Nat. Chem. Biol 2005, 1 , 203–209. [DOI] [PubMed] [Google Scholar]
- (12).Rothberg JM; Bailey KM; Wojtkowiak JW; Ben-Nun Y; Bogyo M; Weber E; Moin K; Blum G; Mattingly RR; Gillies RJ; Sloane BF Neoplasia 2013, 15, 1125–1137. [DOI] [PMC free article] [PubMed] [Google Scholar]
- (13).Weidle UH; Tiefenthaler G; Georges G Cancer Genom. Proteom 2014, 11, 67–80. [PubMed] [Google Scholar]
- (14).Choi KY; Swierczewska M; Lee S; Chen X Theranostics 2012, 2, 156–178. [DOI] [PMC free article] [PubMed] [Google Scholar]
- (15).Vandooren J; Opdenakker G; Loadman PM; Edwards DR Adv. Drug Delivery Rev 2016, 97, 144–155. [DOI] [PubMed] [Google Scholar]
- (16).Joyce JA; Baruch A; Chehade K; Meyer-Morse N; Giraudo E; Tsai F-Y; Greenbaum DC; Hager JH; Bogyo M; Hanahan D Cancer Cell 2004, 5, 443–453. [DOI] [PubMed] [Google Scholar]
- (17).Bell-McGuinn KM; Garfall AL; Bogyo M; Hanahan D; Joyce JA Cancer Res. 2007, 67, 7378–7385. [DOI] [PubMed] [Google Scholar]
- (18).Elie Benelita T; Gocheva V; Shree T; Dalrymple Stacie A; Holsinger Leslie J; Joyce Johanna A Biochimie 2010, 92, 1618–1624. [DOI] [PMC free article] [PubMed] [Google Scholar]
- (19).Withana NP; Blum G; Sameni M; Slaney C; Anbalagan A; Olive MB; Bidwell BN; Edgington L; Wang L; Moin K; Sloane BF; Anderson RL; Bogyo MS; Parker BS Cancer Res. 2012, 72, 1199–1209. [DOI] [PMC free article] [PubMed] [Google Scholar]
- (20).Shree T; Olson OC; Elie BT; Kester JC; Garfall AL; Simpson K; Bell-McGuinn KM; Zabor EC; Brogi E; Joyce JA Genes Dev. 2011, 25, 2465–2479. [DOI] [PMC free article] [PubMed] [Google Scholar]
- (21).Mikhaylov G; Klimpel D; Schaschke N; Mikac U; Vizovisek M; Fonovic M; Turk V; Turk B; Vasiljeva O Angew. Chem., Int. Ed 2014, 53, 10077–10081. [DOI] [PMC free article] [PubMed] [Google Scholar]
- (22).Williams CB; Yeh ES; Soloff AC Npj Breast Cancer 2016, 2, 15025. [DOI] [PMC free article] [PubMed] [Google Scholar]
- (23).Turner D Trans. Med. Chir. Soc. Edinb 1903, 22, 43–46. [PMC free article] [PubMed] [Google Scholar]
- (24).Bonnett R; Berenbaum M Ciba Found. Symp 1989, 146, 40–59. [DOI] [PubMed] [Google Scholar]
- (25).Jori G; Photodynamic Therapy: Basic and Preclinical Aspects In CRC Handbook of Organic Photochemistry and Photobiology; CRC Press: 1995, 1379–1383. [Google Scholar]
- (26).Dougherty TJ; Levy JG Mechanistic Principles of Photodynamic Therapy In CRC Handbook of Organic Photochemistry and Photobiology, 2nd ed.; CRC Press LLC: 2004; pp 147/141–147/117. [Google Scholar]
- (27).Henderson BW; Gollnick SO Mechanistic Principles of Photodynamic Therapy In CRC Handbook of Organic Photochemistry and Photobiology, 2nd ed; CRC Press LLC: 2004; pp 145/141–145/125. [Google Scholar]
- (28).Castano AP; Demidova TN; Hamblin MR Photodiagn. Photodyn. Ther 2005, 2, 91–106. [DOI] [PMC free article] [PubMed] [Google Scholar]
- (29).Castano AP; Demidova TN; Hamblin MR Photodiagn. Photodyn. Ther 2005, 1, 279–293. [DOI] [PMC free article] [PubMed] [Google Scholar]
- (30).Castano AP; Demidova TN; Hamblin MR Photodiagn. Photodyn. Ther 2005, 2, 1–23. [DOI] [PMC free article] [PubMed] [Google Scholar]
- (31).Josefsen LB; Boyle RW Met.-Based Drugs 2008, 2008, 276109. [DOI] [PMC free article] [PubMed] [Google Scholar]
- (32).Sessler JL; Hemmi G; Mody TD; Murai T; Burrell A; Young SW Acc. Chem. Res 1994, 27, 43–50. [Google Scholar]
- (33).Jung HS; Han J; Shi H; Koo S; Singh H; Kim H-J; Sessler JL; Lee JY; Kim J-H; Kim JS J. Am. Chem. Soc 2017, 139, 7595–7602. [DOI] [PMC free article] [PubMed] [Google Scholar]
- (34).Mroz P; Sharma SK; Zhiyentayev T; Huang Y-Y; Hamblin MR In Drug Delivery in Oncology; Wiley-VCH Verlag GmbH & Co. KGaA: 2011; pp 1569–1603. [Google Scholar]
- (35).Donnelly R; McCarron P; Woolfson D Recent Pat. Drug Delivery Formulation 2009, 3, 1–7. [DOI] [PubMed] [Google Scholar]
- (36).Calixto GMF; Bernegossi J; Marise de Freitas L; Fontana CR; Chorilli M Molecules 2016, 21, 342. [DOI] [PMC free article] [PubMed] [Google Scholar]
- (37).Moret F; Reddi EJ Porphyrins Phthalocyanines 2017, 21, 239–256. [Google Scholar]
- (38).Heinemann F; Karges J; Gasser G Acc. Chem. Res 2017, 50, 2727–2736. [DOI] [PubMed] [Google Scholar]
- (39).Clarke MJ Coord. Chem. Rev 2003, 236, 209–233. [Google Scholar]
- (40).Alessio E; Mestroni G; Bergamo A; Sava G Met. Ions Biol. Syst 2004, 42, 323–351. [PubMed] [Google Scholar]
- (41).Hartinger CG; Zorbas-Seifried S; Jakupec MA; Kynast B; Zorbas H; Keppler BK J. Inorg. Biochem 2006, 100, 891–904. [DOI] [PubMed] [Google Scholar]
- (42).Alessio E; Mestroni G; Bergamo A; Sava G Curr. Top. Med. Chem 2004, 4, 1525–1535. [DOI] [PubMed] [Google Scholar]
- (43).Lee J; Udugamasooriya DG; Lim H-S; Kodadek T Nat. Chem. Biol 2010, 6, 258–260. [DOI] [PMC free article] [PubMed] [Google Scholar]
- (44).Allison RR; Downie GH; Cuenca R; Hu X-H; Childs CJH; Sibata CH Photodiagn. Photodyn. Ther 2004, 1, 27–42. [DOI] [PubMed] [Google Scholar]
- (45).Howerton BS; Heidary DK; Glazer EC J. Am. Chem. Soc 2012, 134, 8324–8327. [DOI] [PubMed] [Google Scholar]
- (46).Smith NA; Sadler PJ Philos. Trans. R. Soc. A 2013, 371, 20120519. [DOI] [PMC free article] [PubMed] [Google Scholar]
- (47).Schatzschneider U Eur. J. Inorg. Chem 2010, 2010, 1451 – 1467. [Google Scholar]
- (48).Frei A; Rubbiani R; Tubafard S; Blacque O; Anstaett P; Felgentrager A; Maisch T; Spiccia L; Gasser G J. Med. Chem 2014, 57, 7280–7292. [DOI] [PubMed] [Google Scholar]
- (49).Arenas Y; Monro S; Shi G; Mandel A; McFarland S; Lilge L Photodiagn. Photodyn. Ther 2013, 10, 615–625. [DOI] [PubMed] [Google Scholar]
- (50).Fong J; Kasimova K; Arenas Y; Kaspler P; Lazic S; Mandel A; Lilge L Photochem. Photobiol Sci 2015, 14, 2014–2023. [DOI] [PubMed] [Google Scholar]
- (51).Kaspler P; Lazic S; Forward S; Arenas Y; Mandel A; Lilge L, Photochem. Photobiol. Sci 2016, 15, 481–495. [DOI] [PubMed] [Google Scholar]
- (52).Puckett CA; Ernst RJ; Barton JK Dalton Trans. 2010, 39, 1159–1170. [DOI] [PMC free article] [PubMed] [Google Scholar]
- (53).Puckett CA; Barton JK Biochemistry 2008, 47, 11711–11716. [DOI] [PMC free article] [PubMed] [Google Scholar]
- (54).Mulcahy SP; Li S; Korn R; Xie X; Meggers E Inorg. Chem 2008, 47, 5030–5032. [DOI] [PubMed] [Google Scholar]
- (55).Meggers E Chem. Commun 2009, 1001–1010. [DOI] [PubMed] [Google Scholar]
- (56).Respondek T; Sharma R; Herroon MK; Garner RN; Knoll JD; Cueny E; Turro C; Podgorski I; Kodanko JJ ChemMedChem 2014, 9, 1306–1315. [DOI] [PMC free article] [PubMed] [Google Scholar]
- (57).Ramalho SD; Vieira Paulo C; Sharma R; Kodanko Jeremy J; White Jessica K; Turro C; Aggarwal N; Chalasani A; Sameni M; Moin K; Sloane Bonnie F; Moin K; Sloane Bonnie F PLoS One 2015, 10, e0142527. [DOI] [PMC free article] [PubMed] [Google Scholar]
- (58).(a) Knoll JD; Albani BA; Turro C Chem. Commun 2015, 51, 8777–8780. [DOI] [PMC free article] [PubMed] [Google Scholar]; (b) Knoll JD; Albani BA; Durr CB; Turro C J. Phys. Chem. A 2014, 118, 10603–10610. [DOI] [PMC free article] [PubMed] [Google Scholar]
- (59).Knoll JD; Albani BA; Turro C Acc. Chem. Res 2015, 48, 2280–2287. [DOI] [PMC free article] [PubMed] [Google Scholar]
- (60).Towatari T; Nikawa T; Murata M; Yokoo C; Tamai M; Hanada K; Katunuma N FEBS Lett. 1991, 280, 311–315. [DOI] [PubMed] [Google Scholar]
- (61).Stern I; Schaschke N; Moroder L; Turk D Biochem. J 2004. 381, 511–517. [DOI] [PMC free article] [PubMed] [Google Scholar]
- (62).Montalti M; Credi A; Prodi L; Gandolfi MT Handbook of Photochemistry, 3rd ed.; CRC Press: Boca Raton, FL, 2006. [Google Scholar]
- (63).Bhattacharyya K; Das PK Chem. Phys. Lett 1985, 116, 326 332. [Google Scholar]
- (64).Nakamaru K Bull. Chem. Soc. Jpn 1982, 55, 2697–2705. [Google Scholar]
- (65).Huisman M; White JK; Lewalski VG; Podgorski I; Turro C; Kodanko JJ Chem. Commun 2016, 52, 12590–12593. [DOI] [PMC free article] [PubMed] [Google Scholar]
- (66).Jedeszko C; Sameni M; Olive MB; Moin K; Sloane BF Curr. Protoc. Cell Biol 2008, 39, 4.20.1. [DOI] [PMC free article] [PubMed] [Google Scholar]
- (67).Podgorski I; Linebaugh BE; Sameni M; Jedeszko C; Bhagat S; Cher ML; Sloane BF Neoplasia 2005, 7, 207–223. [DOI] [PMC free article] [PubMed] [Google Scholar]
- (68).Sameni M; Dosescu J; Moin K; Sloane BF Mol. Imaging 2003, 2, 159–175. [DOI] [PubMed] [Google Scholar]
- (69).Aggarwal N; Sloane BF Proteomics: Clin. Appl 2014, 8, 427–437. [DOI] [PMC free article] [PubMed] [Google Scholar]
- (70).Roshy S; Sloane BF; Moin K Cancer Metastasis Rev. 2003, 22, 271–286. [DOI] [PubMed] [Google Scholar]
- (71).Turk V; Stoka V; Vasiljeva O; Renko M; Sun T; Turk B; Turk D Biochim. Biophys. Acta, Proteins Proteomics 2012, 1824, 68–88. [DOI] [PMC free article] [PubMed] [Google Scholar]
- (72).Montaser M; Lalmanach G; Mach L Biol. Chem 2002, 383, 1305–1308. [DOI] [PubMed] [Google Scholar]
- (73).Schiefer IT; Tapadar S; Litosh V; Siklos M; Scism R; Wijewickrama GT; Chandrasena EP; Sinha V; Tavassoli E; Brunsteiner M; Fa M; Arancio O; Petukhov P; Thatcher GRJ J. Med. Chem 2013, 56, 6054–6068. [DOI] [PMC free article] [PubMed] [Google Scholar]
- (74).Lopez-Cobenas A; Cledera P; Sanchez JD; Lopez-Alvarado P; Ramos MT; Avendano C; Menendez JC Synthesis 2005. 3412–3422. [Google Scholar]
- (75).Sharma R; Knoll JD; Ancona N; Martin PD; Turro C; Kodanko JJ Inorg. Chem 2015, 54, 1901–1911. [DOI] [PMC free article] [PubMed] [Google Scholar]
- (76).Huisman M; Kodanko J; Arora K; Herroon MK; Alnaed M; Endicott JF; Podgorski I; Kodanko JJ Inorg. Chem 2018, 57, 7881–7891. [DOI] [PMC free article] [PubMed] [Google Scholar]
- (77).Lameijer LN; Hopkins SL; Breve TG; Askes SHC; Bonnet S Chem. - Eur. J 2016, 22, 18484–18491. [DOI] [PMC free article] [PubMed] [Google Scholar]
- (78).Bahreman A; Limburg B; Siegler MA; Bouwman E; Bonnet S Inorg. Chem 2013, 52, 9456–9469. [DOI] [PubMed] [Google Scholar]
- (79).Li A; Yadav R; White JK; Herroon MK; Callahan BP; Podgorski I; Turro C; Scott EE; Kodanko JJ Chem. Commun 2017, 53, 3673–3676. [DOI] [PMC free article] [PubMed] [Google Scholar]
- (80).Huisman M; Lewalski VG; Kodanko JJ; White JK; Turro C; Podgorski I Chem. Commun 2016, 52, 12590–12593. [DOI] [PMC free article] [PubMed] [Google Scholar]
- (81).Poynton FE; Bright SA; Blasco S; Williams DC; Kelly JM; Gunnlaugsson T Chem. Soc. Rev 2017, 46, 7706–7756. [DOI] [PubMed] [Google Scholar]
- (82).Pierroz V; Joshi T; Leonidova A; Mari C; Schur J; Ott I; Spiccia L; Ferrari S; Gasser G J. Am. Chem. Soc 2012, 134, 20376–20387. [DOI] [PubMed] [Google Scholar]
- (83).Huang H; Zhang P; Yu B; Chen Y; Wang J; Ji L; Chao H J. Med. Chem 2014, 57, 8971–8983. [DOI] [PubMed] [Google Scholar]
- (84).Chrzanowska M; Katafias A; Impert O; Kozakiewicz A; Surdykowski A; Brzozowska P; Franke A; Zahl A; Puchta R; van Eldik R Dalton Trans. 2017, 46, 10264–10280. [DOI] [PubMed] [Google Scholar]
- (85).Mazuryk O; Magiera K; Rys B; Suzenet F; Kieda C; Brindell M JBIC, J. Biol. Inorg. Chem 2014, 19, 1305–1316. [DOI] [PMC free article] [PubMed] [Google Scholar]
- (86).Lameijer LN; Hopkins SL; Brevé TG; Askes SHC; Bonnet S Chem. - Eur. J 2016, 22, 18484–18491. [DOI] [PMC free article] [PubMed] [Google Scholar]
- (87).Powers JC; Asgian JL; Ekici OD; James KE Chem. Rev 2002, 102, 4639–4750. [DOI] [PubMed] [Google Scholar]
- (88).Turk B Nat. Rev. Drug Discovery 2006, 5, 785–799. [DOI] [PubMed] [Google Scholar]
- (89).Otto H-H; Schirmeister T Chem. Rev 1997, 97, 133–172. [DOI] [PubMed] [Google Scholar]
- (90).Frlan R; Gobec S Curr. Med. Chem 2006, 13, 2309–2327. [DOI] [PubMed] [Google Scholar]
- (91).Strelow JM SLAS Discovery 2017, 22, 3–20. [DOI] [PubMed] [Google Scholar]
- (92).Lovitt CJ; Shelper TB; Avery VM Assay Drug Dev. Technol 2013, 11, 435–448. [DOI] [PubMed] [Google Scholar]
- (93).Elliott NT; Yuan F J. Pharm. Sci 2011, 100, 59–74. [DOI] [PubMed] [Google Scholar]
- (94).Lovitt CJ; Shelper TB; Avery VM J. Cancer Res. Clin. Oncol 2015, 141, 951–959. [DOI] [PMC free article] [PubMed] [Google Scholar]
- (95).Herroon MK; Sharma R; Rajagurubandara E; Turro C; Kodanko Jeremy J; Podgorski I Biol. Chem 2016, 397, 571–582. [DOI] [PMC free article] [PubMed] [Google Scholar]
- (96).Sharma R; Knoll JD; Martin PD; Podgorski I; Turro C; Kodanko JJ Inorg. Chem 2014, 53, 3272–3274. [DOI] [PMC free article] [PubMed] [Google Scholar]
- (97).Respondek T; Garner RN; Herroon MK; Podgorski I; Turro C; Kodanko JJ J. Am. Chem. Soc 2011, 133, 17164–17167. [DOI] [PMC free article] [PubMed] [Google Scholar]
- (98).Damrauer NH; Cerullo G; Yeh A; Boussie TR; Shank CV; McCusker JK Science 1997, 275, 54. [DOI] [PubMed] [Google Scholar]
- (99).Arosio D; Casagrande C Adv. Drug Delivery Rev 2016, 97, 111–143. [DOI] [PubMed] [Google Scholar]
- (100).Marchetti C; Palaia I; Giorgini M; De Medici C; Iadarola R; Vertechy L; Domenici L; Di Donato V; Tomao F; Muzii L; Panici PB OncoTargets Ther. 2014, 7, 1223–1236. [DOI] [PMC free article] [PubMed] [Google Scholar]
- (101).Cukierman E; Khan DR Biochem. Pharmacol 2010, 80, 762–770. [DOI] [PMC free article] [PubMed] [Google Scholar]
- (102).Malam Y; Loizidou M; Seifalian AM Trends Pharmacol. Sci 2009, 30, 592–599. [DOI] [PubMed] [Google Scholar]
- (103).Peer D; Karp JM; Hong S; Farokhzad OC; Margalit R; Langer R Nat. Nanotechnol 2007, 2, 751–760. [DOI] [PubMed] [Google Scholar]
- (104).Shadidi M; Sioud M Drug Resist. Updates 2004, 6, 363–371. [DOI] [PubMed] [Google Scholar]
- (105).Ben-Nun Y; Merquiol E; Brandis A; Turk B; Scherz A; Blum G Theranostics 2015, 5, 847–862. [DOI] [PMC free article] [PubMed] [Google Scholar]
- (106).MacDonald IJ; Morgan J; Bellnier DA; Paszkiewicz Geraldine ML; Whitaker JE; Litchfield DJ; Dougherty TJ Photochem. Photobiol 2008, 70, 789–797. [PubMed] [Google Scholar]
- (107).Zuluaga M-F; Sekkat N; Gabriel D; van den Bergh H; Lange N Mol. Cancer Ther 2013, 12, 306–313. [DOI] [PubMed] [Google Scholar]
- (108).Li S-Y; Cheng H; Qiu W-X; Liu L-H; Chen S; Hu Y; Xie B-R; Li B; Zhang X-Z ACS Appl. Mater. Interfaces 2015, 7, 28319–28329. [DOI] [PubMed] [Google Scholar]
- (109).Mullins SR; Sameni M; Blum G; Bogyo M; Sloane BF; Moin K Biol. Chem 2012, 393, 1405–1416. [DOI] [PMC free article] [PubMed] [Google Scholar]
- (110).Akinboye ES; Rosen MD; Bakare O; Denmeade SR Bioorg. Med. Chem 2017, 25, 6707–6717. [DOI] [PMC free article] [PubMed] [Google Scholar]
- (111).Gabriel D; Zuluaga MF; Martinez MN; Campo MA; Lange N J. Drug Delivery Sci. Technol 2009, 19, 15–24. [Google Scholar]
- (112).Tauro JR; Lee B-S; Lateef SS; Gemeinhart RA Peptides 2008, 29, 1965–1973. [DOI] [PMC free article] [PubMed] [Google Scholar]
- (113).Warnecke A; Fichtner I; Sass G; Kratz F Arch. Pharm 2007, 340, 389–395. [DOI] [PubMed] [Google Scholar]
- (114).de Groot FMH; Broxterman HJ; Adams HPHM; van Vliet A; Tesser GI; Elderkamp YW; Schraa AJ; Kok RJ; Molema G; Pinedo HM; Scheeren HW Mol. Cancer Ther 2002, 1, 901–911. [PubMed] [Google Scholar]
- (115).Zsebik B; Symonowicz K; Saleh Y; Ziolkowski P; Bronowicz A; Vereb G Cell Proliferation 2007, 40, 38–49. [DOI] [PMC free article] [PubMed] [Google Scholar]
- (116).Aggarwal N; Santiago AM; Kessel D; Sloane BF Breast Cancer Res. Treat 2015, 154, 251–262. [DOI] [PMC free article] [PubMed] [Google Scholar]
- (117).Saneesh Babu PS; Manu PM; Dhanya TJ; Tapas P; Meera RN; Surendran A; Aneesh KA; Vadakkancheril SJ; Ramaiah D; Nair SA; Pillai MR Sci. Rep 2017, 7, 42126. [DOI] [PMC free article] [PubMed] [Google Scholar]
- (118).Nguyen PL; Taghian AG; Katz MS; Niemierko A; Abi Raad RF; Boon WL; Bellon JR; Wong JS; Smith BL; Harris JR J. Clin. Oncol 2008, 26, 2373–2378. [DOI] [PubMed] [Google Scholar]
Associated Data
This section collects any data citations, data availability statements, or supplementary materials included in this article.