Abstract
Introduction
The phenomenon of lymph node metastasis has been known for a long time. However, the underlying mechanism by which malignant tumor cells are able to break loose from the primary tumor site remains unclear. In particular, two competing fluid sensitive migration mechanisms have been reported in the experimental literature: (i) autologous chemotaxis (Shields et al. in Cancer Cell 11:526–538, 2007) which gives rise to downstream migration; (ii) an integrin-mediated and strain-induced upstream mechanism (Polacheck et al. in PNAS 108:11115–11120, 2011). How can these two competing mechanisms be used as a means for metastatic behavior in a realistic tumor setting? Excessive fluid flow is typically produced from leaky intratumoral blood vessels and collected by lymphatics in the peritumoral region giving rise to a heterogeneous fluid velocity field and a corresponding heterogeneous cell migration behavior, quite different from the experimental setup.
Method
In order to shed light on this issue there is a need for tools which allow one to extrapolate the observed single cell behavior in a homogeneous microfluidic environment to a more realistic, higher-dimensional tumor setting. Here we explore this issue by using a computational multiphase model. The model has been trained with data from the experimental results mentioned above which essentially reflect one-dimensional behavior. We extend the model to an envisioned idealized two-dimensional tumor setting.
Result
A main observation from the simulation is that the autologous chemotaxis migration mechanism, which triggers tumor cells to go with the flow in the direction of lymphatics, becomes much more aggressive and effective as a means for metastasis in the presence of realistic IF flow. This is because the outwardly directed IF flow generates upstream cell migration that possibly empowers small clusters of tumor cells to break loose from the primary tumor periphery. Without this upstream stress-mediated migration, autologous chemotaxis is inclined to move cells at the rim of the tumor in a homogeneous and collective, but space-demanding style. In contrast, inclusion of realistic IF flow generates upstream migration that allows two different aspects to be synthesized: maintain the coherency and solidity of the the primary tumor and at the same time cleave the outgoing waves of tumor cells into small clusters at the front that can move collectively in a more specific direction.
Keywords: Cell-migration, Multiphase flow, Interstitial fluid, Interstitial fluid pressure, Lymphatic flow, Vascular flow, Autologous chemotaxis, Chemokine, Receptor
Introduction
Background
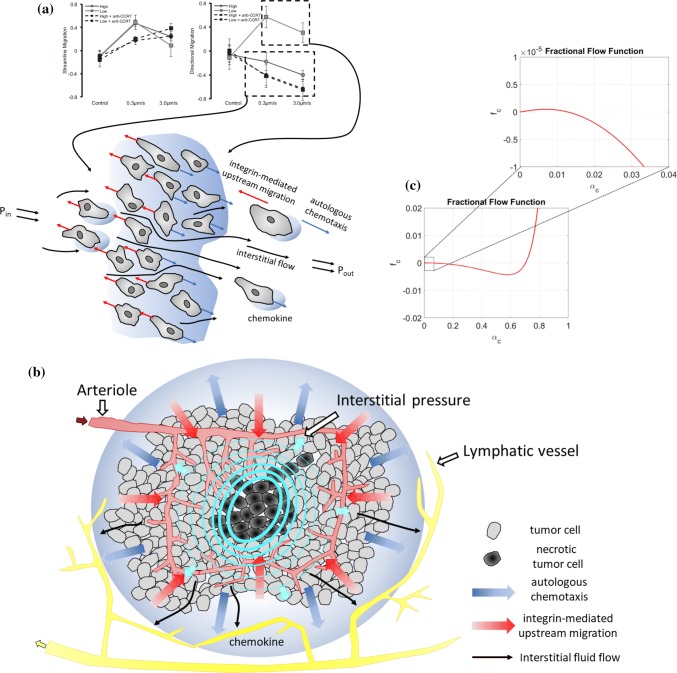
The phenomenon of lymph node metastasis has been recognized for a long time. However, the underlying mechanism by which malignant tumor cells are able to break loose from the primary tumor site, invade the lymphatics and metastasize to lymph nodes are unclear.21 Interstitial fluid (IF) flow can alter the tumor microenvironment and may therefore play a crucial role in tumor cell progression and malignancy. For instance, IF flow can create a asymmetric pericellular gradient of chemotactic proteins which the cells migrate towards through chemotaxis.9,12,20,29,30 Polacheck et al.26 extended the study by Shields et al.30 and demonstrated that the magnitude of fluid velocity (i.e., the magnitude of the IF pressure gradient) as well as the cell seeding density affected the migration direction. Their work provided further evidence that CCR7-mediated autologous chemotaxis30 is the mechanism that leads to cancer cell migration in the flow direction. However, it was also observed that there is another mechanism that caused strain-induced migration against the flow. Experiments were conducted at two different cell seeding densities and at two different flow velocities. The authors introduced two metrics, a streamline migration metric and a directional migration metric, which quantified if the cells migrated parallel to the flow and if the cells migrated upstream/downstream, respectively. As interstitial flow was introduced, the cells at both densities migrated along streamlines, see Fig. 1a. It was shown that the low cell seeding density culture migrated with the flow in accordance with the behavior reported in Ref. 30. However, for the high cell seeding density the migration was dominated by upstream migration. In addition, this migration against the flow direction was highly sensitive to the fluid velocity. Moreover, when CCR7 was blocked and chemotaxis was negated, both high and low density cultures migrated upstream. Polacheck et al.27 further investigated the effects of interstitial fluid flow stresses imparted on cells. As the cell tries to maintain static equilibrium, all fluid stresses imparted on the cell must be balanced by tension in matrix adhesions. This force balance will give rise to a greater matrix adhesion tension on the upstream side of the cell. This tension activates 1-integrin adhesion complexes, resulting in localization and activation of focal adhesion (FA) proteins near the upstream membrane of the cell and thereby stimulating upstream migration. Tien et al.25,33 examined a compact cell aggregate to demonstrate the effects of interstitial fluid pressure. They determined that the directionality of the interstitial pressure profile altered the frequency of invasion of cells located at the surface of an aggregate. The authors suggested that the chemical composition dominated any purely mechanical effects.
Figure 1.
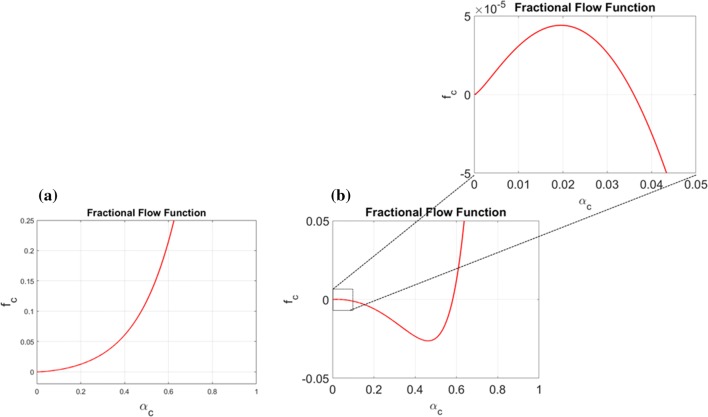
Illustration of the gap between single cell behavior in a homogeneous microfluidic environment and a ”real-world” tumor system. (a) Illustration of the competing upstream and downstream single cell behavior (essentially one-dimensional) in a homogeneous microfluidic setting as observed in Ref. 26. (b) Illustration of a real-world tumor setting where excessive IF fluid flow is generated from a leaky intratumoral vascular system and adsorbed by lymphatics in the peritumoral region. The IF flow away from the primary tumor may give rise to a downstream heterogeneous chemotactic migration towards higher chemokine concentrations in the peritumoral region whereas the upstream migration mechanism might be effective for higher volume fractions of tumor cells near the tumor margin. (c) Plot showing which is directly involved in the fluid stress-mediated cell velocity component in (1) with parameters as given by (11), (14), and (15). When we zoom in on we see that it has a tiny positive slope for small . This reflects a fine-tuned mechanotransductive machinery that will generate downstream migration of tumor cells for a sufficiently small cell volume fraction (), otherwise will create upstream cell migration.
Aim of This Work
The results reported in Ref. 26 suggest a competition between upstream and downstream tumor cell migration, both regulated by IF flow, as visualized in Fig. 1a.
However, two natural questions that arise are:
How can the two apparently competing migration mechanisms portrayed above be used as a means for metastasis, i.e., the process where single tumor cells or clusters of cells are able to break loose from the primary tumor site and migrate to nearby lymphatics?
Why do these two opposing migration mechanisms not cancel out one another and to a lesser extent serve as a metastatic tool?
In Ref. 26 the following scenario was proposed as a possible explanation of the role played, respectively, by the upstream and downstream migration mechanism:
“Cell density and interstitial flow rates decrease with increasing distance from the tumor, both of which are highest at the tumor margin. Because high cell density and high flow rates both favor upstream migration, our data suggest the existence of an “escape radius” at a critical distance from the tumor surface. For cells at a radial distance less than the escape radius, interstitial flow guides cells upstream, keeping cells clustered with the tumor, but for cells located beyond the escape radius, interstitial flow guides cells downstream, toward draining lymphatics or veins. Although further modeling and in vivo data are required to validate this hypothesis, the escape radius could be a critical parameter in estimating the severity of metastatic disease and determining proper treatment.”
However, there is a potentially large gap between the observed single cell behavior in a microfluidic homogeneous environment and corresponding behavior in a more realistic tumor setting. Hence, a main objective of this work is to put the above statement to a test by employing a simplest possible computational multiphase model. Our workflow consists of the following two steps:
-
(i)
Train our model with data from the referred experimental works26,30 reflecting essentially one-dimensional behavior (see Fig. 1a);
-
(ii)
Extend and modify the model such that it can mimic a more realistic tumor in a two-dimensional setting where the model is informed with parameters determined in step (i) (see Fig. 1b).
Method
The main components of our mathematical model are:
A general cell–fluid model is formulated that is rooted in mixture theory principles. In particular, the model includes general momentum balance equations where essential fluid–ECM interaction, cell–ECM, as well as cell–fluid interaction forces are accounted for through explicit correlations. These momentum balance equations appear as a natural and systematic extension from single-phase Darcy’s equation to a two-phase cell–fluid context.
The resulting mass and momentum balance equations are coupled to a simplified transport-reaction system of partial differential equations that can describe autologous chemotaxis.
The obtained cell–fluid migration model is capable of representing the stress-mediated upstream migration, the downstream migration driven by autologous chemotaxis, and the internal competition between them, consistent with experiments as reported in Refs. 30 and 26. This was carefully explored in the two recent works.35,36 Through that study, the model was trained with data from relevant in vitro experiments and insight was gained for setting various model parameters. However, the experimental setup in Refs. 30 and 26 is different from the in vivo tumor setting in several ways, as indicated by Figs. 1a and 1b. For the in vitro experiments the fluid flow essentially is one-dimensional, from a high pressure zone to a low pressure zone across a cell aggregate placed in the center. The corresponding cell migration behavior is largely one-dimensional, either in the downstream or upstream direction. Therefore, it is not so clear what the net behavior will be if these two concurrent and different migration mechanisms are at work in a higher-dimensional tumor setting (see Fig. 1b). In a tumor setting, an elevated IF pressure is typically produced due to an intratumoral leaky vascular system which generates excessive IF flow in the region close to the tumor periphery.11,16 Depending on the position of nearby peritumoral collecting lymphatics, a more or less heterogeneous IF velocity field is generated which strongly affects the distribution of chemokines. In particular, one might expect that chemokines tend to accumulate at nearby functional lymphatics. Consequently, the competing migration mechanisms can give rise to much more heterogeneous and complex behavior than seen in the one-dimensional case representing a microfluidic flow system.
The multiphase approach gives rise to an interstitial cell velocity which takes the following form expressed in terms of the Darcy-like (superficial velocity) where are the volume fraction of cell and fluid such that :
| 1 |
In particular, the cell velocity involves three different velocity components. The first is where is the total velocity dictated essentially by the interstitial fluid velocity and is a function of cell–ECM interaction, fluid–ECM interaction, and cell–fluid interaction effect, and is naturally related to the mechanotransductive machinery. An illustration of is shown in Fig. 1c where the negative dip signals upstream migration. The second is which represents the cell dispersive effect (arbitrary migration in all directions). The third is which represents the autologous chemotactic effect that amounts to motion in the direction of a positive gradient of C (chemokine). The coefficient is also a function of the three mentioned interaction forces.
Main Findings
The main observations from simulating the model in an envisioned two-dimensional tumor setting with a realistic interstitial fluid (IF) flow field can be summarized as follows:
The combination of the migration mechanism (fluid stress) and (chemotaxis) may allow small clusters of tumor cells to detach from the primary tumor site and migrate away from it at the same time as the primary tumor remains tightly packed and cohesive. A delicate property of the stress-generated migration reflected by and controlled by the tumor cells through the cell–fluid and cell–ECM interaction terms, is that it becomes nonlinear (see Fig. 1c). This nonlinearity possibly results in a strong and effective upstream migration for large values of which are found close to the tumor margin whereas it becomes weak for small values of at the interface between tumor margin and surrounding environment.
Lowering the IF velocity (and thereby lowering ) reduces the possibility for the outgoing chemotaxis-driven tumor cells to be cleaved from followers behind. Blocking the chemotaxis effect eliminates the ability of low concentrations of tumor cells to escape from the primary tumor. It is the combination of both mechanisms that empower the tumor cells to behave aggressively.
An unexpected prediction by the model is that reducing the hydraulic conductivity in the peritumoral environment while keeping all other parameters fixed, appears as an efficient mechanism for enhancing the ability of small clusters of tumor cells to move more aggressively away from primary tumor in the direction of lymphatics. Reduced conductivity can be a result of active remodelling of ECM through alignment of fibers, fibroblast activity, etc., as reported in Refs. 22, 23 and 37.
Compact Summary of the Model
The main variables used in the following compact description of the cell–fluid model are (see Appendix A for a more complete description):
Volume fraction of cell, fluid
Cell growth/death
Interstitial cell and fluid velocity
ECM component, protease, chemokine
IF pressure, cell phase pressure
Cell–cell stress, chemotaxis stress
Cell mobility and total mobility
Conductivity of vascular vessel wall
Effective vascular pressure
Conductivity of lymphatic vessel wall
Effective lymphatic pressure
IFP at the boundary of tumor region
Tumor region
The model takes the following form (which has been derived from (29) in Appendix A):
| 2 |
for where the interstitial cell velocity is given by (30)1. Similarly, IF velocity is given by (30)2 and appears in the convective terms in the transport-reaction equations, respectively, for G in (2)3 and C in (2)4. These terms reflect that the secreted protease G and released ECM-bound chemokine C flow with the fluid velocity. Moreover, in order to compute needed in (30) we first solve the elliptic problem for [see (37)–(39) in Appendix A for derivation]
| 3 |
We refer to (32) and (33) for explicit expressions for and . See (27) and (28) for more information related to the drainage of IF caused by the blood vessels and lymphatic vessels expressed by the right-hand-side of (3). Knowing IF pressure , we use (38) for the total velocity given by
| 4 |
which is required in the calculation of and in (30). The model (2)–(4), combined with (30), is subject to the boundary condition
| 5 |
where is the outward normal on . Initial data are given by
| 6 |
Remark 1
Note that from the elliptic problem (3) we extract the IF pressure field which largely determines the total velocity through (4).
Similarly, we see from (3) the essential role played by IF flow caused by leaky blood vessels and adsorbing lymphatics through the source term and .
Remark 2
Regarding the cell velocity , the expression (30)1 identifies three different cell migration mechanisms:
| 7 |
with
| 8 |
| 9 |
| 10 |
The first term represents a stress caused by the flowing IF on the cancer cells. Experiments reported in Ref. 30 indicate that cancer cells to a large extent will resist the direct pushing force represented by this stress and as shown in Fig. 1a and reported in Ref. 26, can generate upstream migration. The second term accounts for a diffusive cell–cell repelling force that leads to a weak non-directional migration. The third term reflects a directional cell migration towards positive gradients in chemokine C as reported in Refs. 9, 26 and 30.
Correlations for Interactions
We assume the following correlations to represent fluid–ECM interaction , cell–ECM interaction , and cell–fluid interaction :
| 11 |
Note that this form for the different interaction forces ensure that the resulting cell–fluid model is consistent with standard modeling of creeping flow in porous media which makes use of permeability (hydraulic conductivity) and relative permeability functions to account for the presence of several phases that share the same pore space.2,38 We may think of as parameters reflecting more ”static” properties of the tissue like ( is fluid viscosity, K is hydraulic conductivity/permeability), whereas can account for dynamic properties, i.e., various coupling mechanisms related to ECM fiber alignment, reduced resistance force due to proteolytic activity, etc. Furthermore, the term reflects that the the interstitial flow imposes a physical drag on cancer cells. As observed in Ref. 26 the effect of this drag force is not to generate a motion in the direction of the fluid flow (as would be the case for a ”normal” fluid). Instead, it has been observed that this drag force can activate mechanotransductive machinery and lead to directed cellular migration in the upstream direction of the flow in a process termed rheotaxis.27 By inserting (11) in (31) we arrive at the following expressions
| 12 |
where we use and to describe relative strength of interaction forces
| 13 |
In Ref. 36 we explored how the intricate balance between the downstream chemotactic driven migration and the integrin-mediated upstream migration, as reflected by (7)–(10), was consistent with the results shown in Fig. 1a when I was set to be negative. In particular, we may imagine that the cancer cells are in a position where they can ”tune” this term, both the magnitude and sign. More detailed information about biochemical aspects that influences this possible upstream momentum generation could be included in the parameter , similar to . To conclude, in Ref. 36 it was suggested that the form of the term, i.e., its dependence on various variables as well as the sign, is the mathematical interpretation of the previously unknown mechanism which in Ref. 27 is considered as the result of a force balance between fluid drag on the cell and matrix adhesion tension.
Results
Choice of Parameters
The computer model has been trained with data from the experimental observations in Refs. 35 and 36. We refer to Table 1 in Appendix B for information about the different parameters. However, in these works only 1D simulations were provided to assess to what extent the model could capture the in vitro experimental results of Refs. 30 and 26. The purpose of the computer simulations in the present work is to do an assessment of the tumor cell migration in an envisioned 2D tumor setting in a domain of size 1 cm × 1 cm (1 × 1 in dimensionless variables) where a realistic IF flow field is created due to leaky blood vessels sitting on the inside of the tumor margin and adsorbing lymphatics placed in the peritumoral region. As pointed out in the Introduction, there is a gap between the more homogeneous one-way fluid flow past a cluster of tumor cells in a microfluidic setting and the 2D tumor setting which we now intend to explore.
Table 1.
Model parameters (dimensional) in the model (2) with relevant reference values.
| Parameters | Description | Dimensional value |
|---|---|---|
| Reference variables | ||
| Time | s | |
| Length | m | |
| Velocity | ||
| Diffusion | ||
| Tumor cell density | 100 | |
| Fluid density | 1000 | |
| ECM density | 1 | |
| MDE | ||
| CCL21 | ||
| Pressure | ||
| Diffusion coefficients | ||
| MDE | ||
| CCL21 | ||
| Parameters of | ||
| Parameter characterizing (dependence on C) | ||
| Parameter characterizing | 0, 37500 | |
| Production/decay rates | ||
| Proliferation of tumor cells | ||
| Decay of tumor cells | ||
| Decay of tumor cells | ||
| Degradation of ECM | 10 | |
| Release/reconstruction of ECM | ||
| Release/reconstruction of ECM | 0 | |
| Release/reconstruction of ECM | ||
| Natural decay of MDE | ||
| Production by cells of MDE | ||
| Logistic term constant MDE | ||
| Related to logisitic function | 1 | |
| Proteolytically freed CCL21 | ||
| Logistic term constant CCL21 | ||
| Logistic term constant CCL21 | ||
| Cell consumption CCL21 | ||
| Related to logistic function | 0.2 | |
The main principles when we set parameters are:
-
(i)
First, we define the effective hydraulic conductivity through such that a realistic interstitial fluid pressure (IFP) is obtained with a corresponding relevant IF velocity . This choice automatically puts strong constraints on how the cell–ECM interaction in (11) should be set. If the cell–ECM resistance force is not sufficiently high (much higher than the fluid–ECM resistance force ), tumor cells will simply be pushed by the fluid flow in the downstream direction through the first term in (1), . Clearly, this would be inconsistent with the experimental observations in Refs. 30 and 26 that autologous chemotaxis is responsible for the downstream migration.35
-
(ii)
The window for choosing the cell–fluid parameters to prescribe in (11) is again fairly small as we need I to be negative in order to generate upstream migration in response to the stress from the fluid (see Ref. 36 for details).
-
(iii)
Finally, we must set parameters for such that diffusive cell spreading through in (1) is relatively weak, to be consistent with observations in Refs. 30 and 26. We have no specific data pertaining to the formation of chemokine gradients of the involved chemotactic migration as expressed by in (1). Hence, parameters related to the reaction terms on the right-hand-side of the transport-reaction system (2)2,3,4 are simply set such that a ”reasonable” large gradient in chemokine C is formed that can trigger a ”reasonable” strong chemotactic migration. This also determines the parameters in which is responsible for the autologeneous chemotactic migration. Most importantly, we do not vary any of these parameters for the different simulation cases.
The Potential Function and Cell–Cell Adhesion . The potential function given by (23) characterizes the chemotactic driven migration. The chemotaxis-related parameter is set to which is in the middle range of that used in Refs. 35 and 36 whereas . Regarding given by (22) we set Pa as default and use with .
Parameters of Fluid–ECM, Cell–ECM, and Fluid–Cell Interactions. We specify parameters involved in the interaction terms , , and in (11). Interstitial fluid flow is governed in large part by the hydraulic conductivity of the interstitial space, a measure of the resistance to fluid flow in porous and fibrous media. The higher the conductivity, the more easily fluid will move through the extravascular space of the tissue.37 We set , i.e., no special reduction in the cell–ECM and fluid–ECM resistance force during the cell migration process. We assume that the hydraulic conductivity associated with the cell aggregate microenvironment is of the order . This implies that
| 14 |
Here we have set the cell–ECM resistance force (how strongly the cells are attached to the ECM structure) to be a 200 fold larger than the fluid–ECM resistance force. We suggest the following set of parameters for the cell–fluid interaction term :
| 15 |
The importance of using a negative I lies in the fact that it signals upstream migration in response to the fluid-generates stress. This integrin-mediated migration against the fluid flow was carefully investigated in Ref. 36 and it was demonstrated that by appropriate choice of parameters (similar to what we use here), the resulting model could reproduce to a large extent the cell migration behavior reported in Ref. 26 where the sensitivity to IF velocity, tumor cell density, and CCR7 receptor availability was clearly demonstrated.
Functions that Characterise Strength of the Cell Velocity Components. The resulting function involved in the fluid stress related term (8) is showed in Fig. 1c for the choice of parameters as given by (14) and (15). The expression in (12)1 reflects that is sensitive to the fluid–cell interaction , as well as fluid–ECM and cell–ECM . Increasing trend of indicates that cells move in the flow direction whereas decreasing trend reflects upstream migration.
Parameters Related to Vascular Flow and Lymphatic Flow. The following values are used for parameters related to given by (27) (leaky blood vessels in the tumor):
| 16 |
whereas for the lymphatic flow given by (28), we set
| 17 |
When these values are used in combination with the tissue conductivity as set in (14), it gives rise to IF velocity around and IF pressure at the tumor periphery around Pa (i.e., around 20–30 mmHg) or (dimensionless). Intratumoral lymphatics are normally dysfunctional and thus, it is common to consider lymphatic flow to be negligible inside the tumor. In the simulations we have placed four circular lymphatic vessels on the outside of the circular tumor periphery, each with radius 0.05 (dimensionless). The vascular source term is placed in the central part of the tumor with a radius 0.15 (dimensionless). Note that corresponding cell velocity is normally approximately a 100-fold lower than consistent with reported results in Refs. 30 and 26.
Initial and Boundary Data. The initial primary tumor and the distribution of tumor cells are specified as
| 18 |
Initial chemokine and protease concentrations and are set to zero whereas the initial ECM concentration . IF boundary pressure atm. In the following we have set cell proliferation/apoptosis to be zero () in order to make the migration mechanisms more transparent.
Metastatic Behavior as a Result of Autologous Chemotaxis and Upstream Migration
Assuming that the cancer cells can generate both downstream (autologous chemotaxis) and upstream migration (integrin-mediated, non-chemical mechanism) consistent with in vitro experiments,30,26 one might wonder what is the net cell migration behavior in a more realistic tumor setting? To what extent are the tumor cells that move away from the tumor margin, driven by autologous chemotaxis, able to break loose from the primary tumor? We first consider a base case example which demonstrates characteristic cell migration as a function of the downstream and upstream mechanism accounted for in (7)–(10). Then we study how the tumor cell behavior will respond to (i) lower/higher IF velocity; (ii) changes in conductivity of the tumor microenvironment; (iii) blocking of CCR7 receptor.
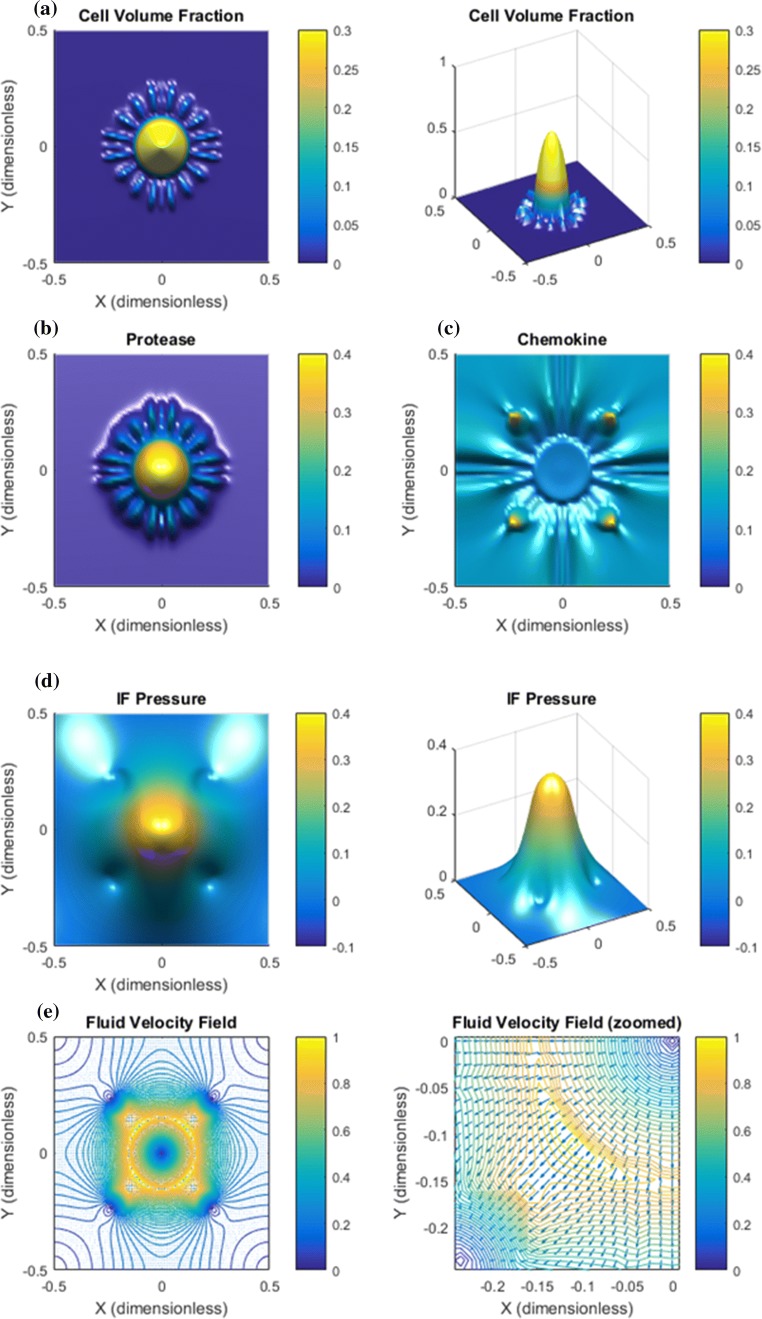
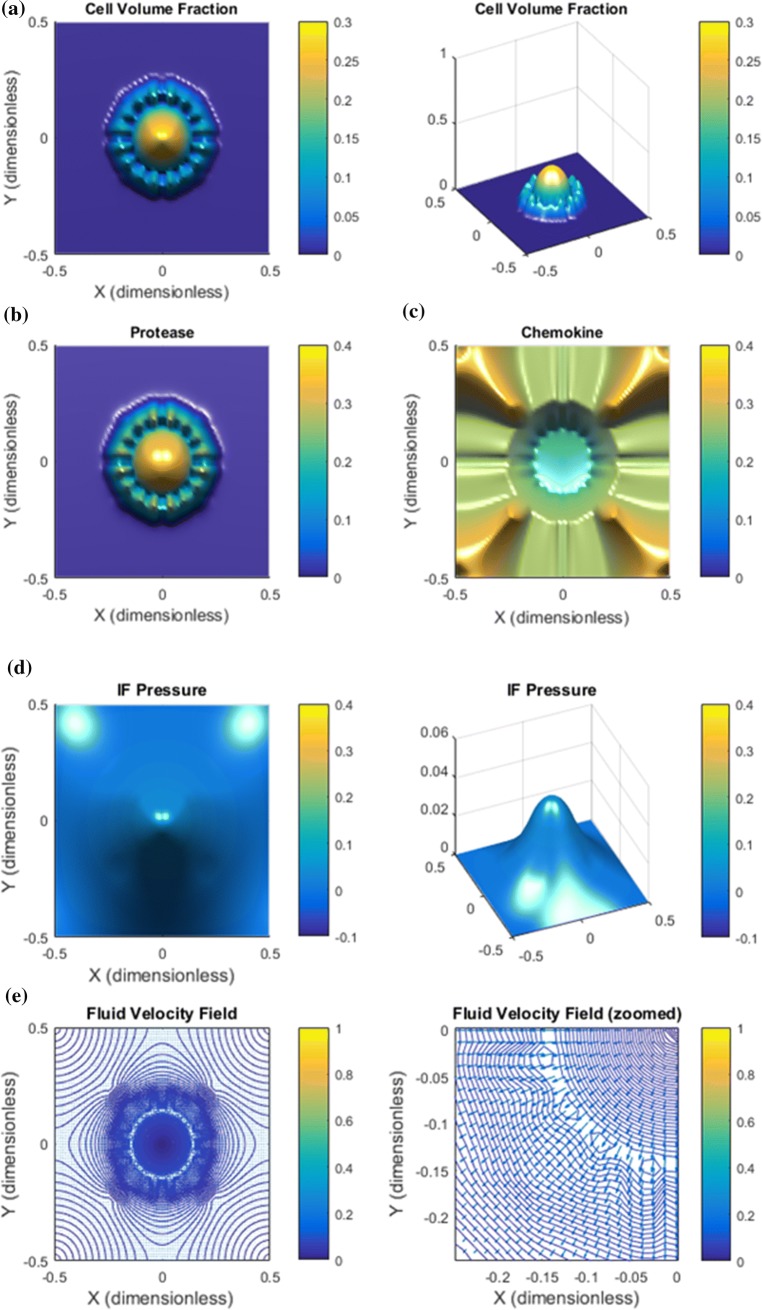
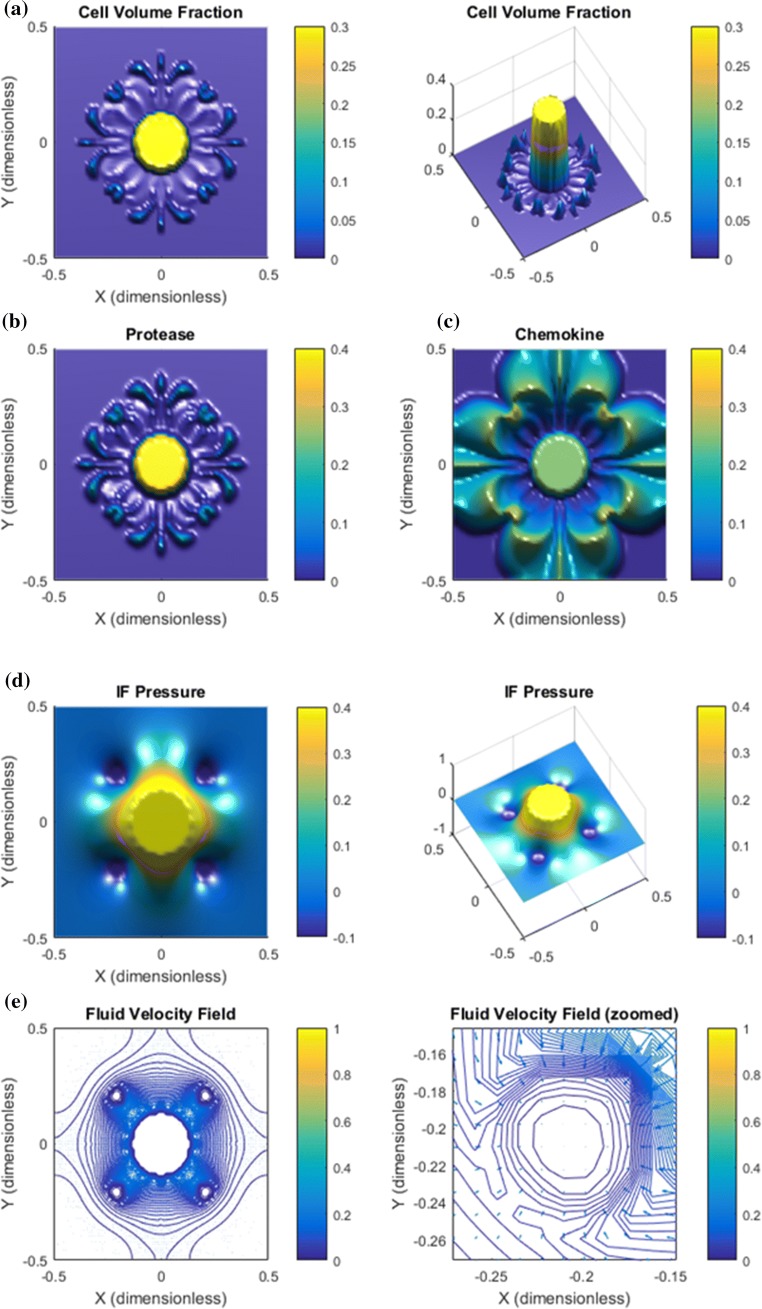
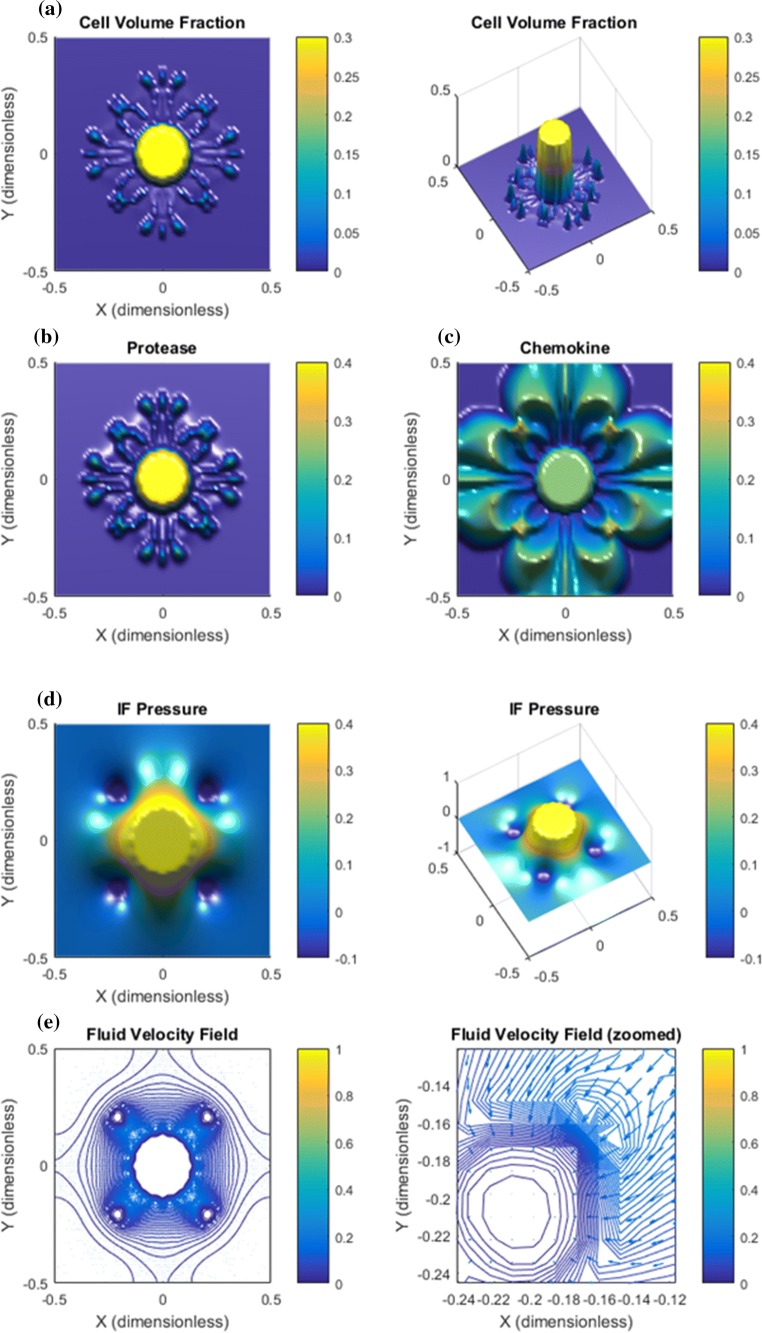
Base Case. Results are shown in Figs. 2, 3, and 4. Panel a in Fig. 2 shows that the downstream autologous chemotactic migration mechanism is able to develop small clusters of tumor cells (low cell volume fraction) that migrate in a finger-like pattern. The non-chemical upstream migration is not able to prevent this type of migration since it requires a certain volume fraction of tumor cells to work effectively, see Fig. 1c. Proteases are spread by the migrating tumor cells and the IF flow (Fig. 2b). Chemokine gradients are formed in the peritumoral region (Fig. 2c). The dissemination of chemokines is a consequence of the IF flow field shown in panel e of Fig. 2, whereas the corresponding IF pressure is illustrated in panel d and reflects a characteristic elevated pressure and rapid drop at the tumor periphery.
Figure 2.
Base case. The combination of autologous chemotaxis and upstream migration indicates ”metastatic” behavior. All variables are dimensionless according Table 1. The figures illustrate the net effect of autologous chemotaxis and upstream cell migration as expressed in (7), both of which are caused by the flow of IF from the tumor toward the peritumoral lymphatics. (a) Clusters of tumor cells migrate in a finger-like pattern. (b) Proteases are produced by the tumor cells and skewed in flow direction. (c) ECM-released chemokines are skewed in the flow direction. Higher concentration of chemokines are seen in the peritumoral region where the lymphatics are placed with an accumulation at the lymphatics. (d) The IF pressure (0.4 dimensionless corresponds to 4000 Pa = 30 mmHg) reflects a characteristic elevated pressure in the central part of the tumor with a rapid decrease at its rim. The position of the four lymphatics are seen from the plot of . (e) The IF velocity field (1.0 dimensionless 1 ) corresponds to the interstitial fluid pressure with a dominating outgoing fluid flow from the the tumor periphery toward the four lymphatics where it is adsorbed (while it is stagnant in the center of the core).
Figure 3.
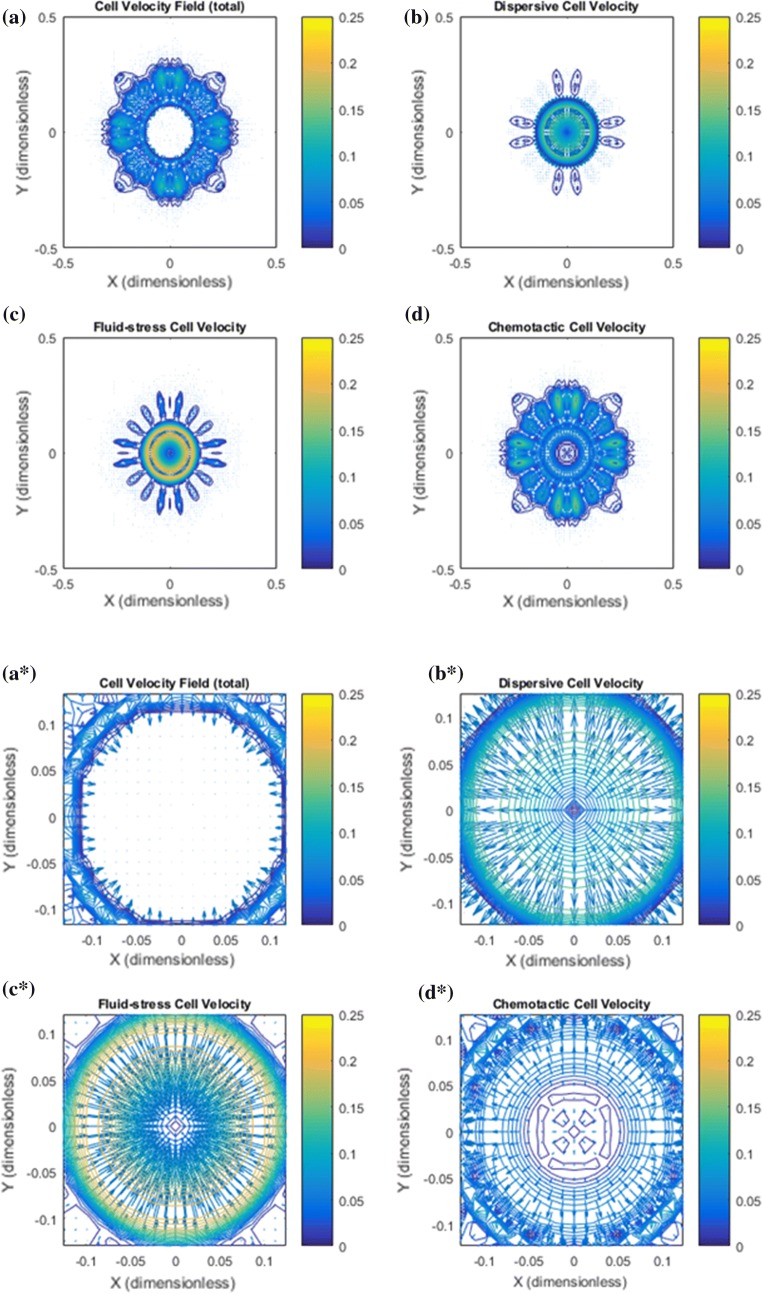
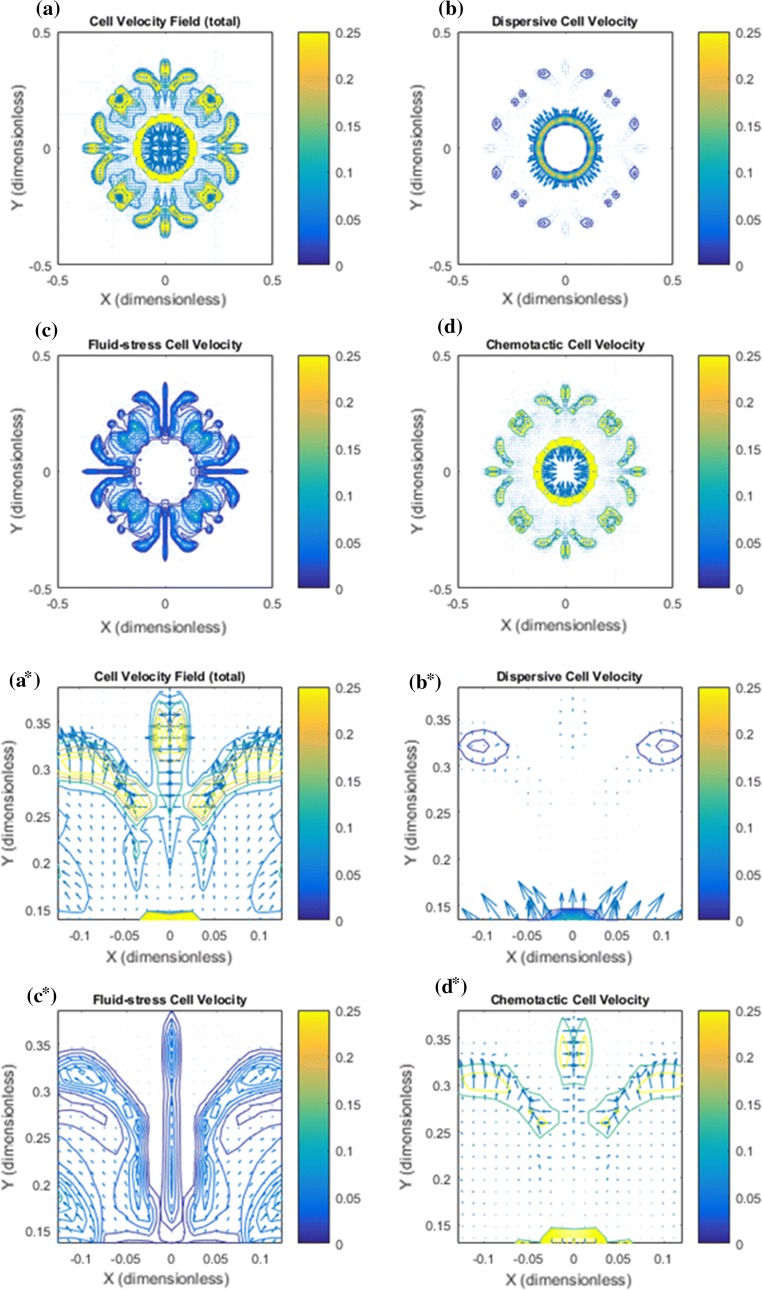
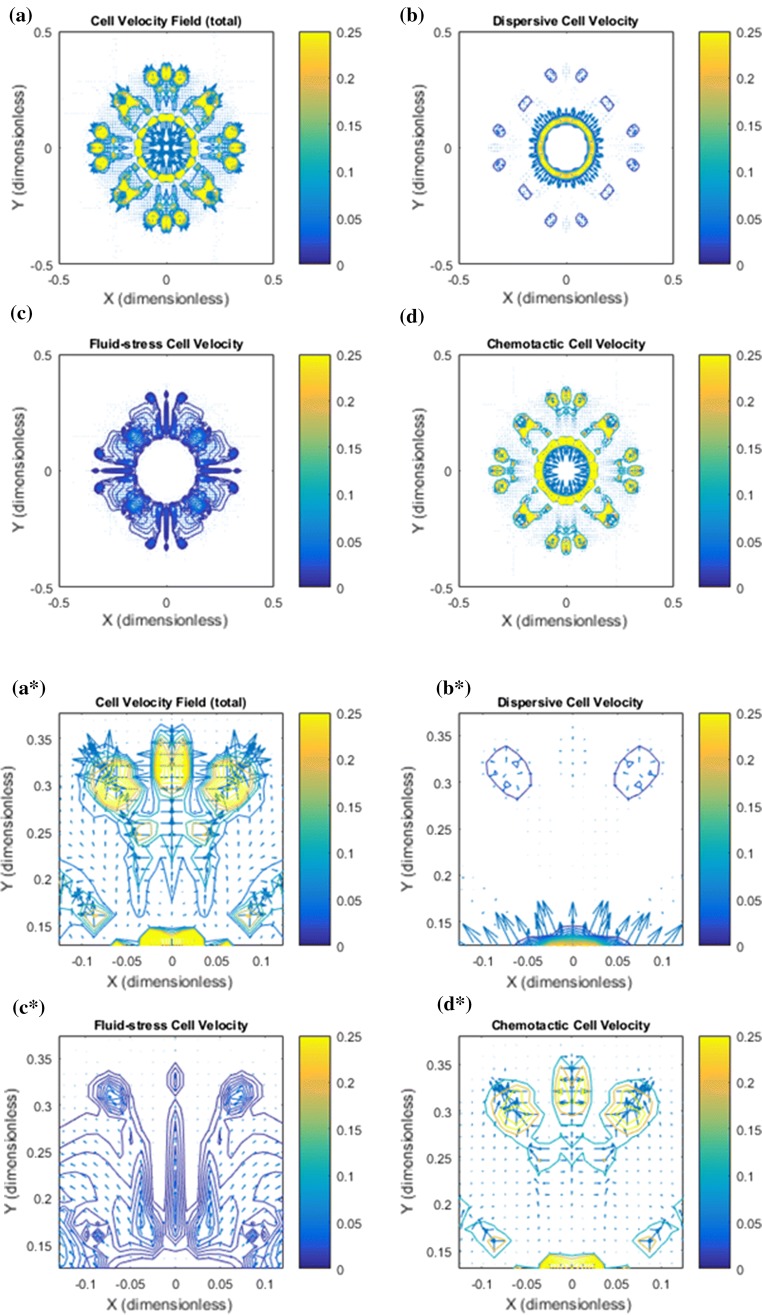
Base case: Illustration of the cell velocity components corresponding to the tumor cell migration shown in Fig. 2. Note that the dimensionless cell velocity has been been multiplied by 100 such that 0.25 amounts to 0.0025 . (a) shows the net cell velocity field given by (7). (b) The dispersive velocity component given by (9). (c) The fluid–stress generated cell velocity field given by (8). (d) The chemotactic cell velocity component given by (10). (a*) Zoomed version of (a). At the rim of the tumor there is dominating tumor cell migration inwardly directed against the fluid flow direction whereas there is no migration deeper into the tumor. (b*) Zoomed version of (b). An outwardly directed migration represented by is seen. (c*) Zoomed version of (c). Illustrates a dominant inwardly directed effect from . (d*) Zoomed version of (d). Illustrates that represents outward cell migration in the central part of the tumor which essentially is canceled by the velocity component in light of (a*)
Figure 4.
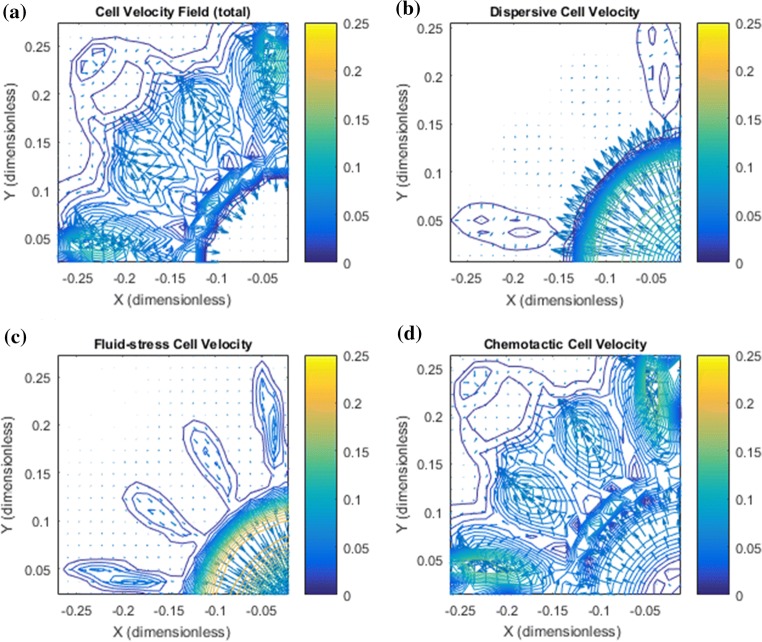
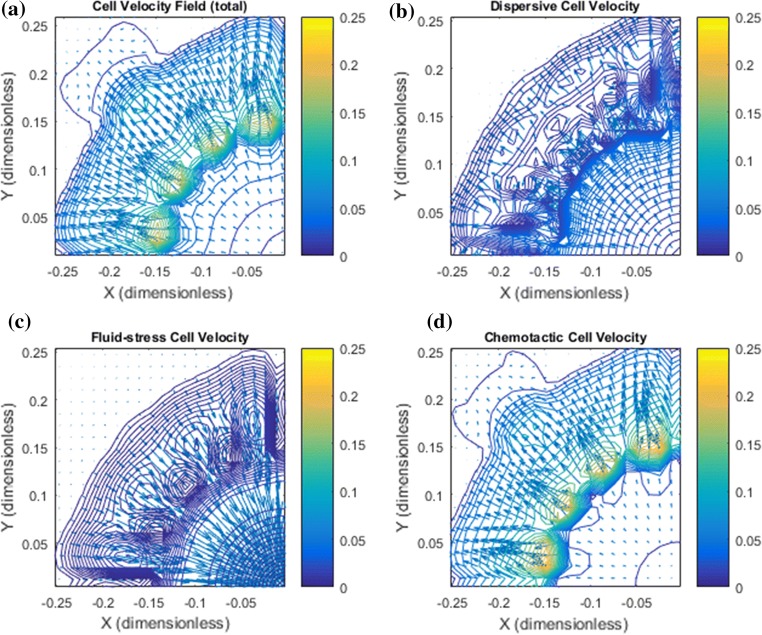
Base case: more details of the cell migration which takes place between primary tumor periphery and the lymphatic placed in the upper-left corner are shown. (a) The total cell velocity shows that in the peritumoral region there is a dominating downstream cell migration toward the lymphatic whereas close to the rim, tumor cells are guided back to the primary tumor which will keep it densely packed. (b) Dispersive cell velocity does not contribute outside the primary tumor. (c) Associated with the finger-like clusters of tumor cells there is a weak upstream migration that ensures that the cell volume fraction is kept low by driving tumor cells back to the primary tumor. The upstream migration represented by is weak in this region (since the cell volume fraction is very low) but has a dominating effect close to the tumor periphery where the cell volume fraction increases rapidly. (d) The chemotactic vell velocity component drives the downstream migration.
In Fig. 3 the net cell velocity is shown in panel a and a* with its different components (panel b and b*), (panel c and c*), and (panel d and d*). In Fig. 4 we have zoomed in to detect some finer details pertaining to the cell velocity components. In particular, panel d shows how tumor cells are triggered to move with the flow due to autologous chemotaxis. The upstream migration, which is dominating at the rim of the primary tumor, see panel c, ensures that the primary tumor remains densely packed. It seems that it is precisely the combination of this downstream and upstream migration reflected by the net cell velocity (panel a) that generates the finger-like growth pattern seen in Fig. 2a.
Simulation results for this case indicate that the chemotactic downstream migration and the non-chemical upstream migration can work together to give an effective metastatic type of cell migration in the sense that small clusters of tumor cells can break loose from the tumor. We may hypothesize that the upstream cell-migration is in fact used as a means to prevent that the number of following cells become too large. In order to test this, next we consider an example where the only change made is a reduced IF velocity by a factor of approximately 10. All other model parameters remain the same.
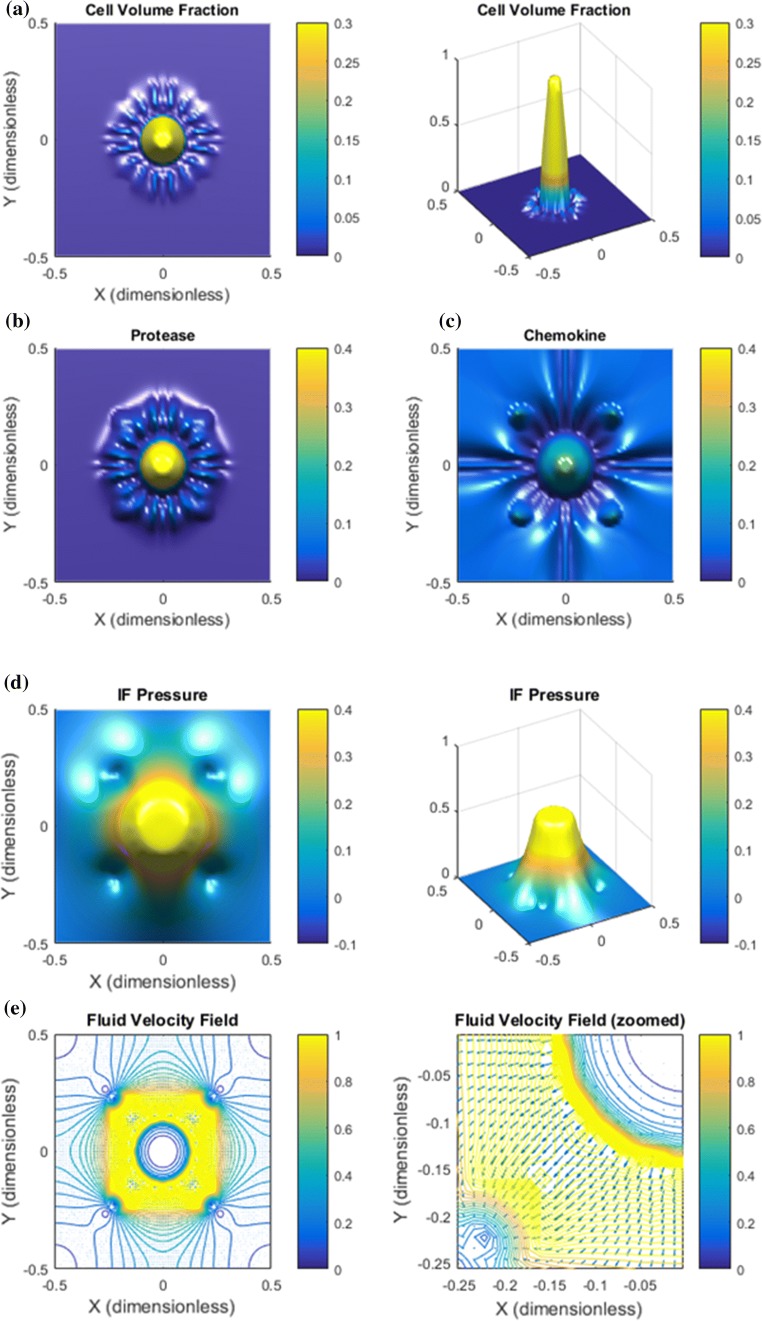
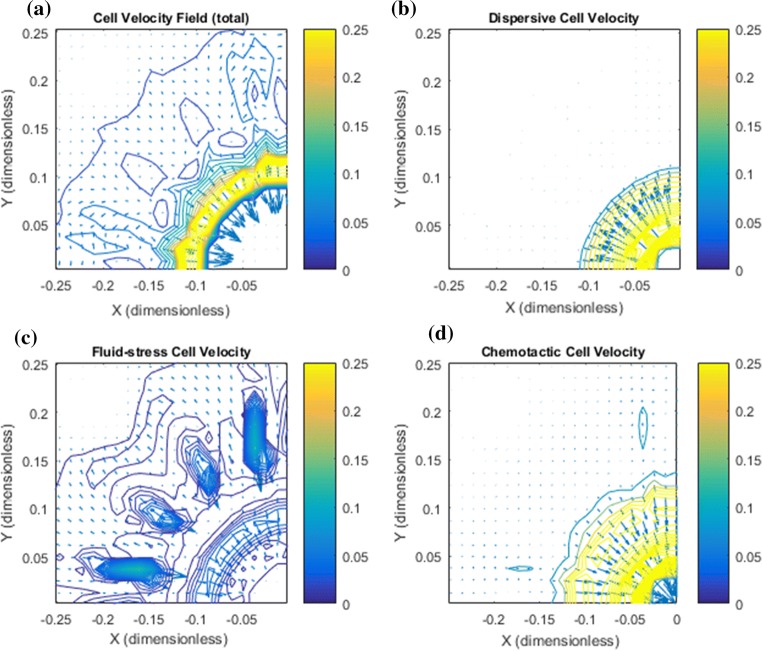
Low IF Velocity. We reduce the rate terms and in (16) and (17) by a factor 10 and the related pressures and by a factor 4. The purpose is to explore whether the chemotactic downstream migration is effective without a sufficiently strong upstream cell migration mechanism, i.e., a sufficiently high IF velocity . Results are shown in Figs. 5 and 6. The reduced IF pressure and corresponding low IF velocity is confirmed by Fig. 5, respectively, panel d and panel e. We observe that autologous chemotaxis itself is less aggressive, i.e., less cleaving of the downstream migrating front of tumor cells (Fig. 5a). The primary tumor itself is degraded as the tumor cells behind the leading front tend to follow after, see Fig. 5a (right plot). Figure 6 shows the corresponding cell velocity components. A main observation from panel c is that the upstream component now is very weak resulting in a dominant effect from the downstream component (compare panel a and d). In the absence of a strong upstream cell migration mechanism there is a collective downstream cell migration as seen in Fig. 5a driven by autologous chemotaxis (Fig. 6d) which is not able to cleave the group of cells into smaller clusters.
Figure 5.
Low IF velocity results in non-metastatic behavior. The IF has been reduced with a factor of more than 10 compared to the case in Fig. 2. (i) The tumor itself degenerates because there is no effective upstream cell migration mechanism; (ii) the outgoing tumor cells outside the rim of the tumor are not able to separate and form smaller clusters of cells which makes the cell migration space-demanding and less efficient as a tool for metastasis. (a) Tumor cell migration occurs in a homogenous spreading of a large wave of tumor cells at the rim and a corresponding loss of cells associated with the primary tumor. (b) Proteases essentially follow the tumor cell spreading. (c) Chemokine gradients are formed in the peritumoral region. (d) A low IF pressure is generated which results in a much lower (e) IF flow velocity (i.e., less then 0.1) compared to the base case in Fig. 2e.
Figure 6.
Low IF velocity results in non-metastatic behavior. The zoomed cell velocity field is similar to Fig. 4 but now with a much lower IF velocity. (a) Net cell velocity reflects a uniform, collective downstream migration that sets a large portion of the primary tumor in motion. (b) Cell velocity (9) which generates a spreading of tumor cells is small. (c) Cell velocity reflects upstream migration but is weak at tumor periphery (dark blue color) due to low IF velocity which largely dictates involved in (8). (d) The cell velocity component represented by (10) reflects a strong collective downstream migration at the tumor periphery.
High IF Velocity. We increase the rate terms and in (16) and (17) by a factor 10 and also increase the related pressures and by a factor 1.5. This corresponds to a situation with higher resistance to blood flow in the intratumoral vascular system and more leaky blood vessels, i.e., low resistance to transcapillary fluid. We expect that this increased IF velocity will augment the upstream migration effect through (8). What will be the combined effect of autologous chemotactic downstream migration and this enhanced upstream migration?
Results are shown in Figs. 7 and 8. A major observation is that the increased IF flow generates a more complete detachment of the clusters moving with the flow away from the solid tumor (Fig. 7a). A finer inspection of cell velocity components shown in Fig. 8 suggests that this is a result of the magnified upstream migration close to the tumor periphery (panel a) because the chemotaxis component (panel d) also contributes. In addition, as seen in Fig. 8c the cell velocity component also in fact helps the downstream migration for the small tumor cell clusters. This contribution is made visible for this example since the IF velocity , thereby also in (8), is much stronger than for the base case.
Figure 7.
High IF velocity results in enhanced metastatic behavior. (a) The main effect of increasing the IF flow is a stronger accumulation of tumor cells in the core combined with finger like migration pattern quite similar to that seen in Fig. 2a but with more distinct, slimmer fingers and in fact a full detachment of the outgoing clusters from the primary tumor. (b) Protease distribution. (c) The chemokine distribution shows that the high IF velocity leads to accumulation of some chemokines in the center of primary tumor, in addition to the peritumoral concentration gradients, which should then give rise to an additional chemotactic driven cell migration directed inwardly against the flow. (d) The higher vascular pressure gives rise to a higher and more distinct IF pressure profile compared to the base case Fig. 2d. (e) This results also in a considerably higher IF velocity at the tumor margin.
Figure 8.
High IF velocity results in enhanced metastatic behavior. (a) The net cell velocity has a strong upstream migration at the the rim of the primary tumor whereas at a certain distance away (at a “critical radius”) the tumor cells are guided outwardly. (b) Spreading due to dispersion. (c) The velocity component gives rise to some upstream migration at the primary tumor periphery. Note, however, that the same cell velocity component in fact also contributes to downstream migration of the small clusters that have broken loose. This must be understood in light of the positive slope of for very small cell volume fractions , see Fig. 1c. (d) The cell velocity due to autologous chemotaxis. The upstream migration is strong at the rim of the primary tumor due to the accumulation of chemokine in that region, see Fig. 7c.
Effect of a Dense ECM with Reduced Hydraulic Conductivity. It has been observed that increased level of interstitial fluid flow can effect the tissue conductivity (permeability). Interstitial flow imparts mechanical stresses on ECM fibers and cells embedded in the matrix, including shear stress and drag forces.37 Fibroblasts are responsible for maintaining and remodeling the ECM. High levels of IF flow can induce fibroblast motility through MMP-1 upregulation as well as drive myofibroblast differentiation and matrix alignment where the alignment is perpendicular to flow, rather than parallel, and thereby leading to a decrease in hydraulic conductivity.22,23,24 Motivated by this we address the following question:
What happens with the net effect of the downstream and upstream cell migration if we reduce the conductivity by a factor of 20 to mimic the effect of ECM remodelling and alignment mentioned above? Hence, we change from to to account for ECM remodelling and corresponding fiber alignment whereas we keep all other parameters as in base case. In particular, the strength of the chemotactic mechanism is kept unchanged as well as the cell–ECM interaction term . For this case we have increased the rate terms by a factor 20 and by a factor 4 as well as raised the intratumoral vascular pressure with a factor 1.5 in order to keep the IF velocity around 0.1 .
Simulation results are shown in Figs. 9 and 10. A considerable stronger detachment of small clusters is seen in panel a (Fig. 9). Compared to the base case in Fig. 2a, where the tumor cell migration is manifested in a finger like migration pattern, the clusters have completely broken loose from the primary tumor and are also cleaved internally to form several smaller clusters. The IF velocity shown in panel e (Fig. 9) appears to be reduced by a factor around 10 due to the stronger resistance force from the matrix whereas a large IF pressure gradient (panel d) is maintained at the rim of the primary tumor. The net cell velocity shown in Fig. 10a reveals a strong migration activity at the periphery of the primary tumor as well locally around the detached cell clusters. Most importantly, the net effect of the autologous chemoatxis component (panel d) and integrin-mediated fluid stress component (panel c) is a more aggressive tumor cell migration and cleaving of local clusters into smaller clusters that tend to migrate in the direction of the lymphatics. A plot of is shown in Fig. 11. The fact that the negative dip has been removed due to the change in explains why the cell velocity component does not give rise to upstream migration any longer. For further discussion of this case we refer to Appendix C.
Figure 9.
Dense ECM and reduced hydraulic conductivity gives increased detachment of clusters. (a) A direct consequence of reduced permeability is considerably more aggressive cell migration in the sense that clusters have effectively migrated with the flow and more completely broken loose from the primary tumor. (b) Protease distribution. (c) Chemokine gradients are formed at the rim of the primary tumor as well as further away in the peritumoral region. (d) The reduced permeabiliy (conductivity) gives rise to a higher IF pressure in the tumor region but (e) a lower IF velocity which now takes place more locally between tumor margin and nearby lymphatics.
Figure 10.
Dense ECM and reduced hydraulic conductivity gives increased detachment of clusters. There is a large heterogeneity seen in (a) showing total cell velocity with a dominating (upstream) cell migration at primary tumor periphery as well as a strong (downstream) migration taking place at the local tumor cell clusters that have been able to break loose from the initial tumor. (a*) (zoomed version of A where focus is on the upper cluster) reveals that there is a net cell velocity at the clusters that squeeze tumor cells toward each other making existing migratory pathways thinner as well as guiding them in the outward direction. (b, b*) Dispersive cell velocity . (c, c*) The fluid–stress component contributes mostly in the peritumoral region and is now a driving force for the outwardly directed migration and toward lymphatics. (d, d*) The chemotactic component contributes greatly both at the margin of the primary tumor to keep the primary tumor dense and at the local clusters by making them thinner and guiding them toward lymphactis.
Figure 11.
(a) Plot showing for the choice (11) with parameters as given in (14) and (15) except that instead of signaling a reduced tissue conductivity. This change in fluid–ECM resistance force implies that the net effect of the fluid–ECM, cell–ECM, and cell–fluid interactions as expressed by , , and (where the two latter are unchanged) removes the negative part of the fractional flow function . On, the other hand, a 20 fold reduction in conductivity also gives a corresponding reduction in total velocity such that the net effect on is adjusted correspondingly. (b) Plot showing for the choice (11) with parameters as given in (14) and (15) except that and . This adjustment of the cell–fluid interaction effect through is sufficient to maintain a net upstream cell migration through the cell velocity component . Zoomed version reveals a positive part reflecting downstream fluid–stress generated migration through for very small ().
Blocking of CCR7
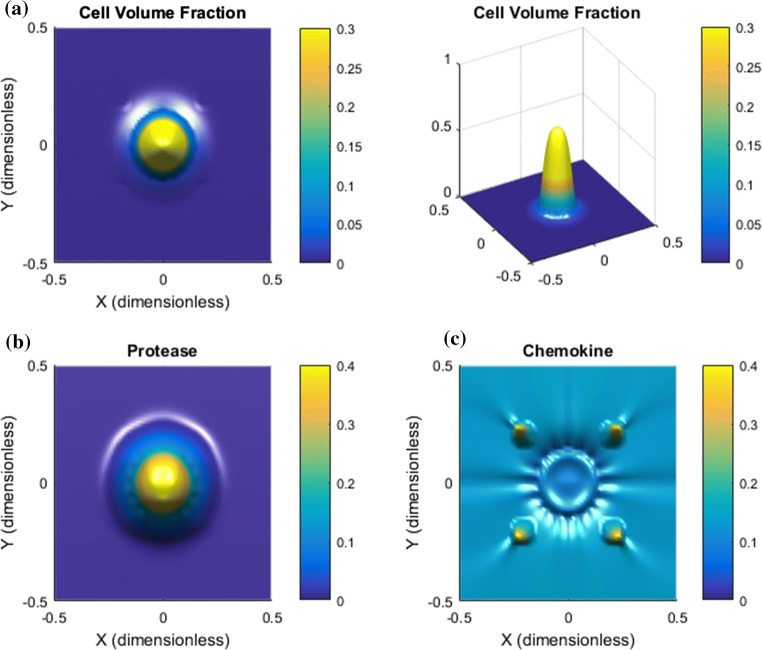
We consider the base case again but block the chemotaxis migration effect. The simulation output is shown in Fig. 12. The effect is dramatic. The heterogeneous cell migration driven by autologous chemotaxis comes to a halt. The spreading is much weaker and the growth pattern is uniform. The strain-induced migration in the upstream direction through (not shown) appears to completely dominate the tumor behavior leading to a slightly more densely packed tumor. The aggressive outgoing motion of small clusters of tumor cells is, as expected, not present at all.
Figure 12.
Blocking of CCR7: the case is the same as the base case shown in Fig. 2 but where to block the chemotactic migration. The effect is dramatic. (a) Cell volume fraction shows a slightly more densely packed primary tumor. (b) Protease distribution. (c) Chemokine distribution is similar to the base case in Fig. 2.
Discussion
A computational cell–fluid model has been trained with data previously reported in Refs. 30 and 26. It was shown how the model could capture the competition between the downstream and upstream tumor cell migration in a simplified homogenous environment with fluid flow across a cell cluster from a high to a low pressure region.35,36 However, it appears to be an open question what happens if these two competing migration mechanisms are present in a higher dimensional tumor setting with a more heterogeneous IF velocity field which is defined by the drainage from a leaky vascular system and adsorbing lymphatics. In this work we have extended the model to a two-dimensional tumor setting with a more realistic IF velocity field. The simulations have demonstrated how tumor cells can generate detachment of clusters of tumor cells from the primary tumor by combining two different in vitro experimental observed cell migration mechanisms. Both migration mechanisms are regulated by the interstitial fluid flow: (i) autologous chemotaxis which generates migration towards positive gradients in chemokine30; (ii) integrin-mediated migration mechanism generated by fluid–stress.26 These two migration mechanisms are present in the explicit expression for the cell velocity given by (7), (8) and (10). The nature of these two direction-specific migration mechanisms are different. The first depends essentially on biochemical cues through the signaling protein gradient expressed in (10). The other essentially on mechanical cues in the microenvironment expressed through the interaction terms , , and that define the fractional flow function appearing in (8). Moreover, we have made the following more detailed observations:
For a given tissue conductivity (i.e., with a corresponding fluid–ECM resistance force ), the model illustrates precisely how tumor cells, by manipulating the strength of the cell–ECM interaction and the direction and magnitude of the cell–fluid interaction term , are able to control the two migration mechanisms such that autologous chemotaxis guides tumors cells at the tumor periphery away from the primary tumor whereas the fluid–stress generated migration guides tumor cells upstream keeping the primary tumor coherent and dense. The net effect of these two mechanisms is formation of small finger-like clusters of tumor cells that have the potential to detach from the primary tumor.
By reducing the hydraulic conductivity in the microenvironment in the peritumoral region, e.g., caused by realignment of fibers in ECM,22,23 the fluid–stress related migration changed direction. This aided small clusters of tumor cells to more effectively escape from the primary tumor. The autologous chemotactic-driven migration added a new role by also guiding tumor cells at the tumor periphery in the upstream direction due to a local accumulation of chemokines in that region which maintained the high density of the primary tumor.
We are not aware of published work where the combination of the upstream and downstream migration26 has been observed for in vivo tumors. However, a clear correlation between high IF velocity (and corresponding high IFP) and dissemination of tumor cells to nearby lymphatics has been reported.11 Using mouse xenograft models of several types of human cancer in combination with dynamic contrast enhanced MRI (DCE-MRI), a high-signal-intensity rim was observed in the tumor periphery, which moved outward with time. Significant positive correlations were found between high IF velocity and elevated IFP in all tumor xenografts. Moreover, the primary tumors of metastasis-positive mice displayed higher IFP and IF velocity at the rim than the primary tumors of metastasis-negative mice. Findings were confirmed in cervical cancer patients with pelvic lymph node metastases, where the IF velocity was found to be higher compared with patients without lymph node involvement. A similar result was also reported in Ref. 32. Thus, the simulations presented in this work appear to be in line with these findings. The proposed computational model might serve as a tool for bridging the gap between in vitro results by means of advanced microfluidic flow systems26,30 and in vivo results.11,32 The model can illustrate more details pertaining to metastatic dissemination and help formulating new hypotheses why tumor cells seem to behave more aggressively in the presence of a strong IF velocity field. The model observation that reduced hydraulic conductivity revealed more aggressive directional tumor cell invasion may be linked to the experimental finding that matrix stiffness seems to play an important role in tumor evolution and metastasis. Matrix realignment has been associated with reduced conductivity and increased stiffness.22,23,24 In particular, increased matrix stiffness has been reported to promote more directional and well-orchestrated migration behavior at the tumor margin.31 This result also appears to be in line with the findings that linearized thick collagen fibers perpendicular to the tumor boundary is associated with a higher propensity for progression to invasive breast cancer.1
Metastatic Behavior Vs. EMT
A fundamental issue which has not been accounted for in the above investigations of the model is the role played by EMT (Epithelial-Mesenchymal Transition). Transformation of tumor cells to an aggressive and migratory phenotype is considered to be a key step leading to dissemination of cancer cells in the body.10,18 During EMT, cells lose their epithelial characteristics and acquire mesenchymal characteristics, such as adherens junctions and apical-basal polarity, and the ability to migrate. Even though EMT is considered an important mode of invasion, its precise role in primary tumor behavior is not fully understood. Some recent publications indicate that metastatic dissemination of carcinomas can occur without full activation of the EMT programme7,40 and it has been suggested that collective migration could contribute to cancer spread.5,8,14 In addition, most primary tumor cells are involved in collective migration, in clusters or as large sheets of cells, rather than single cell migration. Hence, as one of the hallmarks of EMT is individual cell migration, it might not be necessary for carcinoma cell dissemination.17 In other recent work patient specimens were collected to explore fundamental mechanisms of metastatic dissemination of colorectal cancer.39 The investigations showed that collective behavior predominates and gave rise to spreading of clusters of tumor cells possessing a robust epithelial organization when studied in peritoneal microenvironment. This raises the question of whether collective migration represents an alternative to EMT. Can collective invasion occur if activation of EMT programs is totally blocked?17
The results of the present manuscript may help to illustrate in what way ”aggressive” behavior can occur as a result of a fine-tuned balance between cell–ECM and cell–fluid interaction force terms (i.e., mechanical cues) and various stress-related terms, as formulated in the general momentum balance equation of (19)3,4 combined with biochemical signals from the microenvironment as represented by (19)5,6,7. EMT in terms of a detailed microscopic description of a fundamental change in cell–cell interaction is obviously not accounted for in the macroscopic model explored in this work. On the other hand, EMT is associated with increased tumor cell motility, which is explicitly accounted for through the correlation for given by (11) whose parameters could be controlled in accordance with an EMT-related programme. Even for fixed parameters, simulation outputs show that cohorts of cells can break loose if a proper balance between a downstream and upstream migration mechanism is ensured. This naturally raises the question: How “much” EMT is needed for metastatic dissemination of cohorts of tumor cells? To what extent are EMT characteristics already in place in the proposed model (19) since it has an ability to describe detachment of clusters of tumor cells? Does the integrin-mediated upstream migration require the EMT programme to be activated? Such questions suggest an interaction between development of computational models and further evaluation in light of experimental results where the force interactions between tumor cells and ECM and the concomitant effects of stromal and immune cell types can be accessed by finely tuning the biomaterials encapsulating these cell types in 3D.13,19
Acknowlegments
We are grateful for highly instructive comments from the anonymous reviewers that helped improving certain parts of a first version of this manuscript. We also thank Tia R. Tidwell for useful input.
Conflict of interest
Steinar Evje and Jahn Otto Waldeland declare that they have no conflicts of interest.
Ethical approval
This article does not contain any studies with human participants or animals performed by any of the authors.
Appendix A: A Swartz–Kamm Model
The cell–fluid two-phase model we are interested in takes the following form (we refer to Refs. 3, 4, 6, 15, 28, 34, 35, and 36 for details):
| 19 |
where for . The above model must be combined with the closure relation
| 20 |
and appropriate pressure-density closure relations , . We implicitly treat the cell phase as a fluid like phase but where we add cell-specific features to the momentum Eq. (19)3 by letting the cell phase pressure feel additional stress due to cell–cell interaction and migration-related stress due to chemotaxis through the relation
| 21 |
This means that the stress associated with the cancer cells differs from the IF pressure because of the cell–cell stress term and the chemotaxis stress term . Similar to Ref. 6 we use
| 22 |
Herein, is a coefficient (unit Pa) that depends linearly on the surface tension (unit Pa m) whereas is a monotonic decreasing dimensionless function with respect to the fluid volume fraction . The ability of the cancer cells to generate a force is expressed through the potential function
| 23 |
where are constant parameters with units, respectively, as and .
There is a drag force (that acts opposite of the direction of movement of the fluid) between the extracellular fluid represented by the fluid velocity and the ECM structure (fibers). We use the following expression for this force (motivated by general multiphase flow modeling)
| 24 |
with and K is the permeability of the porous media and the fluid viscosity. Similarly, there is a drag force between the cells and the ECM (fibers) that acts opposite of the direction of the movement of the cells represented by the cell fluid velocity ,
| 25 |
where (), and must be specified (the two last are dimensionless).
Finally, there is also a drag force between the cell phase and the fluid which is caused by pressure (isotropic) and shear stress forces on the surface of the cell phase. This effect is accounted for through the term , see (19) where
| 26 |
where I () remains to be determined as well as the dimensionless and coefficient .
Lymphatic flow is an important component of the circulation. In nearly all tissues, plasma leaks out of blood capillaries, flows through the interstitium and drains into lymphatic vessels, where it passes through lymph nodes before being returned to the venous blood.16 This circulation is expressed in the right hand side of (19)2 through the source terms . The driving forces for interstitial flow are hydrostatic and osmotic pressure gradients between the vascular and interstitial space. Starling’s Law is used for the flow of fluid in the interstitium given by
| 27 |
with . Here is the hydraulic conductivity () of the vessel wall, ( the exchange area of blood vessels per unit volume of tissues V, and the vascular and interstitial fluid pressure, and the osmotic pressure in the vascular and interstitial space and the osmotic reflection coefficient for plasma proteins.
The lymphatic network drains excessive fluid from the interstitial space and returns it back to the blood circulation, as expressed by . By doing so, it regulates the fluid balance in tissues and prevents formation of edema. Tumor lymphatics have two characteristics, common in many cancers. They are not functional in the intratumoral region, and they are hyperplastic and exhibit increased flow at the periphery.16 The loss of functionality is attributed to compressive solid stress that is developed in tumors. This stress has been shown to collapse intratumoral lymphatic vessels, and thus eliminates lymph flow. Similar to (27) we use an expression of the following form to express the fluid adsorption through lymphatics
| 28 |
Here is the hydraulic conductivity of the lymphatic vessel walls whereas is the surface area of the lymphatic vessel per volume unit of tissues V and is the effective lymphatic pressure.
Rewritten Form of the Swartz–Kamm Model
We rewrite the model (19) to make it more transparent. In particular, we can obtain explicit expressions for cell velocity and IF velocity . Following35,36 we assume incompressible fluids (cell population and fluid). From (19), after we have made it dimensionless (see Ref. 35 for details) and also used (21)
| 29 |
with for . The model is combined with the boundary condition
where is the outward normal on and is a known pressure. The corresponding initial data are given by (6). Referring to Appendix A (see also Ref. 35 for details) we find the cell velocity as well as the IF velocity expressed as
| 30 |
with fractional flow functions and , respectively, for the cell and fluid phase given by
| 31 |
where the coefficients , , and (so-called mobility functions38) are given as follows:
| 32 |
and
| 33 |
Expressions for Cell Velocity and IF Velocity
We can write the momentum balance Eq. (29)3,4 as
| 34 |
We can solve for and from this 2 × 2 linear system and find that
| 35 |
Hence, the corresponding Darcy velocities and are given by (also often referred to as superficial velocity)
| 36 |
with generalized mobility functions of the form (32) and and total mobility given by (33). Summing the two mass balance Eq. (29)1,2 and making use of (20), we find the following equation
| 37 |
From (36), it follows after a summation that
| 38 |
By taking the divergence () of (38) and referring to (37), we then arrive at
| 39 |
This gives an elliptic equation for that can be solved subject to the boundary condition . This in turn allows us to compute from (38).
Elimination of Explicit Dependence on IF Pressure
Next, we observe that we have the following expression for [in view of (38)]
| 40 |
Combining this with (36) we can derive expressions for the fluid velocities and as follows:
| 41 |
where we use the expressions (32) and (33) in combination with some algebraic manipulations, and where we have defined , and as follows:
| 42 |
Similarly, for we find
| 43 |
This amounts to, expressed in terms of interstitial velocity and , relations of the form
| 44 |
Appendix B: Model Input Data
We refer to Table 1 for the model input data that is used in this work and which are based on the investigations in Refs. 35 and 36.
Appendix C: Supplementary Simulation
Base Case with the Effect of a Denser ECM with Reduced Conductivity Secondly, we also want to test the model prediction when we take into consideration that the tumor cells sense the increased fluid–ECM resistance force through the change of , which leads to a stronger fluid imposed stress on the tumor cells, and respond to it by doing an adjustment such that the fluid–stress term can resist this stronger stress from the flowing fluid and also go in the upstream migration. More precisely, we make an adjustment of in (15) regulating the cell–fluid interaction by changing it from to . The effect of this adjustment is a fractional flow function as shown in Fig. 11b which again contains a large negative dip signaling upstream migration. However, as for the base case it also contains a positive part for sufficiently small volume fractions that will guide tumor cells in the flow direction.
Simulation results are shown in Figs. 13 and 14. Comparing Figs. 9a and 13a, it is observed that in the latter case the tumor cells can go towards chemokine gradients more independent of the relatively strong fluid flow towards the lymphatics (see panel e). In the first case (panel a, Fig. 9) the tumor clusters tend to be guided towards the lymphatics driven by both the and velocity component. For example, the upmost cluster is split into three clusters where two of them will bend towards nearby lymphatics consistent with a corresponding IF flow field. This is not seen for the same cluster in Fig. 13a. The corresponding cell velocity seen, respectively, in Fig. 10a and Fig. 14a also reflects this difference. Another difference is that the clusters reflected by Fig. 13a that migrate toward the lymphatics, respectively, in the northwest, northeast, southeast, and southwest direction tend to generate a tail that almost connects with the primary tumor. We attribute this behavior to the fluid–stress component which can give rise to upstream migration if the cell volume fraction is larger than 0.035 as reflected by Fig. 11b. See Figs. 14c and 14c*, for an example of this.
Figure 13.
Dense ECM and reduced hydraulic conductivity gives increased detachment of clusters. The same case as in Fig. 9 but where we have accounted for tumor cell sensitivity to the reduced conductivity by also increasing cell–fluid interaction setting . This gives rise to upstream migration generated by fluid stress through as reflected by the negative dip of in Fig. 11b. (a) Cell volume fraction. (b) Protease distribution. (c) Chemokine distribution. (d) IF pressure . (e) IF velocity .
Figure 14.
Dense ECM and reduced hydraulic conductivity gives increased detachment of clusters. (a, a*) Net cell velocity . (b, b*) Dispersive cell velocity . (c, c*) The fluid–stress component contributes mostly in the peritumoral region and is a driving force for the outwardly directed migration but gives rise to upstream migration when is sufficiently large, see left and right cluster in c* . (d, d*) The chemotactic component contributes greatly both at the margin of the primary tumor and at the local clusters.
Contributor Information
Steinar Evje, Email: steinar.evje@uis.no.
Jahn Otto Waldeland, Email: jahn.waldeland@uis.no.
References
- 1.Acerbi, I., L. Cassereau, I. Dean, Q. Shi, A. Au, C. Park, Y. Y. Chen, J. Liphardt, E.S. Hwang, and V. M. Weaver. Human breast cancer invasion and aggression correlates with ECM stiffening and immune cell infiltration. Integr. Biol. 7(10):1120–1134, 2015. [DOI] [PMC free article] [PubMed]
- 2.Bear J. Modeling Phenomena of Flow and Transport in Porous Media, Theory and Applications of Transport in Porous Media. Irvine, CA: Interpore; 2018. [Google Scholar]
- 3.Breward CJW, Byrne HM, Lewis CE. The role of cell–cell interactions in a two-phase model for avascular tumour growth. J. Math. Biol. 2002;45:125–152. doi: 10.1007/s002850200149. [DOI] [PubMed] [Google Scholar]
- 4.Byrne HM, Owen MR. A new interpretation of the Keller–Segel model based on multiphase modelling. J. Math. Biol. 2004;49:604–626. doi: 10.1007/s00285-004-0276-4. [DOI] [PubMed] [Google Scholar]
- 5.Cheung KJ, et al. Collective invasion in breast cancer requires a conserved basal epithelial program. Cell. 2013;155(7):1639–1651. doi: 10.1016/j.cell.2013.11.029. [DOI] [PMC free article] [PubMed] [Google Scholar]
- 6.Evje S. An integrative multiphase model for cancer cell migration under influence of physical cues from the microenvironment. Chem. Eng. Sci. 2017;165:240–259. doi: 10.1016/j.ces.2017.02.045. [DOI] [Google Scholar]
- 7.Fischer, K. R. et al. Epithelial-to-mesenchymal transition is not required for lung metastasis but contributes to chemoresistance. Nature 527:472, 2015. [DOI] [PMC free article] [PubMed]
- 8.Friedl P, et al. Classifying collective cancer cell invasion. Nat. Cell. Biol. 2012;14:777–783. doi: 10.1038/ncb2548. [DOI] [PubMed] [Google Scholar]
- 9.Haessler U, Teo JC, Foretay D, Renaud P, Swartz MA. Migration dynamics of breast cancer cells in a tunable 3D interstitial flow chamber. Integr Biol. 2012;4:401–409. doi: 10.1039/c1ib00128k. [DOI] [PubMed] [Google Scholar]
- 10.Hanahan D, Weinberg RA. The hallmarks of cancer. Cell. 2000;100:57–70. doi: 10.1016/S0092-8674(00)81683-9. [DOI] [PubMed] [Google Scholar]
- 11.Hompland T, Ellingsen C, Ovrebo KM, Rofstad EK. Interstitial fluid pressure and associated lymph node metastasis revealed in tumors by dynamic contrast-enhanced MRI. Cancer Res. 2012;72(19):4899–4908. doi: 10.1158/0008-5472.CAN-12-0903. [DOI] [PubMed] [Google Scholar]
- 12.Huang YL, Tung C-K, Zheng A, Kim BJ, Wu M. Interstitial flows promote an amoeboid over mesenchymal motility of breast cancer cells revealed by a three dimensional microfluidic model. Integr. Biol. 2015;7(11):1402–1411. doi: 10.1039/C5IB00115C. [DOI] [PMC free article] [PubMed] [Google Scholar]
- 13.Huang, Y. L., J. E. Segall, and M. M. Wu. Microfluidic modeling of the biophysical microenvironment in tumor cell invasion. Lab. Chip 17:3221–3233, 2017. [DOI] [PMC free article] [PubMed]
- 14.Ilina O, Friedl P. Mechanisms of collective cell migration at a glance. J. Cell Sci. 2009;122:3203–3208. doi: 10.1242/jcs.036525. [DOI] [PubMed] [Google Scholar]
- 15.Jackson TL, Byrne HM. A mechanical model of tumor encapsulation and transcapsular spread. Math. Biosci. 2002;180:307–328. doi: 10.1016/S0025-5564(02)00118-9. [DOI] [PubMed] [Google Scholar]
- 16.Jain KJ, Martin JD, Stylianopoulos T. The role of mechanical forces in tumor growth and therapy. Annu. Rev. Biomed. Eng. 2014;16:321–346. doi: 10.1146/annurev-bioeng-071813-105259. [DOI] [PMC free article] [PubMed] [Google Scholar]
- 17.Lambert AW, et al. Emerging biological principles of metastasis. Cell. 2017;168:168–233. doi: 10.1016/j.cell.2016.11.037. [DOI] [PMC free article] [PubMed] [Google Scholar]
- 18.Lazebnik Y. What are the hallmarks of cancer? Nat. Rev. Cancer. 2010;10(4):232–233. doi: 10.1038/nrc2827. [DOI] [PubMed] [Google Scholar]
- 19.Malandrino A, Kamm RD, Moeendarbary E. In vitro modeling of mechanics in cancer metastasis. ACS Biomater. Sci. Eng. 2018;4(2):294–301. doi: 10.1021/acsbiomaterials.7b00041. [DOI] [PMC free article] [PubMed] [Google Scholar]
- 20.Munson JM, Bellamkonda RV, Swartz MA. Interstitial flow in a 3D microenvironment increases glioma invasion by a CXCR4-dependent mechanism. Cancer Res. 2013;73(5):1536–1546. doi: 10.1158/0008-5472.CAN-12-2838. [DOI] [PubMed] [Google Scholar]
- 21.Nathanson SD. Insights into the mechanisms of lymph node metastasis. Cancer. 2003;98:413–423. doi: 10.1002/cncr.11464. [DOI] [PubMed] [Google Scholar]
- 22.Ng CP, Swartz MA. Fibroblast alignment under interstitial fluid flow using a novel 3-D tissue culture model. Am. J. Physiol. Heart Circ. Physiol. 2003;284:1771–1777. doi: 10.1152/ajpheart.01008.2002. [DOI] [PubMed] [Google Scholar]
- 23.Ng CP, Swartz MA. Mechanisms of interstitial flow-induced remodeling of fibroblastcollagen cultures. Ann. Biomed. Eng. 2006;34:446–454. doi: 10.1007/s10439-005-9067-3. [DOI] [PubMed] [Google Scholar]
- 24.Pedersen JA, Lichter S, Swartz M. Cells in 3D matrices under interstitial flow: effects of extracellular matrix alignment on cell shear stress and drag forces. J. Biomech. 2010;43:900–905. doi: 10.1016/j.jbiomech.2009.11.007. [DOI] [PubMed] [Google Scholar]
- 25.Piotrowski-Daspit AS, Tien J, Nelson CM. Interstitial fluid pressure regulates collective invasion in engineered human breast tumors via Snail, vimentin, and E-cadherin. Integr Biol. 2016;8:319–331. doi: 10.1039/c5ib00282f. [DOI] [PMC free article] [PubMed] [Google Scholar]
- 26.Polacheck WJ, Charest JL, Kamm RD. Interstitial flow influences direction of tumor cell migration through competing mechanisms. PNAS. 2011;108:11115–11120. doi: 10.1073/pnas.1103581108. [DOI] [PMC free article] [PubMed] [Google Scholar]
- 27.Polacheck WJ, German AE, Mammoto AE, Ingber DE, Kamm RD. Mechanotransduction of fluid stresses governs 3D cell migration. PNAS. 2014;111:2447–2452. doi: 10.1073/pnas.1316848111. [DOI] [PMC free article] [PubMed] [Google Scholar]
- 28.Rajagopal, K. R., and L. Tao. Mechanics of mixtures, Series on Advances in Mathematics for Applied Sciences, vol. 35, 1995.
- 29.Shieh, A.C., H.A. Rozansky, B. Hinz, and M.A. Swartz. Tumor cell invasion is promoted by interstitial flow-induced matrix priming by stromal fibroblasts. Cancer Res. 71(3):790–800, 2011. [DOI] [PubMed]
- 30.Shields JD, Fleury ME, Yong C, Tomei AA, Gwendalyn JR, Swartz MA. Autologous chemotaxis as a mechanism of tumor cell homing to lymphatics via interstitial flow and autocrine CCR7 signaling. Cancer Cell. 2007;11:526–538. doi: 10.1016/j.ccr.2007.04.020. [DOI] [PubMed] [Google Scholar]
- 31.Shukla VC, Higuita-Castro N, Nana-Sinkam P, Ghadiali SN. Substrate stiffness modulates lung cancer cell migration but not epithelial to mesenchymal transition. J. Biomed. Mater. Res. A. 2016;104(5):1182–1193. doi: 10.1002/jbm.a.35655. [DOI] [PubMed] [Google Scholar]
- 32.Simonsen TG, Lund KV, Hompland T, Kristensen GB, Rofstad EK. DCE-MRI-derived measures of tumor hypoxia and interstitial fluid pressure predict outcomes in cervical carcinoma. Int. J. Radiat. Oncol. Biol. Phys. 2018;102(4):1193–1201. doi: 10.1016/j.ijrobp.2018.04.035. [DOI] [PubMed] [Google Scholar]
- 33.Tien J, Truslow JG, Nelson CM. Modulation of invasive phenotype by interstitial pressure-driven convection in aggregates of human breast cancer cells. Plos One. 2012;7:1–8. doi: 10.1371/journal.pone.0045191. [DOI] [PMC free article] [PubMed] [Google Scholar]
- 34.Urdal J, Waldeland JO, Evje S. Enhanced cancer cell invasion caused by fibroblasts when fluid flow is present. Biomech. Model Mechanobiol. 2019 doi: 10.1007/s10237-019-01128-2. [DOI] [PubMed] [Google Scholar]
- 35.Waldeland JO, Evje S. A multiphase model for exploring cancer cell migration driven by autologous chemotaxis. Chem. Eng. Sci. 2018;191:268–287. doi: 10.1016/j.ces.2018.06.076. [DOI] [Google Scholar]
- 36.Waldeland, J. O. and S. Evje. Competing tumor cell migration mechanisms caused by interstitial fluid flow. J. Biomech.10.1016/j.jbiomech.2018.09.011, 2018. [DOI] [PubMed]
- 37.Wiig H, Swartz MA. Interstitial fluid and lymph formation and transport: physiological regulation and roles in inflammation and cancer. Physiol. Rev. 2012;92:1005–1060. doi: 10.1152/physrev.00037.2011. [DOI] [PubMed] [Google Scholar]
- 38.Wu, Y. S. Multiphase Fluid Flow in Porous and Fractured Reservoirs. Amsterdam: Elsevier, 2016.
- 39.Zajac, O., et al. Tumour spheres with inverted polarity drive the formation of peritoneal metastases in patients with hypermethylated colorectal carcinomas. Nat. Cell Biol. 20(3):296–306, 2018. [DOI] [PubMed]
- 40.Zheng, X., et al. Epithelial-to-mesenchymal transition is dispensable for metastasis but induces chemoresistance in pancreatic cancer. Nature 527:525, 2015. [DOI] [PMC free article] [PubMed]


