

Abstract
Background
Circular RNAs (circRNAs) constitute a class of non‐coding RNAs recently discovered to be widespread and abundant in mammalian cells. However, the expression features of most of circRNAs in hepatocellular carcinoma (HCC) are unraveled. In this study, we focused on hsa_circ_0003570, which was found to be down‐regulated in HCC tissues in our previous microarray screening.
Methods
The hsa_circ_0003570 levels in HCC cell lines, HepG2, SMMC‐7721, MHCC97L, MHCC97H, and HCCLM3, and human normal hepatic cell line L02 were detected by quantitative reverse transcription‐polymerase chain reaction (qRT‐PCR). Then, its levels in 107 paired HCC tissues and adjacent non‐tumor tissues, 60 liver biopsy samples from patients with chronic liver diseases were detected by qRT‐PCR. The receiver operating characteristic curve (ROC) was used to evaluate the diagnostic value of hsa_circ_0003570 for HCC.
Results
Hsa_circ_0003570 was not only first found down‐regulated in HCC cell lines (P<.001) but also in HCC tissues (P<.001). Moreover, hsa_circ_0003570 was gradually decreased from chronic hepatitis (CH), to liver cirrhosis (LC) and to HCC tissues (P<.01). Its expression levels were significantly correlated with tumor diameter (P=.035), differentiation (P=.013), microvascular invasion (P=.045), Barcelona Clinic Liver Cancer stages (P=.011), tumor‐node‐metastasis stages (P=.016), and serum alpha‐fetoprotein levels (P=.031). The ROC curve demonstrated that hsa_circ_0003570 had poor performance for differentiating HCC from LC and CH, but had relatively good performance for differentiating LC from CH.
Conclusions
These results indicated that hsa_circ_0003570 expression levels were associated with HCC clinicopathological characteristics.
Keywords: chronic hepatitis, circular RNA, cirrhosis, hepatocellular carcinoma, hsa_circ_0003570
1. Introduction
Circular RNAs (circRNAs), the 3′ and 5′ ends of which are covalently linked, constitute a class of non‐coding RNAs recently discovered to be widespread and abundant in mammalian cells.1 Some circRNAs exhibit developmental‐stage, tissue and cell‐type specific. Recent research has demonstrated that some circRNAs play significant roles in human diseases, including various kinds of cancer, such as gastric cancer, bladder cancer, colorectal cancer, pancreatic ductal adenocarcinoma, and so on.2, 3, 4, 5 Nevertheless, the association between circRNAs and hepatocellular carcinoma (HCC) remains unknown.
HCC ranks as the fifth most common cancer and the second most frequent lethal cause in men.6 As we know, chronic fibrosis is a major risk factor for the development of HCC.7 The lethality of HCC stems in part from underlying chronic liver disease, especially liver cirrhosis (LC). It is very important to scrutinize chronic hepatitis (CH) patients during their whole life. As the most commonly used tumor marker alpha‐fetoprotein (AFP), due to low sensitivity, is no more recommended in recent years.8, 9 Consequently, it is necessary to find novel tumor markers for diagnosing and monitoring patients with HCC and unravel mechanisms in hepatocarcinogenesis.
In this study, we focused our attention on circRNA‐hsa_circ_0003570 (http://www.circbase.org/cgi-bin/simplesearch.cgi), which is found to be down‐regulated in HCC tissues in our previous microarray screening (GEO No. 94508: https://www.ncbi.nlm.nih.gov/geo/query/acc.cgi?acc=GSE94508). Its gene is located at chr10:126370175‐126384781; its relative gene symbol is FAM53B (family with sequence similarity 53 member B); its spiced length is 828nt. Hsa_circ_0003570 was first found to be down‐regulated in HCC cell lines (P<.001) and HCC tissues (P<.001), and had stage‐specific expression features from CH to LC and to HCC (P<.01). Additionally, we found that its down‐regulated expression was significantly relative to major clinicopathological factors of patients with HCC.
2. Methods
2.1. Sample collection and ethics statement
A total of 107 pairs of HCC tissues and adjacent non‐tumorous tissues were obtained from patients with HCC at three medical centers, Ningbo No. 2 Hospital, Ningbo Li Hui‐Li Hospital and Ningbo Yinzhou Peoples' Hospital, China, between March 2013 and January 2017. The 60 cases of chronic liver diseases tissues were collected from September 2013 to January 2017 in Ningbo No. 2 Hospital through liver biopsy under guided ultrasound. These tissue specimens were immediately conserved in RNA‐fixer Reagent (Bioteke, Beijing, China) after removal from patients and were kept at −80°C until use. Paired adjacent non‐tumorous tissues that were located 1 cm away from the edge of the HCC were confirmed to have no obvious tumor cells by two experienced pathologists. Patients with HCC who had prior treatment of their tumor or history of other solid tumors were excluded in this study. The Human Research Ethics Committee from Ningbo University approved all aspects of this study (IRB No. 20100303). All research subjects provided written informed consent before being enrolled into the study.
Tumors were staged according to the tumor‐node‐metastasis (TNM) staging system10 and the Barcelona Clinic Liver Cancer staging system (BCLC).11 Fibrosis stage was assessed by the METAVIR scoring system.12
2.2. Cell culture
HCC cell lines, HepG2 and SMMC‐7721, and human normal hepatic cell line L02 were purchased from the Shanghai Institute of Biochemistry and Cell Biology, Chinese Academy of Sciences (Shanghai, China). MHCC97L, MHCC97H, and HCCLM3 were from the Liver Cancer Institute, Fudan University (Shanghai, China). All cell lines were cultured with RPMI 1640 Medium (Life Technologies, Carlsbad, CA, USA) containing 10% fetal bovine serum in a humidified atmosphere of 5% CO2.
2.3. Total RNA extraction and reverse transcription
Total RNA was extracted with TRIzol reagent (Invitrogen, Karlsruhe, Germany) in accordance with the manufacturer's instructions. Concentration and purity of total RNA samples were measured by the Smart Spec Plus spectrophotometer (Bio‐Rad, Hercules, CA, USA). If the ratio of A260/A280 was 1.8‐2.0, RNA was used for further experiments. cDNA was synthesized using the GoScript RT System (Promega, Madison, WI, USA) as previously literature described.13
2.4. qRT‐PCR detection of hsa_circ_0003570
The real‐time quantitative reverse transcription‐polymerase chain reaction (qRT‐PCR) was performed with the GoTaq qPCR Master Mix (Promega) in an Mx3005P real‐time PCR system (Stratagene, La Jolla, CA, USA) following the manufacturer's instructions. The primers' sequences of hsa_circ_0003570 were 5′‐CAAGATGGCACAGCAGCACACGC‐3′ and 5′‐ATGCTGGTGCTCGGTTGGTC‐3′. The primers' sequences of glyceraldehyde‐3‐phosphate dehydrogenase (GAPDH), as a control, were 5′‐TCGACAGTCAGCCGCATCTTCTTT‐3′ and 5′‐ACCA AATCCGTTGACTCCGACCTT‐3′. The primers were synthesized by Sangon Biotech (Shanghai, China). Their expression levels were analyzed by the ΔC t method. Relative expression of hsa_circ_0003570 was calculated using the method. All results were expressed as the mean±SD of three independent experiments. All assays were performed in a blinded fashion.
2.5. Electrophoresis of qRT‐PCR products
To prove the correct of qRT‐PCR products, 1.5% agarose gel electrophoresis tests was used.
2.6. Cloning and sequencing of qRT‐PCR products
Based on the manufacturer's instructions, the qRT‐PCR product of hsa_circ_0003570 was first purified by using a UNIQ‐10 PCR Product Purification Kit, and then cloned into the pUCm‐T vector (Sangon Biotech). After that, RNA sequencing was performed by Sangon Biotech Co., Ltd.
2.7. Laboratory testing
Morning fasting venous blood (5 mL) was collected from all subjects. Serum was immediately isolated and stored at −80°C. Liver function including aspartate transaminase (AST), alanine aminotransferase (ALT), alkaline phosphatase (AKP), gamma glutamyl transferase (GGT), total protein, albumin, and total bilirubin was measured by Olympus AU 2700 automatic biochemical analyzer (Olympus, Tokyo, Japan). AFP was measured with an Elecsys 2010 machine (Roche Diagnostics, Basel, Switzerland).
2.8. Statistical analysis
All statistical analysis in this study was performed by the Statistical Product and Service Solutions (SPSS) 16.0 software package (IBM, Chicago, IL, USA) and GraphPad Prism 6.0 (GraphPad Software, La Jolla, CA, USA). Paired t test, independent t test, one way analysis of variance (ANOVA), and two‐tailed Student's t tests were used. A receiver operating characteristic (ROC) curve was established to value the diagnostic power. P value of .05 or less was considered statistically significant.
3. Results
3.1. General characteristics of the subjects
In the HCC group, about more than four‐fifths of patients were men (89.7%); more than 50 years old was up to 78.5%; and about 67.3% patients had hepatitis B family history. The hepatitis B virus infection rate was up to 85.7%; and AFP positive rate was about 61.2% (Table 1).
Table 1.
The relationship between hsa_circ_0003570 expression levels (ΔC t) in cancer tissues and clinic‐pathological factors of patients with HCC
| Characteristics | No. of patients | Percent of patients (%) | Mean±SD | P value |
|---|---|---|---|---|
| Age (years) | ||||
| ≥50 | 84 | 78.5 | 12.05±1.34 | .714 |
| <50 | 23 | 21.5 | 12.17±1.37 | |
| Gender | ||||
| Male | 96 | 89.7 | 12.14±1.34 | .611 |
| Female | 11 | 10.3 | 11.53±1.25 | |
| Family history | ||||
| Positive | 72 | 67.3 | 12.18±1.35 | .244 |
| Negative | 35 | 32.7 | 11.86±1.30 | |
| Diabetes mellitus | ||||
| Yes | 14 | 13.1 | 12.14±1.27 | .844 |
| No | 93 | 86.9 | 12.06±1.36 | |
| Encapsulation | ||||
| Yes | 69 | 64.5 | 11.98±1.32 | .360 |
| No | 38 | 35.5 | 12.24±1.38 | |
| Tumor number | ||||
| Single | 74 | 69.2 | 12.03±1.39 | .626 |
| Multiple | 33 | 30.8 | 12.16±1.23 | |
| Diameter (cm) | ||||
| ≥5 | 45 | 42.1 | 12.40±1.43 | .035 |
| <5 | 62 | 57.9 | 11.84±1.23 | |
| Differentiation | ||||
| Poor | 17 | 15.9 | 12.84±1.27 | .013 |
| Moderate and Well | 90 | 84.1 | 11.93±1.31 | |
| Microvascular invasion | ||||
| Positive | 45 | 43.7 | 12.39±1.56 | .046 |
| Negative | 58 | 56.3 | 11.86±1.12 | |
| BCLC stage | ||||
| A | 45 | 42.1 | 11.63±1.18 | .011 |
| B | 42 | 39.2 | 12.45±1.33 | |
| C+D | 20 | 18.7 | 12.28±1.47 | |
| TNM stage | ||||
| I | 44 | 41.1 | 11.72±1.13 | .016 |
| II+III+IV | 63 | 58.9 | 12.32±1.42 | |
| HbsAg | ||||
| Negative | 15 | 14.3 | 11.88±1.24 | .547 |
| Positive | 90 | 85.7 | 12.11±1.37 | |
| Serum AFP | ||||
| >20 | 63 | 61.2 | 12.29±1.29 | .031 |
| ≤20 | 40 | 38.8 | 11.70±1.35 | |
| Serum AKP | ||||
| >95 | 58 | 54.2 | 11.95±1.30 | .303 |
| ≤95 | 49 | 45.8 | 12.22±1.38 | |
| Serum GGT | ||||
| >50 | 58 | 54.2 | 12.26±1.37 | .125 |
| ≤50 | 49 | 45.8 | 11.86±1.29 | |
TNM, tumor‐node‐metastasis; BCLC, Barcelona Clinic Liver Cancer staging system; AFP, alpha‐fetoprotein; AKP, alkaline phosphatase; GGT: gamma glutamyl transferase.
3.2. qRT‐PCR product
As shown in Figure 1A, the qRT‐PCR products of hsa_circ_0003570 was 135 bp, which was consistent with the predicted size. The head‐to‐tail splicing junction of hsa_circ_0003570 was proved through cloning and sequencing of qRT‐PCR products (Figure 1B).
Figure 1.
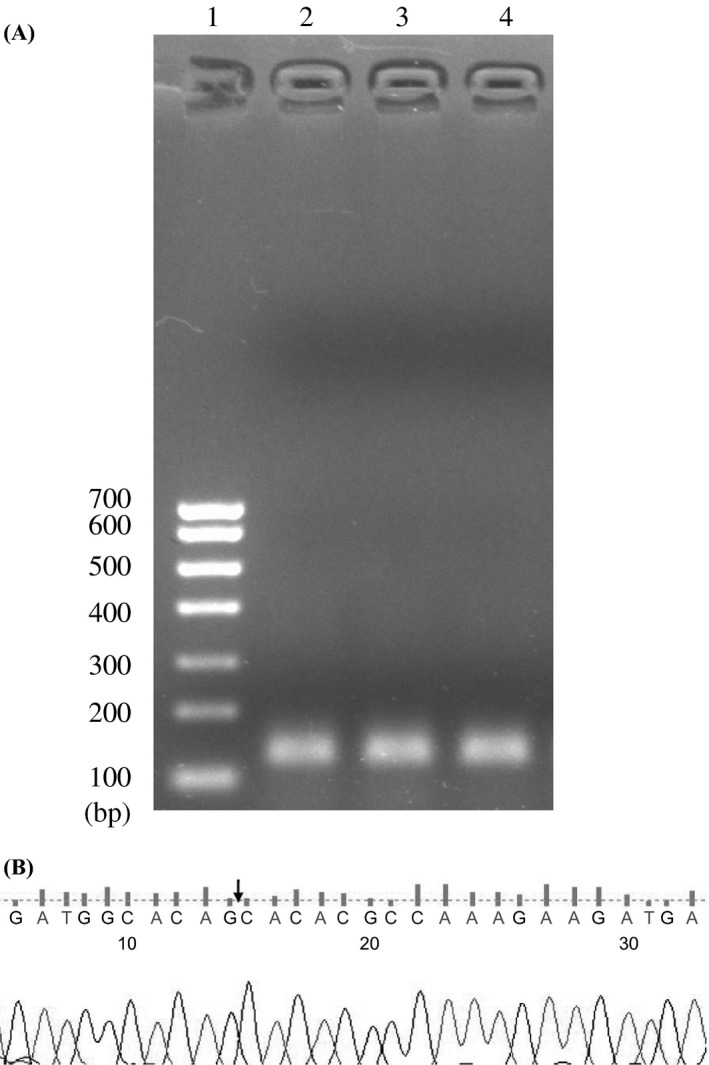
Validation of qRT‐PCR products of hsa_circ_0003570. (A) Electrophoresis of qRT‐PCR products of hsa_circ_0003570. 1, DNA markers; 2‐4, three representative samples. (B) Sequence of qRT‐PCR products of hsa_circ_0003570. Arrow indicates the splicing junction site
3.3. Hsa_circ_0003570 expression was down‐regulated in HCC cell lines and tissues
As shown in Figure 2A, compared with human normal hepatic cell line L02, the hsa_circ_0003570 levels were significantly down‐regulated in HCC cell lines, HepG2, SMMC‐7721, MHCC97L, MHCC97H, and HCCLM3 (P<.001). And the most interesting finding was that the expression level of hsa_circ_0003570 in MHCC97H (higher metastasis cell line) was lower than that in MHCC97L (lower metastasis cell line) (P<.001). Furthermore, hsa_circ_0003570 levels in HCC tissues were lower than that in adjacent non‐tumorous tissues (Figure 2B, P<.001).
Figure 2.
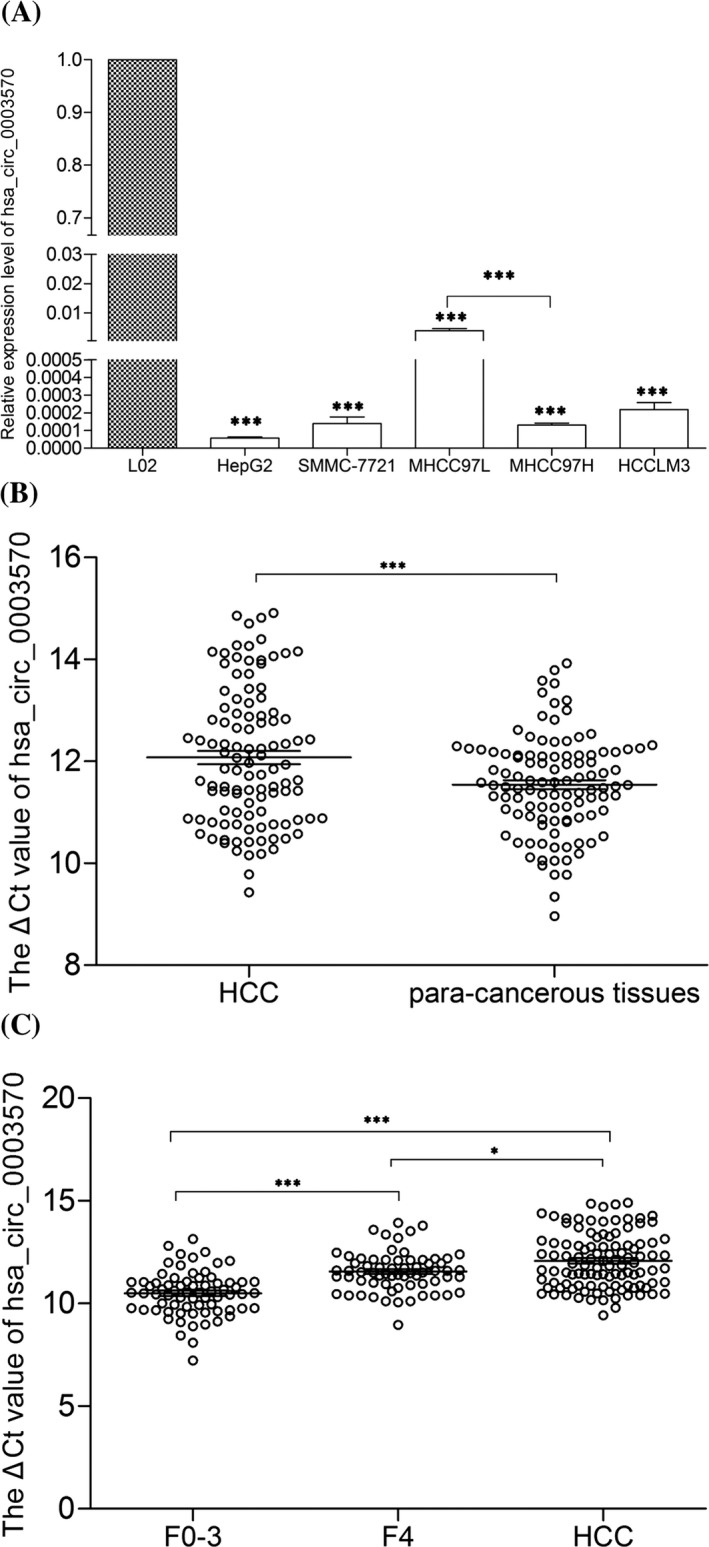
Hsa_circ_0003570 expression features. (A) Decreased expression of hsa_circ_0003570 in HCC cell lines and normal hepatic cell line L02. (B) Decreased expression of hsa_circ_0003570 in HCC tissues. (n=107). (C) Hsa_circ_0003570 expression level among tissues in CH (F0‐3; n=71), LC (F4; n=66) and HCC (n=107). Data are means±SD. *P<.05, **P<.01, ***P<.001
3.4. Dynamic changes of hsa_circ_0003570 levels in CH, LC, and HCC tissues
The 77 cases of para‐noncancerous liver tissues had pathological diagnosis, among them, 63 cases showed LC (F=4) and 14 cases showed CH (F=0‐3). LC group consisted of 63 para‐noncancerous liver tissues and three liver tissues of CH patients if METAVIR scoring was F4 with any stage of histological activity grade. CH group consisted of 14 para‐noncancerous liver tissues and 57 liver tissues of CH patients if METAVIR scoring was F0‐3 with any stage of histological activity grade. As shown in Figure 2C, the expression levels of hsa_circ_0003570 decreased gradually from CH, to LC, then to HCC group (P<.01), the expression levels of hsa_circ_0003570 in LC group were lower than those in CH group (P<.001); and the expression levels of hsa_circ_0003570 in HCC group were lower than those in LC group (P<.05).
3.5. Potential diagnostic values of hsa_circ_0003570 in HCC
Since we found that hsa_circ_0003570 expression levels were lower in HCC tissues, we further analyzed their association with clinicopathological features of patients with HCC. As shown in Table 1, hsa_circ_0003570 levels were significantly related to tumor diameter (P=.035), differentiation (P=.013), microvascular invasion (P=.045), BCLC stage (P=.011), TNM stage (P=.016), and serum AFP levels (P=.031). However, we found no association between its levels with other clinicopathological features such as age, gender, family history, encapsulation, serum AKP, and serum GGT. To evaluate the potential diagnostic value in HCC, the ROC curve has been used. We found that the area under the ROC curve (AUC) was 0.70 (Figure 3A). The sensitivity and specificity were 44.9% and 86.8%, respectively. The cut‐off value was 12.24. After that, to further evaluate the potential diagnostic value in cirrhosis, we found that the AUC was 0.778 (Figure 3B). The sensitivity and specificity were 69.7% and 83.1%, respectively. The cut‐off value was 11.28.
Figure 3.

Receiver operation characteristics (ROC) curve of using hsa_circ_0003570 as a marker to differentiate HCC from LC and CH (A), and differentiate LC from CH (B). AUC, area under the ROC curve. P<.05
4. Discussion
CircRNAs are an enigmatic class of RNA with unknown function in mammal cells, and often show tissue/developmental‐stage‐specific expression.14, 15 CircRNAs were once thought as transcriptional noise.16 With the development of bioinformatics methods, more and more circRNAs were found recently. Several reports have shown that circRNA might play a role in the occurrence and development of diseases, and most of them act as miRNA sponge. For example, Cdr1 antisense locus (CDR1as) has approximately 70 miRNA‐binding sites with miR‐7, and is associated with Parkinson disease, diabetes, and tumors, myocardial infarction.17, 18, 19, 20 Cir‐ITCH could suppress the activation of Wnt/β‐catenin signaling in esophageal squamous cell carcinoma (ESCC) and colorectal cancer by sponging multiple miRNAs.21, 22
CircRNAs have two significant properties: highly conserved and remarkably stable with a half‐life more than 48 hours.23 Harboring these properties, circRNAs may be a promising tumor marker in precision medicine. For example, hsa_circ_002059 and hsa_circ_0000190 have been found to be new biomarkers in the diagnosis of gastric cancer;23, 24 hsa_circ_0001649 and cirZKSCAN1 have been found to be new biomarkers in the diagnosis of HCC.25, 26
qRT‐PCR can be used to quickly assess the relative abundance of the circRNAs across a panel of samples.2 In this study, the expression of hsa_circ_0003570 was down‐regulated in HCC tissues compared with that in paired adjacent non‐tumorous tissues (Figure 2B). And, low levels of hsa_circ_0003570 in HCC were associated with tumor size, differentiation, microvascular invasion, BCLC stage, TNM stage, and serum AFP levels (Table 1). In the overwhelming majority of cases, the increasing numbers of tumor size, differentiation, microvascular invasion, BCLC stage, TNM stage, and serum AFP levels result in a decreasing 5‐year survival rate and increasing rate of recurrence and metastasis. The levels of hsa_circ_0003570 in HCC cell lines were lower than those in L02 (Figure 2A). Intriguingly, we found that the expression levels of hsa_circ_0003570 in MHCC97H were lower than those in MHCC97L cell lines. As we know, MHCC97‐H with high metastatic potential and MHCC97‐L with low metastatic potential have 100% and 40% pulmonary metastatic rate, respectively.27 Hsa_circ_0003570 is transcribed from FAM53B, whose protein modulates cell proliferation and is one of the regulators of β‐catenin‐dependent Wnt signaling pathway.28, 29 Previous studies have certified the importance of Wnt/β‐catenin signaling pathway during carcinogenesis, especially in HCC.30, 31 Taken together, our data suggested that hsa_circ_0003570 may play some roles during HCC invasion and metastasis.
CH followed by concomitant LC is the predominant risk factor for the development of HCC.31 Advanced CH is described as cirrhosis with a loss of architecture and attendant life‐threatening complications, one of which is HCC.32 The presence of cirrhosis is significantly associated with poor prognosis in HCC patients.33, 34 A previous study has shown that activated hepatic stellate cells (aHSCs) play a pivotal role in causing LC and infiltration into the HCC stroma, which facilitates malignancy invasion.35 As shown in Figure 2C, the expression level of hsa_circ_0003570 decreased gradually from CH, to LC to HCC. This indicated that hsa_circ_0003570 might harbor stage‐specific expression features in diverse chronic liver diseases. ROC analysis demonstrated that hsa_circ_0003570 had poor performance for differentiating HCC from LC and CH, but had relatively good performance for differentiating LC from CH (Figure 3). By studying the functions of hsa_circ_0003570, we could improve our understanding of the mechanisms underlying HCC occurrence and metastasis.
In conclusion, these results indicated that hsa_circ_0003570 was closely correlated with the clinicopathological characteristics of patients with HCC and the background of cirrhosis was related to the decreased hsa_circ_0003570 in HCC patients.
Acknowledgments
This study was supported by the Foundation for Hepatitis Prevention and Control Project of China (No. TQGB20150219), Zhejiang Medical Scientific Research Foundation (No. 2017KY140), Regional Medical Center Project of Zhejiang Province (No. 201498), Natural Science Foundation of Ningbo (No. 2015A10236), and the K. C. Wong Magna Fund in Ningbo University.
Fu L, Wu S, Yao T, et al. Decreased expression of hsa_circ_0003570 in hepatocellular carcinoma and its clinical significance. J Clin Lab Anal. 2018;32:e22239 10.1002/jcla.22239
References
- 1. Yao T, Chen Q, Fu L, Guo J. circRNAs: biogenesis, properties, roles and their relationships with liver diseases. Hepatol Res. 2017. 10.1111/hepr.12871 [DOI] [PubMed] [Google Scholar]
- 2. Li P, Chen H, Chen S, et al. Circular RNA 0000096 affects cell growth and migration in gastric cancer. Br J Cancer. 2017;116:626‐633. [DOI] [PMC free article] [PubMed] [Google Scholar]
- 3. Zhong Z, Lv M, Chen J. Screening differential circular RNA expression profiles reveals the regulatory role of circTCF25‐miR‐103a‐3p/miR‐107‐CDK6 pathway in bladder carcinoma. Sci Rep. 2016;6:30919. [DOI] [PMC free article] [PubMed] [Google Scholar]
- 4. Guo JN, Li J, Zhu CL, et al. Comprehensive profile of differentially expressed circular RNAs reveals that hsa_circ_0000069 is upregulated and promotes cell proliferation, migration, and invasion in colorectal cancer. Onco Targets Ther. 2016;9:7451‐7468. [DOI] [PMC free article] [PubMed] [Google Scholar]
- 5. Li H, Hao X, Wang H, et al. Circular RNA expression profile of pancreatic ductal adenocarcinoma revealed by microarray. Cell Physiol Biochem. 2016;40:1334‐1344. [DOI] [PubMed] [Google Scholar]
- 6. Li J, Li J, Bao Y, et al. Low frequency of peripheral lymphocyte in chronic hepatitis B patients predicts poor progression to hepatocellular carcinoma. J Clin Lab Anal. 2016;30:208‐215. [DOI] [PMC free article] [PubMed] [Google Scholar]
- 7. Bu Y, Jia QA, Ren ZG, et al. The herbal compound Songyou Yin (SYY) inhibits hepatocellular carcinoma growth and improves survival in models of chronic fibrosis via paracrine inhibition of activated hepatic stellate cells. Oncotarget. 2015;6:40068‐40080. [DOI] [PMC free article] [PubMed] [Google Scholar]
- 8. Liu T, Yao M, Liu S, et al. Serum Golgi protein 73 is not a suitable diagnostic marker for hepatocellular carcinoma. Oncotarget. 2017. 10.18632/oncotarget.14954 [DOI] [PMC free article] [PubMed] [Google Scholar]
- 9. Yu JP, Xu XG, Ma RJ, et al. Development of a clinical chemiluminescent immunoassay for serum GPC3 and simultaneous measurements alone with AFP and CK19 in diagnosis of hepatocellular carcinoma. J Clin Lab Anal. 2015;29:85‐93. [DOI] [PMC free article] [PubMed] [Google Scholar]
- 10. Webber C, Gospodarowicz M, Sobin LH, et al. Improving the TNM classification: findings from a 10‐year continuous literature review. Int J Cancer. 2014;135:371‐378. [DOI] [PubMed] [Google Scholar]
- 11. Bruix J, Sherman M; American Association for the Study of Liver Diseases . Management of hepatocellular carcinoma: an update. Hepatology. 2011;53:1020‐1022. [DOI] [PMC free article] [PubMed] [Google Scholar]
- 12. Bedossa P, Poynard T. An algorithm for the grading of activity in chronic hepatitis C. The METAVIR Cooperative Study Group. Hepatology. 1996;24:289‐293. [DOI] [PubMed] [Google Scholar]
- 13. Pang Q, Ge J, Shao Y, et al. Increased expression of long intergenic non‐coding RNA LINC00152 in gastric cancer and its clinical significance. Tumour Biol. 2014;35:5441‐5447. [DOI] [PubMed] [Google Scholar]
- 14. Memczak S, Jens M, Elefsinioti A, et al. Circular RNAs are a large class of animal RNAs with regulatory potency. Nature. 2013;495:333‐338. [DOI] [PubMed] [Google Scholar]
- 15. Shao Y, Li J, Lu R, et al. Global circular RNA expression profile of human gastric cancer and its clinical significances. Cancer Med. 2017. 10.1002/cam4.1055 [DOI] [PMC free article] [PubMed] [Google Scholar]
- 16. Ledford H. Circular RNAs throw genetics for a loop. Nature. 2013;494:415. [DOI] [PubMed] [Google Scholar]
- 17. Hansen TB, Kjems J, Damgaard CK. Circular RNA and miR‐7 in cancer. Cancer Res. 2013;73:5609‐5612. [DOI] [PubMed] [Google Scholar]
- 18. Geng HH, Li R, Su YM, et al. The circular RNA Cdr1as promotes myocardial infarction by mediating the regulation of miR‐7a on its target genes expression. PLoS ONE. 2016;11:e0151753. [DOI] [PMC free article] [PubMed] [Google Scholar]
- 19. Yu L, Gong X, Sun L, et al. The circular RNA Cdr1as act as an oncogene in hepatocellular carcinoma through targeting miR‐7 expression. PLoS ONE. 2016;11:e0158347. [DOI] [PMC free article] [PubMed] [Google Scholar] [Retracted]
- 20. Xu H, Guo S, Li W, et al. The circular RNA Cdr1as, via miR‐7 and its targets, regulates insulin transcription and secretion in islet cells. Sci Rep. 2015;5:12453. [DOI] [PMC free article] [PubMed] [Google Scholar]
- 21. Huang G, Zhu H, Shi Y, et al. cir‐ITCH plays an inhibitory role in colorectal cancer by regulating the Wnt/β‐catenin pathway. PLoS ONE. 2015;10:e0131225. [DOI] [PMC free article] [PubMed] [Google Scholar]
- 22. Li F, Zhang L, Li W, et al. Circular RNA ITCH has inhibitory effect on ESCC by suppressing the Wnt/β‐catenin pathway. Oncotarget. 2015;6:6001‐6013. [DOI] [PMC free article] [PubMed] [Google Scholar]
- 23. Chen S, Li T, Zhao Q, et al. Using circular RNA hsa_circ_0000190 as a new biomarker in the diagnosis of gastric cancer. Clin Chim Acta. 2017;466:167‐171. [DOI] [PubMed] [Google Scholar]
- 24. Li P, Chen S, Chen H, et al. Using circular RNA as a novel type of biomarker in the screening of gastric cancer. Clin Chim Acta. 2015;444:132‐136. [DOI] [PubMed] [Google Scholar]
- 25. Qin M, Liu G, Huo X, et al. Hsa_circ_0001649: a circular RNA and potential novel biomarker for hepatocellular carcinoma. Cancer Biomark. 2016;16:161‐169. [DOI] [PubMed] [Google Scholar]
- 26. Yao Z, Luo J, Hu K, et al. ZKSCAN1 gene and its related circular RNA (circZKSCAN1) both inhibit hepatocellular carcinoma cell growth, migration and invasion but through different signaling pathways. Mol Oncol. 2017. 10.1002/1878-0261 [DOI] [PMC free article] [PubMed] [Google Scholar]
- 27. Ji XN, Ye SL, Li Y, et al. Contributions of lung tissue extracts to invasion and migration of human hepatocellular carcinoma cells with various metastatic potentials. J Cancer Res Clin Oncol. 2003;129:556‐564. [DOI] [PubMed] [Google Scholar]
- 28. Thermes V, Candal E, Alunni A, et al. Medaka simplet (FAM53B) belongs to a family of novel vertebrate genes controlling cell proliferation. Development. 2006;133:1881‐1890. [DOI] [PubMed] [Google Scholar]
- 29. Kizil C, Küchler B, Yan JJ, et al. Simplet/Fam53b is required for Wnt signal transduction by regulating β‐catenin nuclear localization. Development. 2014;141:3529‐3539. [DOI] [PubMed] [Google Scholar]
- 30. Zheng Y, Jiang L, Hu Y, et al. Metallothionein 1H (MT1H) functions as a tumor suppressor in hepatocellular carcinoma through regulating Wnt/β‐catenin signaling pathway. BMC Cancer. 2017;17:161. [DOI] [PMC free article] [PubMed] [Google Scholar]
- 31. Farazi PA, DePinho RA. Hepatocellular carcinoma pathogenesis: from genes to environment. Nat Rev Cancer. 2006;6:674‐687. [DOI] [PubMed] [Google Scholar]
- 32. Campana L, Iredale JP. Regression of liver fibrosis. Semin Liver Dis. 2017;37:1‐10. [DOI] [PubMed] [Google Scholar]
- 33. Zhou YM, Sui CJ, Zhang XF, et al. Influence of cirrhosis on long‐term prognosis after surgery in patients with combined hepatocellular‐cholangiocarcinoma. BMC Gastroenterol. 2017;17:25. [DOI] [PMC free article] [PubMed] [Google Scholar]
- 34. Nagaoki Y, Hyogo H, Aikata H, et al. Recent trend of clinical features in patients with hepatocellular carcinoma. Hepatol Res. 2012;42:368‐375. [DOI] [PubMed] [Google Scholar]
- 35. Guirouilh J, Castroviejo M, Balabaud C, et al. Hepatocarcinoma cells stimulate hepatocyte growth factor secretion in human liver myofibroblasts. Int J Oncol. 2000;17:777‐781. [DOI] [PubMed] [Google Scholar]