

Abstract
Background
Vitamins A, D (Vitamin D2 and vitamin D3) and E, play an important role during pregnancy.
Methods
Sera were collected from 1056 normal pregnant women, who were between 18 and 40 years old, at seven different hospitals in northeastern China. The levels of Vitamin A and E in the sera samples were detected using HPLC (High Performance Liquid Chromatography), and the level of vitamin D was measured by LC‐MS (Liquid Chromatography‐Mass Spectrometry). Data were analyzed using IBM SPSS Statistics 21.
Results
The mean levels of vitamin A, D and E in the 1056 sera samples were 0.39 mg/L (0.38‐0.39), 20.44 μg/L (19.86‐21.08) and 12.96 mg/L (12.70‐13.25), respectively. The levels of vitamin A, D, and E deficiency were 17.05%, 0.19%, and 56.44%, respectively. The levels of vitamin A, D, and E of those between age 21 and 31 among the 1056 pregnant women were similar. The correlation of vitamin E and D was significant at the .01 level (two‐tailed), and the correlation of vitamin A and age was significant at the .05 level (2‐tailed).
Conclusion
According to our finding, the levels of vitamin A, D, and E in the sera of pregnant women in northeastern China were affected by where they live and their age. Vitamin D deficiency was very serious, vitamin A deficiency was common, while vitamin E seems to be sufficient.
Keywords: northeast of China, pregnant women, vitamin A, vitamin D, vitamin E
1. Introduction
Vitamins A, D, and E are all fat‐soluble compounds and vital nutrients that our body needs in limited amounts. Vitamin A (VA) includes reinol, retinal, and retinyl esters.1 VA is critical for vision as it is an essential component of rhodopsin, a protein that absorbs light in the retinal receptors. VA also supports cell growth and differentiation, and plays a critical role in the normal formation and maintenance of the heart, lungs, kidneys, and other organs.2 Deficiency of VA could lead to diseases such as night blindness, hyperkeratosis, and keratomalacia.3, 4 The World Health Organization estimates that 9.8 million pregnant women around the world have xerophthalmia as a result of VA deficiency.5 Vitamin D (VD) deficiency could lead to muscle and bone weakness as well as pain. Severe deficiency of VD can cause hypocalcemic seizures.6 The classic effect of vitamin E (VE) is to reduce and prevent oxygen damage to the tissue and is useful for the treatment of pain, inflammation and allergic reactions.7 Although deficiency of VE is very rare, when it happens, it could cause impaired reflexes and coordination, weak muscles, difficulty in walking, sterility in males, induced abortion in females, and mild hemolytic anemia in newborn infants.
Ten years ago, it was reported that the diet of pregnant women was predominantly plant‐based8 and vitamin intake standards were hardly met in China.9 Nowadays, the living standard in China has significantly improved, especially for families expecting a baby, thus pregnant women pay more attention to their nutrition status. It was reported that maternal circulating VD concentrations play an important role in determining neonatal circulating VD levels.10 Karras et al.11 reported that maternal characteristics and active forms of VD, along with their epimers, were associated with 56% of neonatal VD concentrations.
Vitamin A status is normally assessed by measuring the serum concentration of retinol. However, this kind of measurement as a reporter of VA status for Chinese pregnant women has not been done properly before. Wang et al.12 reported that the level of VA in Chinese pregnant women was 1.13±0.37 μmol/L (0.3 mg/L), but it was based on a study with a small sample size that has only 143 pregnant women participated. VD status is evaluated by measuring the serum level of 25‐Hydroxyvitamin D2 and D3. It is generally agreed that a serum level of 25‐hydroxyvitamin D at around 20 ng/mL (50 nmol/L) is desirable for bone growth and overall health. It was found that the serum level of 25‐hydroxyvitamin D at above 30 ng/mL (75 nmol/L) is “not consistently associated with increased benefit”.13 The risk of having cardiovascular disease is lower when vitamin D levels are ranged from 8 to 24 ng/mL (20 to 60 nmol/L).14, 15 VD deficiency is defined as VD serum levels are below 20 μg/L; when the levels are ≥20 μg/L but <30 μg/L, it indicates an inadequate VD status.16 In most hospital of northeastern China, the recommended level of VD is 20‐30 μg/L. VE status is estimated by measuring the serum concentration of α‐tocopherol. Regarding serum concentrations, the functional deficiency threshold concentration of VE was 12 μmol/L (4.8 mg/L).17 In China, little was known about the levels of VA and VE in pregnant women.
Because of the abuse of ripening agent and hormones in agriculture nowadays, people thought there were fewer amounts of nutrients in the foods than before, especially vitamins and minerals. Vitamins are very important for pregnant women and fetuses. To survey the levels of VA, VD, and VE in pregnant women in China, 1056 pregnant women in the Northeast of China were recruited for this investigation. They did not intake additional vitamins during pregnancy, besides from food. We also help the hospitals mentioned in this paper to detect VA, VD, and VE using LC‐MS instead of using commercially available kits, due to the fact that false positive results are often obtained by those kits in Chinese hospitals.
2. Methods
2.1. Samples collection
From July 2015 to June 2016, more than 2000 pregnant women who did not have additional vitamins supplements during pregnancy were selected from the following cities: Changchun, Dunhua, Taonan, Songyuan, Baicheng, Jilin, and Siping. All of the seven cities are in the Northeast of China. The blood samples of the pregnant women were collected in the hospital as following: The first Hospital of Jilin University (Changchun City), Maternal and Child Health Hospital in Dunhua (Dunhua City), Jilin Oilfield General Hospital and Fuhua Maternity Hospital in Songyuan (Songyuan City), Maternal and Child Health Hospital in Taonan (Taonan City), Maternal and Child Health Hospital in Siping (Siping City), Maternal and Child Health Hospital in Baicheng (Baicheng City), Maternal and Child Health Hospital in Jilin (Jilin City). 1056 pregnant women consented to participate in this study.
2.2. Serum extract and HPLC, LC‐MS analysis
Blood sample was centrifuged at 62 g, for 10 minutes after it was collected from pregnant woman, and then the sera were stored at −20°C till analysis. Before the analysis, the serum was kept at room temperature for 10 minutes, then 100 μL of serum was mixed with 100 μL of acetonitrile with internal standard added, and the mixture was centrifuged at 6953 g for 10 minutes. The internal standards of vitamin A, D2, D3, and E were vitamin A acetate, 25‐hydroxyvitamin D2‐d3 25‐hydroxyvitamin D3‐d6 and vitamin E acetate, respectively. Then the supernatants were collected, extracted with 200 μL hexane. Then, 100 μL hexane extract was dried by stream of nitrogen gas; the residue materials were dissolved in 50 μL methane and analyzed by HPLC (High Performance Liquid Chromatography, Shimadzu, Kyoto, Japan) or LC‐MS (Liquid Chromatography‐Mass Spectra, Shimadzu).
The HPLC is Shimadzu 20A (Shimadzu), with FLD (fluorescence Detector) detector. The separation was performed on an Agilent ZORBAX XDB‐C8 (50×2.1 mm, 5 μm) column (Agilent Technology, Sanata Clara, CA, USA) at room temperature. The mobile phase was methane‐water (90:10) at a flow rate of 1.0 mL/min. The determined wavelength was 325 nm (Ex, excitation spectrum) and 470 nm (Em, emission spectrum). All procedures were performed in a dark room to protect the serum form light. Mass spectral data were collected on Shimadzu 8040 MS (Japan) coupled with a Lab Solutions LC solution system in a positive electrospray mode (ESI+).13, 18
2.3. Method validation
The method was validated in terms of accuracy and precision, linearity and recovery, according to the FDA guidelines for validation of bio‐analytical methods.
2.3.1. Accuracy and precision
Day and intra‐day variations were used to validate the accuracy and precision. To evaluate the day precision, three different serum samples were extracted and analyzed in 1 day; each sample was extracted and analyzed three times. To evaluate intra‐day variation, three different serum samples were extracted and analyzed in three consecutive validation days. The precision and accuracy of the method were expressed in terms of relative standard deviation.
2.3.2. Linearity
Calibration standards were prepared by spiking working solutions into the mobile phase solvent to achieve the final concentrations as following: VA were at 10, 50, 200, 400, 1000 μg/L; D2 were at 1, 10, 20, 40, 80 μg/L; VD3 were at 10, 40, 80, 160, 200 μg/L; VE were at 0.5, 2, 10, 40, 80 mg/L; and the VA‐IS was at 1 mg/L, the VD2‐IS was at 40 μg/L, VD3‐IS was at 100 μg/L, VE‐IS was at 3 mg/L.
2.3.3. Extraction recovery
Three different concentrations of vitamin and the related internal standard were added into human sera samples, respectively. VD2 were added at 5, 10, 20 μg/L; VD3 were added at 40, 80, 160 μg/L; VA were added at 20, 100, 500 μg/L, and VE were added at 5, 20, 50 mg/L. After the samples were extracted using the methods described above, VD2 and VD3 were determined using LC‐MS; VA, and VE were determined using HPLC.
2.4. Data analysis
All results were analyzed using IBM SPSS Statistics 21 (IBM Corporation, Armonk, NY, USA) for statistical analysis. The averages of all levels of VA, VE, and VD in the serum of pregnant women were described using column bar graph with the mean and error bar, classified by age (from 18 to 40) and area where the participants live. Pearson correlation analysis was used to describe the correlations of VA, VE, and VD with age. Statistical significance was set at P<.05 or .01.
3. Results
3.1. HPLC and LC‐MS analysis of VA, VE and VD
For HPLC analysis, peaks of VA and VE were showed in Figure 1A and B. In the HPLC gram, VA and vitamin A internal standard (VA‐IS), VE and vitamin E internal standard (VE‐IS) were separated very well (Figure 1).
Figure 1.
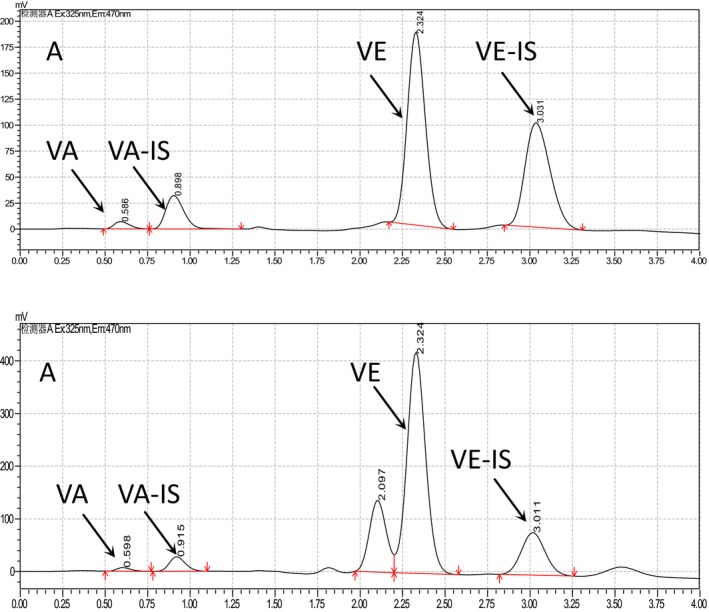
HPLC (High Performance Liquid Chromatography) graphs of vitamin A and vitamin E. The samples were extracted from pregnant women and analyzed by Shimadzu 20A HPLC (Shimadzu) with FLD and Agilent ZORBAX XDB‐C8 (50×2.1 mm, 5 μm). The mobile phase was methane‐water (90:10) at a flow rate of 1.0 mL/min. A is the HPLC graph of standards of VA, VA‐IS, VE, and VE‐IS; B is the HPLC graph of serum sample from pregnant woman
Vitamin D was determined by LC‐MS, and the level of VD was the sum of vitamin D2 (VD2) and D3 (VD3). According the MRM graphs, peaks of VD2, vitamin D2 internal standard (VD2‐IS), VD3 and vitamin D3 internal standard (VD3‐IS), were determined with no interference (Figure 2). In Figure 2A1 and A2, the main peak were the ion 337.2, which was the daughter ion of VD2, and 413.3 was the molecular ion of VD2; in Figure 2B1 and B2, the peak was the ion 358.2, which was the daughter ion of VD2‐IS, and 416.3 was the molecular ion of VD2‐IS; in Figure 2C1 and C2, the peak was the ion 365.3, the daughter ion of VD3, 401.3 was the molecular ion of VD3; in Figure 2D1 and D2, the peak was the ion 371.3, which was the daughter ion of VD3‐IS, and 407.3 was the molecular ion of VD3‐IS.
Figure 2.
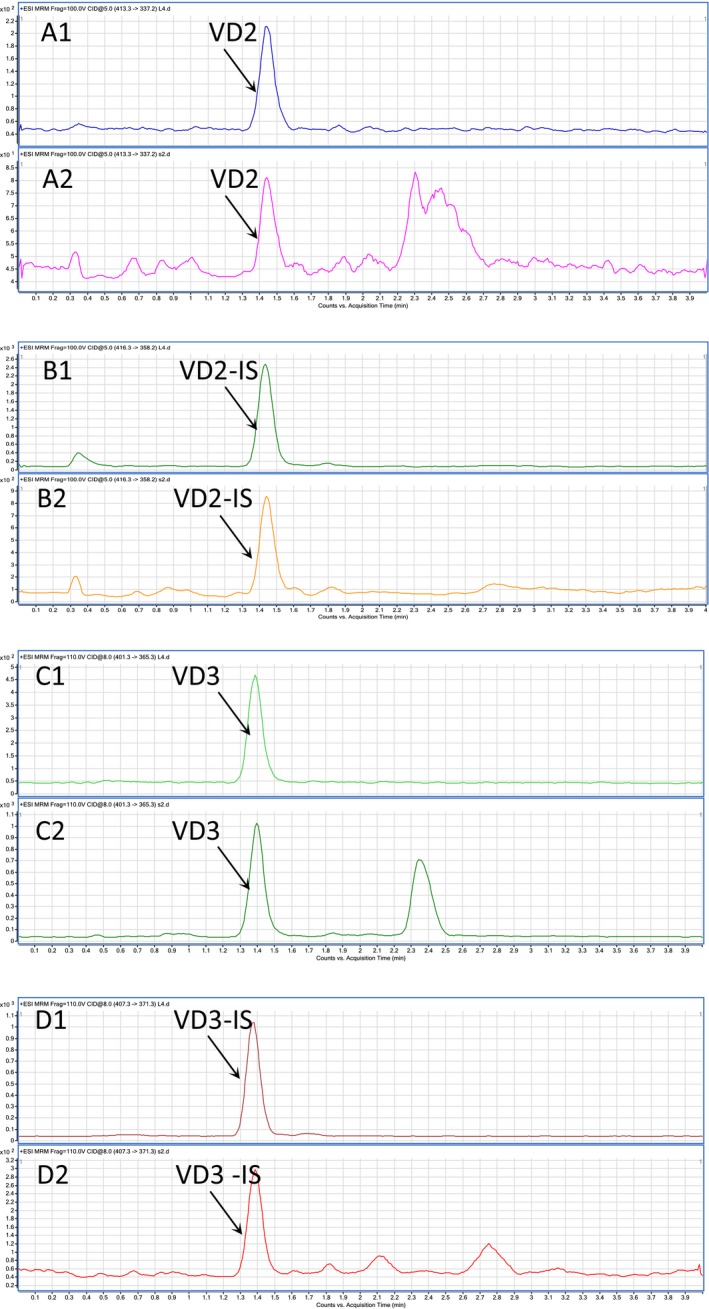
MS graphs of vitamin D2 and vitamin D3. The samples were extracted from pregnant women and analyzed by analyzed by LC‐MS with a Lab Solutions LC solution system in a positive electrospray mode (ESI+). A1, B1, C1, and D1 are the MRM graph of standards; A2, B2, C2, and D2 are the MRM graph of serum samples
3.2. Method validation
3.2.1. Accuracy and precision
The signal and noise heights are used to calculate signal‐to‐noise ratio. The Lower limits of quantification of vitamins are as following: 40 ng/mL for VA, 30 ng/mL for VE, and 0.5 ng/mL for both VD2 and VD3. The values of relative standard deviation (RSD) of day and intra‐day precision of VD2 were 3.39% and 6.12%, respectively. The RSD of day and intra‐day precision of VD3 were 4.9% and 7.8%, respectively.
3.2.2. Linearity
The calibration curve was prepared by plotting the peak area ratios of vitamin to internal standard vs. the concentrations ratios of vitamin to internal standard. The calibration curve showed good linearity over the range 10‐1000 μg/L for VA, 1‐80 μg/L for VD2, 10‐200 μg/L for VD3, 0.5‐80 mg/L for VE. The equation of vitamin A, vitamin D and vitamin E were calculated as: y=0.303750x+0.00209870, R 2=0.9991; y=0.362x+0.000466, R 2=0.9983; y=0.469x+0.0105, R 2=0.9978; y=0.292297x+0.138804, R 2=0.9994, respectively.
3.2.3. Extraction recovery
The extraction recovery was calculated by comparing the peak intensity of vitamin internal standard extracted from serum samples with these compounds directly injected to HPLC and LC‐MS. All the average of extraction recoveries of VA, VD2, VD3, and VE were determined to be between 90% and 105%.
3.3. VA, VD, and VE status of pregnant women
The mean serum levels of VA, VE, and VD from these 1056 pregnant women in the Northeast of China were 0.39 mg/L (95% CI 0.38, 0.39), 12.98 mg/L (95% CI 12.70, 13.25) and 20.47 μg/L (95% CI 19.86, 21.08), respectively (Table 1). The rate of VA deficiency (VAD) was 17.05% and VD deficiency (VDD) was 56.44%, VE deficiency (VED) was 0.19%. The highest percent of VAD appears in the group of age 31‐35, which was 20.29%. The highest percent of VDD appears in the group of age 26‐30, which was 61.10%. VAD was more frequent in pregnant women in Baicheng, Siping, and Songyuan. VDD was more frequent at Songyuan, Dunhua, and Jilin (Table 2). One hundred and two (9.66%) of these pregnant women have both VAD and VDD.
Table 1.
Vitamin levels in the serum samples from pregnant women
| Vitamin | n | Mean level (95% CI) | SE |
|---|---|---|---|
| VA | 1056 | 0.39 (0.38‐0.39) mg/L | 0.0033 |
| VD | 1056 | 20.47 (19.86‐21.08) μg/L | 0.3098 |
| VE | 1056 | 12.98 (12.70‐13.25) mg/L | 0.1388 |
Table 2.
Status deficiency of vitamin A, D and E
| n (All) | Vitamin A deficiency <0.3 mg/L | Vitamin D deficiency <20 μg/L | Vitamin E deficiency <5 mg/L | ||||
|---|---|---|---|---|---|---|---|
| n | % | n | % | n | % | ||
| 1056 | 180 | 17.05 | 596 | 56.44 | 2 | 0.19 | |
| Age group | |||||||
| 18‐25 | 212 | 39 | 18.40 | 115 | 54.25 | 0 | 0.00 |
| 26‐30 | 545 | 88 | 16.15 | 333 | 61.10 | 2 | 0.37 |
| 31‐35 | 207 | 42 | 20.29 | 103 | 49.76 | 0 | 0.00 |
| 36‐40 | 92 | 11 | 11.96 | 45 | 48.91 | 0 | 0.00 |
| Area | |||||||
| Baicheng | 130 | 33 | 25.38 | 42 | 32.31 | 0 | 0.00 |
| Dunhua | 129 | 8 | 6.20 | 99 | 76.74 | 0 | 0.00 |
| Changchun | 203 | 40 | 19.70 | 122 | 60.10 | 1 | 0.20 |
| Jilin | 201 | 18 | 8.96 | 142 | 70.65 | 1 | 0.50 |
| Siping | 197 | 42 | 21.32 | 58 | 29.44 | 0 | 0.00 |
| Songyuan | 90 | 20 | 22.22 | 71 | 78.89 | 0 | 0.00 |
| Taonan | 106 | 19 | 17.92 | 62 | 58.49 | 0 | 0.00 |
Among these 1056 pregnant women, serum VA concentrations were similar among the group of age 25‐31; the serum VD and VE concentrations increased slowly with the test subjects' age (between 26 and 33 years old). For other age groups, the values of VA, VD, and VE concentrations were irregular. When considering the area of living as an influence factor, the mean level of VA did not seem to be affected by it (Figure 3). However, the levels of VD and VE were different for participants among different cities, especially for the pregnant women from Siping and Baicheng (Figure 4).
Figure 3.
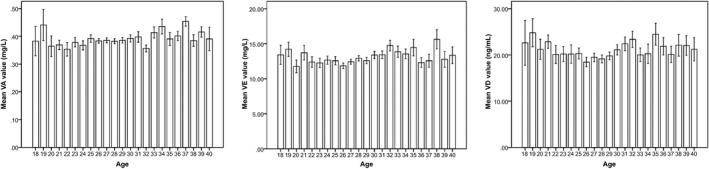
The average level of vitamins in the sera of pregnant women classified by different age. The data were collected from the pregnant women from 18 to 40 and determined by High Performance Liquid Chromatography or LC‐MS. The mean values of vitamin A, D, and E were analyzed by SPSS 13.0. A, B, and C are the mean values of vitamin A, B, and C, respectively, states by different age
Figure 4.
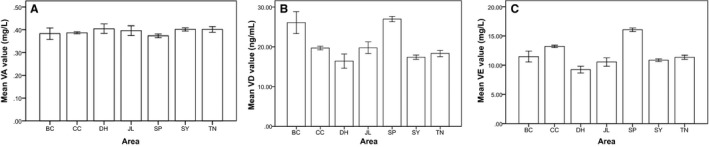
The average level of Vitamins in the serum of pregnant women from different area. The data were collected from the pregnant women from seven different areas and determined by High Performance Liquid Chromatography or LC‐MS. The data were analyzed by SPSS 21. A, B, and C are the mean values of VA, VB, and VC, respectively, statue by different area. SP, Siping; SY, Songyuan; BC, Baicheng; CC, Changchun; JL, Jilin; TN, Taonan; DH, Dunhua
3.4. The correlations of VA, VE, VD levels, and age or area
For Pearson correlation analysis, the correlation between VE and VD was significant at the .01 level (twotailed), and the correlation coefficient was 0.355. The correlation between VE and age was significant at the .01 level (two‐tailed), too; and the correlation coefficient was .086. At the .05 level (two‐tailed), the correlation of VA and age was significant, and the correlation coefficient was .072. Besides these, there was no significant correlation among them (Table 3).
Table 3.
Correlations of Vitamin A, D, E and age
| Age | Vitamin A | Vitamin E | Vitamin D | ||
|---|---|---|---|---|---|
| Age | Pearson correlation | 1 | 0.072a | 0.086b | 0.043 |
| Sig. (two‐tailed) | 0.019 | 0.005 | 0.167 | ||
| N | 1056 | 1056 | 1056 | 1056 | |
| VA | Pearson correlation | 0.072a | 1 | 0.040 | 0.026 |
| Sig. (two‐tailed) | 0.019 | 0.199 | 0.399 | ||
| N | 1056 | 1056 | 1056 | 1056 | |
| VE | Pearson correlation | 0.086b | 0.040 | 1 | 0.355b |
| Sig. (two‐tailed) | 0.005 | 0.199 | 0.000 | ||
| N | 1056 | 1056 | 1056 | 1056 | |
| VD | Pearson correlation | 0.043 | 0.026 | 0.355b | 1 |
| Sig. (two‐tailed) | 0.167 | 0.399 | 0.000 | ||
| N | 1056 | 1056 | 1056 | 1056 |
Correlation is significant at the .05 level (two‐tailed).
Correlation is significant at the .01 level (two‐tailed).
4. Discussion
In our study of measuring the VA, VD, and VE levels in the sera of 1056 pregnant women in the northeastern China, we found that VDD was the most serious symptom for these participating patients. We showed that the mean serum VD concentration in these pregnant women was 20.47 μg/L (95% CI 19.86, 21.08). More than half of the pregnant women tested had VDD (<20 μg/L), which was more serious than many other countries. For example, the rate of VDD in pregnant women was 5.7% in Iran,19 14.9% in Northeast Brazil,20 19.5% in Greece,21 31% in southern India,22 and 32% in northern India.23 In our study, most of the participants had experienced varying degrees of leg cramps during their pregnancy according to our telephone follow‐up interviews, though these data were not showed in this article.
Vitamin D deficiency has become a worldwide issue in the population of all different ages.24, 25, 26 Most people agree that serum VD concentration may be affected by diet, sunshine exposure, latitude of resident, clothing habit, and so on. Although the reasons for high rate of VDD in the Northeast of China were not investigated in this project, there could be several possible explanations. In the northeast part of China (41°N‐46°N), winter is very cold and long therefore people tend to spend more time indoors compared with those living in other areas of China. For that reason, low levels of serum VD may result from low exposure to sunlight. Second, Chinese diet is low in VD,27 particularly because VD is not very stable against heat that occurs during typical Chinese way of cooking.28 In addition, Chinese women usually prefer fair skin, so they tend to have less sun exposure and regularly use sunscreen. Last but not the least; young people in China are taller than they used to be, therefore, it is conceivable that their body may consume more VD for bone growth than the people in the old times. Our study suggests most of the pregnant women did not take enough VD from their foods or they did not have enough VD synthesized by their bodies. So, it is important that pregnant women should have additional VD intake to maintain their normal levels and they should also have more sun exposure.
The mean of serum VD levels in pregnant women from Baicheng and Siping were higher than those from the other cities, and the rate of VDD was lower in both of these cities. Perhaps pregnant women in these areas consume more meat and raw vegetables.
In this study, we found that VDD was more serious among the pregnant women under the age of 30 compared with those above the age of 30; especially for those of age between 26 and 30, the rate of VDD was up to 61.10%. We think this is because young people in China tend to work very hard and take less care of their health and diet, however, when they reach an age of 35 and older, they tend to start child bearing and therefore take better care of their health and diet, although some of them still get VDD. Further studies are needed to understand the reasons for the high prevalence of VDD in Chinese women.
In this study, 180 of the 1056 (17.05%) pregnant women had VAD, a ratio that was similar to what has been reported before (16.80% from 2013 to 2014).29 Therefore, about 17% of pregnant women have VAD in China, and we suggest that VA supplement is needed during pregnancy. VA plays an important role in cell growth and differentiation, is therefore especially important during pregnancy.30 VAD may be caused by no enough supplement or no enough absorption of VA. It was reported that VA deficiency was strongly associated with pregnancy and birth defects.31 It was reported that antenatal VA supplementation decreased anemia, poor infant growth, low birth weight, and preterm delivery.29 Our results showed that the correlation of VA levels with age was significant at the .05 level (two‐tailed), indicating that VA levels increase with age. It does not necessarily mean that elder pregnant women are healthier than the younger ones due to their higher VA levels, or the babies of elder pregnant women will be healthier.
Our results showed only 2 (0.19%) out of 1056 pregnant women participated in this study had a VE value lower than 5 mg/L, at 4.4 mg/L and 4.6 mg/L, respectively, and no adverse health consequences were observed for either of them. In other words, VE intake was enough for most of the pregnant women that had been tested. VE can be obtained from diet, such as vegetables and plant oil, which is different from VD that is synthesized in our body. We suspect that probably due to fact that Chinese people like plant oil more than animal fat, especially for women, normal pregnant women may be able to obtain enough VE from their foods, such as soybean oil and peanut oil.
It is interesting that our results showed that the correlation between the levels of VE and VD was significant at the .01 level (two‐tailed). However, we do not know the exact reasons for that. No article had ever reported a relationship between the levels of VE and VD, therefore, we can only speculate that maybe they can mutually promote each other's absorption. VD and VE are both effective treatment for premenstrual syndrome,32 both have antigenotoxic and antimutagenic properties, and they both play important roles in bone metabolism.33 The relationship between VD and VE should be studied further in the future.
5. Conclusions
According to our findings, the levels of vitamin A, D and E in the sera of pregnant women in the Northeast of China were affected by where they live and their age. Vitamin D deficiency was very serious, and vitamin A deficiency was common, vitamin E was sufficient. Pregnant women should follow the doctor's advice to take additional vitamin supplements.
6. Declarations
Ethics approval and consent to participate: This study was approved by the Institutional Review of Changchun University of Science and Technology and the Hospital of Jilin University. It had been performed in accordance with the ethical standards laid down in the Declaration of Helsinki. All participants provided written informed consent prior to their inclusion in the study.
Consent for publication: Not applicable.
Availability of data and material: The data during and/or analyzed during the current study are available from the corresponding author on reasonable request.
Authors' Contributions
YC detected the values of Vitamins, and drafted the manuscript. ZL extracted vitamins from blood samples and helped to draft the manuscript. CM and XK collected the blood samples from these hospitals. SZ analyzed the data and participated in its design. All authors read and approved the final manuscript.
Abbreviations
- FLD
Fluorescence Detector
- HPLC
High Performance Liquid Chromatography
- LC‐MS
Liquid Chromatography‐Mass Spectra
- VA
Vitamin A
- VAD
Vitamin A Deficiency
- VD
Vitamin D
- VD2
25‐hydroxyvitamin D2
- VD2‐IS
vitamin D2 internal standard
- VD3
25‐hydroxyvitamin D3
- VD3‐IS
vitamin D3 internal standard
- VDD
Vitamin A Deficiency
- VE
Vitamin E
- VED
Vitamin E Deficiency
Acknowledgments
The authors would like to thank the following seven hospitals for helping collecting blood samples: The first Hospital of Jilin University, Maternal and Child Health Hospital in Dunhua, Jilin Oilfield General Hospital and Fuhua Maternity Hospital in Songyuan, Maternal and Child Health Hospital in Taonan, Maternal and Child Health Hospital in Siping, Maternal and Child Health Hospital in Baicheng, Maternal and Child Health Hospital in Jilin. The authors also would like to thank Ying Song (Icanh School of Medicine at Mount Sinai) and Ying Huo for language suggestion.
Chen Y‐j, Li Z‐d, Mao C‐y, Kang X, Zhang S‐h. An investigation of the levels of vitamins A, D and E in the serum of Chinese pregnant women. J Clin Lab Anal. 2018;32:e22176 10.1002/jcla.22176
Yu‐juan Chen and Zhan‐dong Li contributed equally to this work.
References
- 1. Ross CA, Vitamin A, Coates PM, et al., eds. Encyclopedia of Dietary Supplements, 2nd edn London and New York: Informa Healthcare; 2010:778–791. [Google Scholar]
- 2. Ross A. Vitamin A and carotenoids In: Shils M, Shike M, Ross A, eds. Modern Nutrition in Health and Disease, 10th edn Baltimore, MD: Lippincott Williams & Wilkins; 2016:351–375. [Google Scholar]
- 3. Mactier H, Weaver LT. Vitamin A and preterm infants: what we know, what we don't know, and what we need to know. Arch Dis Child Fetal Neonatal Ed. 2005;90:F103–F108. [DOI] [PMC free article] [PubMed] [Google Scholar]
- 4. Mayo‐Wilson E, Imdad A, Herzer K, et al. Vitamin A supplements for preventing mortality, illness, and blindness in children aged under 5: systematic review and meta‐analysis. BMJ. 2011;343:d5094. [DOI] [PMC free article] [PubMed] [Google Scholar]
- 5. World Health Organization . Global Prevalence of Vitamin A Deficiency in Populations at Risk 1995‐2005: WHO Global Database on Vitamin A Deficiency. Geneva: World Health Organization; 2009. [Google Scholar]
- 6. Vuletić B, Marković S, Igrutinović Z, et al. Case report of an infant with severe vitamin D deficiency rickets manifested as hypocalcemic seizures. Srp Arh Celok Lek. 2016;144:90–93. [DOI] [PubMed] [Google Scholar]
- 7. Caraffa AL, Varvara G, Spinas E, et al. Is vitamin E an anti‐allergic compound? J Biol Regul Homeost Agents. 2016;30:11–15. [PubMed] [Google Scholar]
- 8. Lai J, Yin S, Ma G, et al. The nutrition and health survey of pregnant women in China. Acta Nutrimenta Sinica. 2007;1:2. [Google Scholar]
- 9. Cheng Y, Dibley MJ, Zhang X, et al. Assessment of dietary intake among pregnant women in a rural area of western China. BMC Public Health. 2009;9:222. [DOI] [PMC free article] [PubMed] [Google Scholar]
- 10. Novakovic B, Galati JC, Chen A, et al. Maternal vitamin D predominates over genetic factors in determining neonatal circulating vitamin D concentrations. Am J Clin Nutr. 2012;96:188–195. [DOI] [PubMed] [Google Scholar]
- 11. Karras SN, Shah I, Petroczi A, et al. An observational study reveals that neonatal vitamin D is primarily determined by maternal contributions: implications of a new assay on the roles of vitamin D forms. Nutr J. 2013;12:77. [DOI] [PMC free article] [PubMed] [Google Scholar]
- 12. Wang YZ, Ren WH, Liao WQ, et al. Concentrations of antioxidant vitamins in maternal and cord serum and their effect on birth outcomes. J Nutr Sci Vitaminol. 2009;55:1–8. [DOI] [PubMed] [Google Scholar]
- 13. Saenger AK, Laha TJ, Bremner DE, et al. Quantification of serum 25‐hydroxyvitamin D2 and D3 using HPLC‐tandem mass spectrometry and examination of reference intervals for diagnosis of vitamin D deficiency. Am J Clin Pathol. 2006;125:914–920. [DOI] [PubMed] [Google Scholar]
- 14. Ross AC, Taylor CL, Yaktine AL, et al. Dietary Reference Intakes for Calcium and Vitamin D. Washington, DC: National Academies Press; 2011. [PubMed] [Google Scholar]
- 15. Wang L, Song Y, Manson JE, et al. Circulating 25‐hydroxy‐vitamin D and risk of cardiovascular disease: a meta‐analysis of prospective studies. Circ Cardiovasc Qual Outcomes. 2012;5:819–829. [DOI] [PMC free article] [PubMed] [Google Scholar]
- 16. Sampl E, Wagner D, Friedl C, et al. Vitamin D deficiency following Billroth II surgery – How much vitamin D is enough?: a case report. Cases J. 2010;3:12. [DOI] [PMC free article] [PubMed] [Google Scholar]
- 17. Szabolcs P, Angelika F, Roos FF, et al. A systematic review of global alpha‐tocopherol status as assessed by nutritional intake levels and blood serum concentrations. Int J Vitam Nutr Res. 2016;14:1–21. [DOI] [PubMed] [Google Scholar]
- 18. Zoë M, Dennis JW, Sandra J, et al. Routine isotope‐dilution liquid chromatography‐tandem mass spectrometry assay for simultaneous measurement of the 25‐hydroxy metabolites of vitamins D2 and D3. Clin Chem. 2005;51:1683–1690. [DOI] [PubMed] [Google Scholar]
- 19. Salek M, Hashemipour M, Aminorroaya A, et al. Vitamin D deficiency among pregnant women and their newborns in Isfahan, Iran. Exp Clin Endocrinol Diabetes. 2008;116:352–356. [DOI] [PubMed] [Google Scholar]
- 20. Pena HR, Lima MC, Galeão K, et al. Influence of preeclampsia and gestational obesity in maternal and newborn levels of vitamin D. BMC Pregnancy Childbirth. 2015;15:112. [DOI] [PMC free article] [PubMed] [Google Scholar]
- 21. Nicolaidou P, Hatzistamatiou Z, Papadopoulou A, et al. Low vitamin D status in mother newborn pairs in Greece. Calcif Tissue Int. 2006;78:337–342. [DOI] [PubMed] [Google Scholar]
- 22. Farrant HJ, Krishnaveni GV, Hill JC, et al. Vitamin D insufficiency is common in Indian mothers but is not associated with gestational diabetes or variation in newborn size. Eur J Clin Nutr. 2009;63:646–652. [DOI] [PMC free article] [PubMed] [Google Scholar]
- 23. Sahu M, Bhatia V, Aggarwal A, et al. Vitamin D deficiency in rural girls and pregnant women despite abundant sunshine in northern India. Clin Endocrinol (Oxf). 2009;70:680–684. [DOI] [PubMed] [Google Scholar]
- 24. Soesanti F, Pulungan A, Tridjaja B, et al. Vitamin D profile in healthy children aged 7‐12 years old in Indonesia. Int J Pediatr Endocrinol. 2013;1:167. [Google Scholar]
- 25. Eriksen EF, Glerup H. Vitamin D deficiency and aging: implications for general health and osteoporosis. Biogerontology. 2002;3:73–77. [DOI] [PubMed] [Google Scholar]
- 26. Holick MF. Vitamin D deficiency. N Engl J Med. 2007;357:266–281. [DOI] [PubMed] [Google Scholar]
- 27. Song SJ, Si SY, Liu JL, et al. Vitamin D status in Chinese pregnant women and their newborns in Beijing and their relationships to birth size. Public Health Nutr. 2012;16:687–692. [DOI] [PMC free article] [PubMed] [Google Scholar]
- 28. Jette J, Pia K. Stability of vitamin D in foodstuffs during cooking. Food Chem. 2014;148:170–175. [DOI] [PubMed] [Google Scholar]
- 29. Yang C, Chen J, Liu Z, et al. Prevalence and influence factors of vitamin A deficiency of Chinese pregnant women. Nutr J. 2016;15:12. [DOI] [PMC free article] [PubMed] [Google Scholar]
- 30. World Health Organization . Global Prevalence of Vitamin A Deficiency in Populations at Risk 1995–2005: WHO Global Database on Vitamin A Deficiency. Geneva: World Health Organization; 2009:55. [Google Scholar]
- 31. Guallar E, Stranges S, Mulrow C, et al. Enough is enough: stop wasting money on vitamin and mineral supplements. Ann Intern Med. 2013;159:850–851. [DOI] [PubMed] [Google Scholar]
- 32. Dadkhah H, Ebrahimi E, Fathizadeh N. Evaluating the effects of vitamin D and vitamin E supplement on premenstrual syndrome: a randomized, double‐blind, controlled trial. Iran J Nurs Midwifery Res. 2016;21:159. [DOI] [PMC free article] [PubMed] [Google Scholar]
- 33. Staal A, Van Wijnen AJ, Desai RK, et al. Antagonistic effects of transforming growth factor‐beta on vitamin D3 enhancement of osteocalcin and osteopontin transcription: reduced interactions of vitamin D receptor/retinoid X receptor complexes with vitamin E response elements. Endocrinology. 1996;137:2001–2011. [DOI] [PubMed] [Google Scholar]