

Abstract
Background
Combination of dyslipidemic phenotypes, including elevated plasma levels of low‐density lipoprotein cholesterol (LDL‐C), elevated plasma triglycerides (TG), and decreased low‐density lipoprotein cholesterol (HDL‐C) concentrations, is important because of the association of individual phenotypes with increased risk of cardiovascular disease (CVD). We investigated the prevalence of combined dyslipidemias and their effects on CVD risk in an Iranian large population.
Method
A total of 9847 individuals were recruited as part of the Mashhad Stroke and Heart Atherosclerotic Disorders (MASHAD) cohort study. Anthropometric parameters and biochemical indices were measured in all of the subjects. Different types of combined dyslipidemias including high TG + low HDL‐C, high TG + low HDL‐C + high LDL‐C, low HDL‐C + high LDL‐C, high TG + high LDL‐C, and finally high TG + high LDL‐C + low HDL‐C were considered. Ten‐year CVD risk was calculated using the QRISK2 risk algorithm and adjustments were made as suggested by the Joint British Societies’ (JBS2). Logistic regression analyses were performed to determine the association between different combined dyslipidemias and categorical QRISK.
Results
A total of 3952 males and 5895 females were included in this current study. Among the included subjects, 83.4% had one form of dyslipidemia, and 16.6% subjects were not dyslipidemic. The mean age was 48.88 ± 7.9 and 47.02 ± 8.54 years for dyslipidemic and nondyslipidemic groups, respectively. The results showed that the frequency of dyslipidemia was 98%, 87.1%, and 90% in subjects with metabolic syndrome, CVD, and diabetes, respectively. Our results suggested that around 15.7% of study population were at 10 years CVD risk (high ≥20) and it was higher in men than women (P < .001). Moreover, risk of CVD was higher in TG↑ & HDL↓ & LDL↑ group than other groups.
Conclusion
Prevalence of dyslipidemia was 83.4% among Iranian adults. The results showed that individuals with increased plasma TG and LDL‐C, and low HDL‐C levels had the highest 10 years CVD risk compared to other combined dyslipidemic phenotypes.
Keywords: cardiovascular disease, diabetes mellitus, dyslipidemia, Iran
1. INTRODUCTION
Dyslipidemia is a modifiable cardiovascular (CV) risk factor that is manifested as elevated plasma low‐density concentrations of low‐density lipoprotein cholesterol (LDL‐C) or triglycerides (TG), or low plasma high‐density lipoprotein cholesterol (HDL‐C) concentrations.1 The prevalence of dyslipidemia has an increasing trend in many countries including those located in the Middle East region.2 The prevalence of both low HDL‐C and high LDL‐C has been reported to be increased in women. In Iran, the prevalence of hypercholesterolemia is greater in women (38.9% in men and 41.8% in women) but hypertriglyceridemia is more common in men (47% in men and 42.5% in women).3 The prevalence of dyslipidemia has increased in adolescents from Eastern Iran, in whom there at least one lipid abnormality is present in 34.3% of individuals.4
Combined dyslipidemia is typically considered as a mixed phenotype of elevated plasma LDL‐C and TG levels, usually accompanied by decreased HDL‐C concentrations and preponderance of small‐dense LDL particles.5 It has been indicated that combined dyslipidemia is highly prevalent in obese individuals6 in whom there is a 30%‐60% prevalence of hypertriglyceridemia, usually associated with decreased HDL‐C levels.7, 8
Cardiovascular disease (CVD) is one of the most important causes of death globally, and its incidence is rising because the risk factors that lead to the CVD such as hypertension, diabetes, obesity, and dyslipidemia are increasing in prevalence. Atherosclerosis is the underlying cause of CVD9 and dyslipidemia is a well‐documented contributor to this process. As elevated plasma levels of LDL‐C and TG, and reduced plasma HDL‐C are individually known to promote atherogenesis, accumulation of these phenotypes in combined dyslipidemias introduces a greater CVD risk.10, 11, 12 Therefore, it will be crucial to obtain population data on the prevalence of combined dyslipidemias and the association of each dyslipidemia phenotype with CVD risk. We aimed to fulfill this task using a large Iranian cohort database.
2. METHODS
2.1. Population
A total of 9844 subjects (3952 men and 5892 women) were recruited as part of the Mashhad Stroke and Heart Atherosclerotic Disorders (MASHAD) Study using a cluster‐randomized‐sampling assigned during 2007‐2008, as described previously.13 Exclusion criteria included: a known history of infectious diseases, and a family history of stroke, myocardial infarction and diabetes mellitus. Informed consent was obtained from all individuals using approved protocols by the Ethics Committee of the Mashhad University of Medical Sciences.13, 14
2.2. Anthropometric and biochemical measurements
Anthropometric parameters, including height, body weight, Body mass index (BMI) and waist and hip circumference (WC and HC) were measured in all the subjected as previously described,13 while systolic and diastolic blood pressures were measured by sphygmomanometers.13, 14 A fasted lipid profile, including total cholesterol (TC), HDL‐C, LDL‐C, TG and fasting blood glucose (FBG) and serum C‐reactive protein (CRP), and uric acid were measured using standard procedure as described previously15
High values for the lipid components and combined dyslipidemia categorizes are shown in Table 1.
Table 1.
Dyslipidemia definitions and combined dyslipidemia categorizes
| Category | High |
|---|---|
| LDL‐C | ≥130 (mg/dL) |
| HDL‐C | <40 (mg/dL) in male and <50 (mg/dL) in female |
| TG | ≥150 (mg/dL) |
| Combined dyslipidemia categorizes | TG↑ + HDL↓ |
| TG↑ + HDL↓ + LDL↑ | |
| HDL↓ + LDL↑ | |
| TG↑ + LDL↑ | |
| TG↑ or HDL↓ or LDL↑ |
HDL, high‐density lipoprotein; LDL, low‐density lipoprotein; TG, triglycerides.
2.3. QRISK
QRISK is estimation of 10‐year risk of CVD and it was calculated and the adjustments made as suggested by the Joint British Societies’ (JBS2) paper and the JBS Cardiovascular Risk Assessor (patient.info/doctor/cardiovascular‐risk‐calculator).16 Using QRISK, we calculated the 10‐year risk of CVD for every patient in MASHAD Study cohort.
2.4. Statistical analysis
Differences in variables (aside from age) among dyslipidemia determined using ANCOVA analyses with age included as model covariates.
Data were analyzed using SPSS‐18 software (SPSS Inc., IL, USA). The normality of distribution was evaluated using Kolmogorov‐Smirnov test. Descriptive statistics including mean ± standard deviation was considered for normally distributed variables or median and interquartile range for variables that were not normally distributed. Differences in variables (aside from age) among dyslipidemia determined using ANCOVA analyses with age included as model covariates. For categorical parameters, Chi‐square or Fisher exact tests were used. Logistic regression analyses were performed to determine the association of dyslipidemia and categorical QRISK. The cross‐classification of patients was tabulated for two risk groups (low to moderate <20 and high ≥20)16 and P value <.05 was considered as significant. Figures were drawn by Graph Pad Prism 6 software.
3. RESULTS
3.1. Demographic characteristics and the presence of dyslipidemia in males and females
Clinical and demographic characteristics of participants are presented in Table 2. A total of 3952 (40.1%) males and 5892 (59.9%) females were recruited into the current study (Table 2). Among total subjects, 8210 (83.4%) had one form of dyslipidemia (hypertriglyceridemia and low level of HDL‐C, hypertriglyceridemia and low level of HDL‐C and increased LDL‐C, low level of HDL‐C and increased LDL‐C, hypertriglyceridemia and increased LDL‐C, hypertriglyceridemia or low level of HDL‐C or increased LDL‐C), and 1637 (16.6%) subjects were not dyslipidemic.
Table 2.
Anthropometric and biochemical characteristics of subjects with dyslipidemia (n:9844)
| Normal (n:1637) | TG↑ & HDL↓ (n:1695) | TG↑ & HDL↓ & LDL↑ (n:895) | HDL↓ & LDL↑ (n:1069) | TG↑ & LDL↑ (n:384) | TG↑ or HDL↓ or LDL↑ (n: 4167) | P‐value | |
|---|---|---|---|---|---|---|---|
| Sex*** | |||||||
| Male | 852 (52.0%) | 736 (43.4%) | 282 (31.5%) | 269 (25.2%) | 214 (55.7%) | 1599 (38.4%) | |
| Female | 785 (48.0%) | 956 (56.6%) | 613 (68.5%) | 800 (74.8%) | 170 (44.3%) | 2568 (61.6%) | |
| Age (y) | 47.02 ± 8.54 | 48.14 ± 8.2 | 50.84 ± 8.3a | 48.82 ± 7.76 | 50.36 ± 7.57a | 47.97 ± 8.15 | <.021 |
| BMI (m/kg2) | 25.77 ± 4.7 | 29 ± 4.19a | 29.52 ± 5.77a | 28.16 ± 4.08a,b,c | 27.68 ± 4.65a, f,b, g,c, f,d, g | 27.12 ± 4.7a,b,c,e,d | <.001 |
| Waist circumference (cm) | 91.82 ± 11.87 | 98.61 ± 10.1a | 99.77 ± 13.7a | 95.25 ± 11.91a,b,c | 97.65 ± 11.11a,d | 94.46 ± 12.07a,b,c,d,e | <.001 |
| Hip circumference (cm) | 101.08 ± 9.16 | 104.53 ± 8.24a | 105.28 ± 9.22a,b | 104.7 ± 8.62a,c | 104.29 ± 8.79a,b,c | 103.09 ± 9.44a,c | <.001 |
| Systolic blood pressure (mm Hg) | 120.85 ± 20.7 | 124.99 ± 18.48a | 126.4 ± 21.52a | 121.27 ± 20.25b,c | 127.95 ± 20.16a,d | 119.58 ± 18.6b,c,d,e | <.001 |
| Diastolic blood pressure (mm Hg) | 78.88 ± 10.7 | 80.02 ± 11.36a | 81.76 ± 11.57a | 79.96 ± 11.76b,c | 81.1 ± 12.15a,***,d | 78.06 ± 11.98b,c,d,e | <.001 |
| Glucose (mg/dL) | 86.03 ± 25.8 | 99.04 ± 48.27a | 104.43 ± 34.23a,b | 92.21 ± 53.33a,b,c | 108.92 ± 72.31a,b,d | 89.82 ± 38.01a,b,c,c | <.001 |
| Uric acid (mg/dL) | 4.4 ± 1.2 | 5.09 ± 1.46a | 5.13 ± 1.23a | 4.46 ± 1.3b,c | 5.3 ± 1.41a,b,c,d | 4.47 ± 1.39b,c,e | <.001 |
| Cholesterol (mg/dL) | 175.33 ± 19.26 | 183.01 ± 36.42 | 239.84 ± 25.99a,b | 214.31 ± 27.52a,b,c | 254.28 ± 29.52a,b,c,d | 179.58 ± 38.46a,b,c,d,e | <.001 |
| Triglyceride (mg/dL) | 86.5 (61‐102) | 243 (227‐334) a | 229 (223‐305)a,b | 107 (110‐165)a,b,c | 211 (224‐316)a,b,c,d | 109 (87‐150)a,b,c,e | <.001 |
| HDL(mg/dL) | 53.06 ± 8.15 | 35.95 ± 4.55a | 38.43 ± 3.56a,b | 40.04 ± 3.12a,b,c | 50.42 ± 6.12a,b,c,d | 42.44 ± 9.33a,b,c,d,e | <.001 |
| LDL(mg/dL) | 98.47 ± 20.95 | 94.49 ± 36.21a | 158.21 ± 21.93a,b | 151.31 ± 20.95a,b,c | 165.09 ± 25.14a,b,c,d | 110.97 ± 33.31a,b,c,d,e | <.001 |
| Hs‐CRP (mg/L) | 1.3 (0.86‐2.6) | 1.8 (1.04‐3.59) | 2.27 (1.2‐5.18) a,b | 2.03 (1.29‐4.62)a,b | 2.03 (1.54‐4.62)a,b | 1.5 (1‐3.63)c,d,e | <.001 |
CRP, C‐reactive protein; HDL, high‐density lipoprotein; LDL, low‐density lipoprotein; TG, triglycerides.
Data are presented as mean (SD) and. Differences in variables (aside from age) among dyslipidemia determined using ANCOVA analyses with age included as model covariates.
Normal vs TG↑ & HDL↓, TG↑ & HDL↓ & LDL↑, HDL↓ & LDL↑, TG↑ & LDL↑, TG↑ or HDL↓ or LDL↑ or TC↑.
TG↑ & HDL↓ vs TG↑ & HDL↓ & LDL↑, HDL↓ & LDL↑, TG↑ & LDL↑, TG↑ or HDL↓ or LDL↑ or TC↑.
TG↑ & HDL↓ & LDL↑ vs HDL↓ & LDL↑, TG↑ & LDL↑, TG↑ or HDL↓ or LDL↑ or TC↑.
HDL↓ & LDL↑ vs TG↑ & LDL↑, TG↑ or HDL↓ or LDL↑ or TC↑.
TG↑ & LDL↑ vs HDL↓ or LDL↑ or TC↑.
P‐value < .05 (*)
P‐value < .01 (**)
sex***: We used Chi‐square and P‐value < .001
The results showed that the levels of BMI, WC, HC, SBP, DBP, FBG, hs‐CRP, Uric acid were significantly increased in the dyslipidemic groups and HDL was significantly decrease in the dyslipidemic groups (Table 2).
3.2. Prevalence of dyslipidemia
The mean age was 48.88 ± 7.9 and 47.02 ± 8.54 years for dyslipidemia and control groups, respectively. Among the 8210 subjects who were dyslipidemic, 3100 (37.77%) were male and 5110 (62.23%) were female. According to sex females and males who had dyslipidemia was 86.8% and 78.5%, respectively (Table 1). The proportion of females who had dyslipidemia according to dyslipidemia subgroups was significantly higher than males (P < .001, Table 2, Figure 1).
Figure 1.
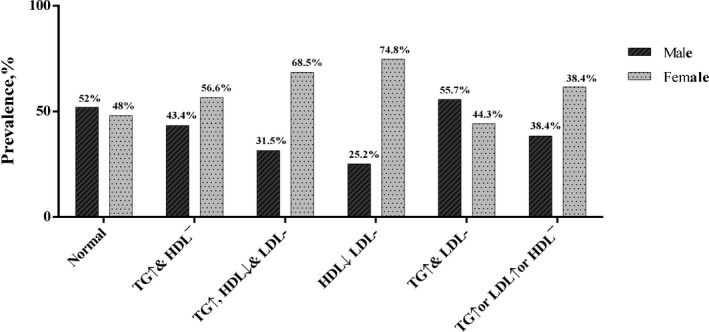
Phenotype of combine dyslipidemia*, *P < .05
There were 1695 subjects with increased TG and low HDL‐C level, 895 with increased TG and low HDL‐C and increased LDL‐C levels, 1069 with low HDL‐C and increased LDL‐C levels, 384 with increased TG and LDL‐C levels, and finally 4167 subjects with only one of these dyslipidemia (increased TG or increased LDL‐C or decreased HDL‐C levels).
We investigated the prevalence of dyslipidemia in subjects with metabolic syndrome, CVD, diabetes and smoking status (Table 3). The results showed that the frequency of dyslipidemia was 98%, 87.1%, 90% and 85.7% in subjects with metabolic syndrome, CVD, diabetes and smoked, respectively.
Table 3.
Status of disease and dyslipidemia
| Normal (n:1412) | TG↑ & HDL↓ (n:987) | TG↑ & HDL↓ & LDL↑ (n:66) | HDL↓ & LDL↑ (n:170) | TG↑ & LDL↑ (n:157) | TG↑ or HDL↓ or LDL↑ or TC↑ (n: 7041) | P‐value | ||
|---|---|---|---|---|---|---|---|---|
| Smoking status | Nonsmoker | 1135 (16.8%) | 1112 (16.5%) | 601 (8.9%) | 766 (11.4%) | 264 (3.9%) | 2861 (42.5%) | .09 |
| Ex‐smoker | 169 (17.3%) | 170 (17.4%) | 93 (9.5%) | 89 (9.1%) | 41 (4.2%) | 414 (42.4%) | ||
| Current‐smoker | 332 (15.6%) | 411 (19.4%) | 198 (9.3%) | 214 (10.1%) | 79 (3.7%) | 888 (41.8%) | ||
| MetS | Yes | 75 (2.0%) | 1385 (36.4%) | 715 (18.8%) | 403 (10.6%) | 183 (4.8%) | 1041 (27.4%) | <.001 |
| No | 1562 (25.9%) | 310 (5.1%) | 159 (2.6%) | 666 (11.1%) | 201 (3.3%) | 3125 (51.9%) | ||
| CVD | Yes | 159 (12.9%) | 255 (20.6%) | 128 (10.4%) | 125 (10.1%) | 50 (4.0%) | 518 (41.9%) | <.001 |
| No | 1451 (17.1%) | 1424 (16.8%) | 756 (8.9%) | 929 (10.9%) | 332 (3.9%) | 3594 (42.4%) | ||
| Diabetes | Yes | 138 (10.0%) | 358 (25.8%) | 181 (13.1%) | 133 (9.6%) | 93 (6.7%) | 483 (34.8%) | <.001 |
| No | 1450 (17.5%) | 1320 (16.0%) | 658 (8.0%) | 919 (11.1%) | 289 (3.5%) | 3628 (43.9%) | ||
CVD, cardiovascular disease; HDL, high‐density lipoprotein; LDL, low‐density lipoprotein; TG triglycerides.
3.3. 10‐year CAD risk
Our results showed that around 15.7% of the study population were at 10 years CVD risk (high ≥20) and it was higher in men than women (P < .001). The results demonstrated that 10‐year CVD risk was higher in subjects with TG↑ and HDL‐C↓ and LDL‐C↑ group compared with other dyslipidemic groups (Figure 2). A logistic regression model investigates the most important lipid determinant of the 10‐year CVD risk. After adjustment for gender and diabetes, TG↑ and HDL↓ and LDL↑ group was the strongest predictor of the 10‐year CVD risk (Table 4).
Figure 2.
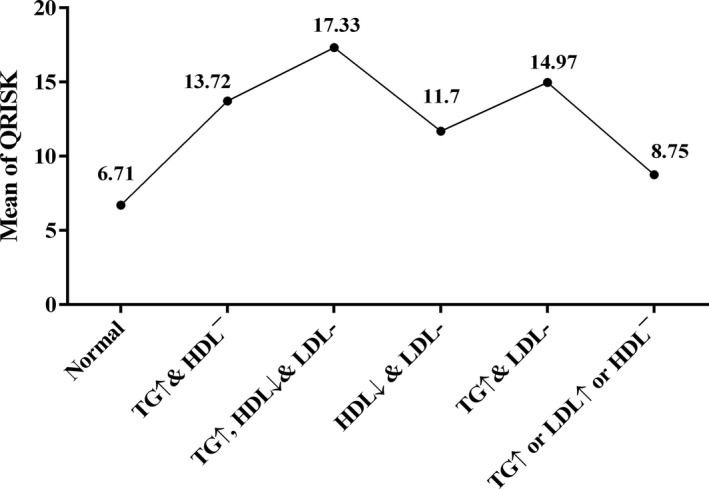
10 years cardiovascular disease (CVD) risk according phenotype of combined and noncombined dyslipidemia*, *P < .05
Table 4.
Unadjusted and multivariate‐adjusted prevalence ratios of the 10 years risk of cardiovascular disease (CVD) (<20(low to moderate) and ≥20 (high)) with different criteria of dyslipidemia
| Dyslipidemia | Unadjusted | Multivariate adjusted by sex | Multivariate adjusted by diabetes |
|---|---|---|---|
| 1 [Reference] | 1 [Reference] | 1 [Reference] | |
| TG↑ & HDL↓ | 3.15 (2.8‐3.53)a | 3.49 (3.09‐3.94)a | 2.79 (2.23‐5.52)a |
| TG↑ & HDL↓ & LDL↑ | 3.69 (3.16‐4.31)a | 4.824 (4.09‐5.69)a | 3.48 (2.95‐4.12)a |
| HDL↓ & LDL↑ | 2.42 (2.13‐2.74)a | 3.3 (2.88‐3.77)a | 2.4 (2.1‐2.74)a |
| TG↑ & LDL↑ | 3.7 (3.23‐4.23)a | 4.23 (3.67‐4.88)a | 3.42 (2.96‐3.96)a |
| TG↑ or HDL↓ or LDL↑ | 3.79 (3.01‐4.78)a | 2.3 (1.79‐2.96)a | 1.78 (1.38‐2.29)a |
| HDL | 0.93 (0.92‐0.94)a | 0.94 (0.93‐0.95)a | 0.93 (0.92‐0.93)a |
| TG | 1.005 (1.004‐1.005)a | 1.007 (1.006‐1.007)a | 1.005 (1.004‐1.006)a |
| LDL | 1.019 (1.018‐1.021)a | 1.015 (1.013‐1.017)a | 1.012 (1.01‐1.14)a |
HDL, high‐density lipoprotein; LDL, low‐density lipoprotein; TG, triglycerides.
P < .001; Adjusted odds ratios (95% CI) were calculated using logistic regression.
4. DISCUSSION
The results of current study showed that prevalence of dyslipidemia was 83.4% among Iranian adults. Moreover, the frequency of dyslipidemia was 98%, 87.1% and 90% in subjects with metabolic syndrome, CVD, and diabetes, respectively. It has been demonstrated that obesity17 and diabetes18 are common secondary causes of dyslipidemia.17, 18 Previous studies showed that overweight and obesity increase the risk of CVD. Central obesity may be associated with the constellation of cardiovascular and metabolic risk factors including hypertriglyceridemia, low HDL‐C levels, increased blood pressure and FBG known as the metabolic syndrome.19
In the current study, we compared the risk of CVD in the people with combined dyslipidemia and healthy subjects. The results showed that 10 ‐year CVD risk was higher in men than women. A large cohort study in UK, showed that the 10‐year risk of CVD was 32% in men and 10% in women.16 This result is consistent with the current study observation.
It has been shown that atherogenic dyslipidemia, the combination of increased triglycerides and low HDL‐C levels, is associated with an increased risk of silent myocardial ischemia and silent CAD in patients with type 2 diabetes mellitus and LDL‐C levels <3.35 mmol/L. Specific management of atherogenic dyslipidemia can help reducing the high residual burden of CVD.20 Our results showed that 24.3% of subjects with atherogenic dyslipidemia were current smokers. Moreover, 25.8% patients with T2DM were atherogenic dyslipidemia. Previous studies demonstrated that the most common risk factors of atherosclerotic heart disease or stroke are dyslipidemia and abnormalities in some coagulation and hemostatic factors, increased blood pressure and smoking.21
The results of current research showed that individuals with TG↑ plus HDL↓ plus LDL↑ had the greatest QRISK compared with other combined dyslipidemia groups. This finding is in consistent with other previous cohort reports. The results of NHANES survey showed that the TC, LDL‐C and glucose levels remain unchanged over multiple cohorts of US children and adolescents, but there has been an increase in TG levels and a decrease in HDL‐C concentrations.22 Impaired triglyceride metabolism can promote atherogenesis. Patients with HTG have decreased HDL‐C levels. Moreover, disturbed fatty acid metabolism is reported in these patients.23 Atherogenic dyslipidemia is reported in more than half of subjects with NAFLD.24 It has been shown that dyslipidemia is strongly associated with related cardiometabolic risk factors. Visceral adiposity in subjects with underlying genetic susceptibility can initiate a cascade of pathophysiologic responses which can result in combined dyslipidemia, insulin resistance/T2DM and NAFLD.25, 26, 27
5. CONCLUSION
The results of current study showed that prevalence of dyslipidemia was 83.4% among Iranian adults. Moreover, metabolic syndrome, CVD, and diabetes are closely related to dyslipidemia. We found that individuals with TG↑ +HDL↓ + LDL↑ had the greatest QRISK compared with other combined dyslipidemic groups. These results call for preventive programs, changing lifestyle based on cultural traditions, and monitoring clinical and metabolic problems in the Mashhad population.
Darroudi S, Saberi‐Karimian M, Tayefi M, et al. Prevalence of combined and noncombined dyslipidemia in an Iranian population. J Clin Lab Anal. 2018;32:e22579 10.1002/jcla.22579
Funding information
This study was supported by grant from Mashhad University of Medical Sciences.
Darroudi and Saberi‐Karimian equally contributed to this work.
Contributor Information
Amir Hossein Sahebkar, Email: sahebkara@mums.ac.ir.
Majid Ghayour‐Mobarhan, Email: ghayourm@mums.ac.ir.
REFERENCES
- 1. National Institutes of Health, National Heart Lung, Blood Institute . Atp iii guidelines at‐a‐glance quick desk reference. NIH publication 2001.
- 2. Mohammadbeigi A, Moshiri E, Mohammadsalehi N, Ansari H, Ahmadi A. Dyslipidemia prevalence in Iranian adult men: the impact of population‐based screening on the detection of undiagnosed patients. World J Mens Health. 2015;33:167‐173. [DOI] [PMC free article] [PubMed] [Google Scholar]
- 3. Tabatabaei‐Malazy O, Qorbani M, Samavat T, Sharifi F, Larijani B, Fakhrzadeh H. Prevalence of dyslipidemia in Iran: a systematic review and meta‐analysis study. Int J Prev Med. 2014;5:373. [PMC free article] [PubMed] [Google Scholar]
- 4. Taheri F, Chahkandi T, Kazemi T, Bijari B, Zardast M, Namakin K. Lipid profiles and prevalence of dyslipidemia in eastern Iranian adolescents, Birjand, 2012. Iran J Med Sci. 2015;40:341. [PMC free article] [PubMed] [Google Scholar]
- 5. Rizzo M, Barylski M, Rizvi AA, Montalto G, Mikhailidis DP, Banach M. Combined dyslipidemia: should the focus be ldl cholesterol or atherogenic dyslipidemia? Curr Pharm Des. 2013;19:3858‐3868. [DOI] [PubMed] [Google Scholar]
- 6. May A, Kuklina E, Yoon P. Prevalence of abnormal lipid levels among youths‐united states, 1999‐2006. Morb Mortal Wkly Rep. 2010;59:29‐33. [PubMed] [Google Scholar]
- 7. Dhuper S, Sakowitz S, Daniels J, Buddhe S, Cohen HW. Association of lipid abnormalities with measures and severity of adiposity and insulin resistance among overweight children and adolescents. J Clin Hypertens. 2009;11:594‐600. [DOI] [PMC free article] [PubMed] [Google Scholar]
- 8. Bell LM, Curran JA, Byrne S, et al. High incidence of obesity co‐morbidities in young children: a cross‐sectional study. J Paediatr Child Health. 2011;47:911‐917. [DOI] [PubMed] [Google Scholar]
- 9. Modelli ME, Cherulli ÁS, Gandolfi L, Pratesi R. Atherosclerosis in young brazilians suffering violent deaths: a pathological study. BMC Res Notes. 2011;4:531. [DOI] [PMC free article] [PubMed] [Google Scholar]
- 10. Taheri F, Kazemi T, Bijari B, Namakin K, Zardast M, Chahkandi T. Prevalence of dyslipidemia among elementary school children in Birjand, east of Iran, 2012. J Tehran Heart Cent. 2016;11:15. [PMC free article] [PubMed] [Google Scholar]
- 11. World Health Organization . Guidelines for the management of dyslipidaemia in patients with diabetes mellitus: Quick reference guide. 2006.
- 12. Aslam F, Haque A, Foody J, Lee LV. Peripheral arterial disease: current perspectives and new trends in management. South Med J. 2009;102:1141‐1149. [DOI] [PubMed] [Google Scholar]
- 13. Ghayour‐Mobarhan M, Moohebati M, Esmaily H, et al. Mashhad stroke and heart atherosclerotic disorder (mashad) study: design, baseline characteristics and 10‐year cardiovascular risk estimation. Int J Public Health. 2015;60:561‐572. [DOI] [PubMed] [Google Scholar]
- 14. Zomorrodian D, Khajavi‐Rad A, Avan A, et al. Metabolic syndrome components as markers to prognosticate the risk of developing chronic kidney disease: evidence‐based study with 6492 individuals. J Epidemiol Community Health 2015;69:594‐598. [DOI] [PubMed] [Google Scholar]
- 15. Emamian M, Avan A, Pasdar A, et al. The lipoprotein lipase s447x and cholesteryl ester transfer protein rs5882 polymorphisms and their relationship with lipid profile in human serum of obese individuals. Gene. 2015;558:195‐199. [DOI] [PubMed] [Google Scholar]
- 16. Collins GS, Altman DG. Predicting the 10 year risk of cardiovascular disease in the United Kingdom: independent and external validation of an updated version of qrisk2. BMJ 2012;344:e4181. [DOI] [PMC free article] [PubMed] [Google Scholar]
- 17. Soler‐Argilaga C, Russell RL, Werner HV, Heimberg M. A possible role of calcium in the action of glucagon, camp and dibutyryl camp on the metabolism of free fatty acids by rat hepatocytes. Biochem Biophys Res Comm. 1978;85:249‐256. [DOI] [PubMed] [Google Scholar]
- 18. Mooradian AD. Dyslipidemia in type 2 diabetes mellitus. Nat Clin Pract Endocrinol Metab. 2009;5:150. [DOI] [PubMed] [Google Scholar]
- 19. Smith SC. Multiple risk factors for cardiovascular disease and diabetes mellitus. Am J Med. 2007;120:S3‐S11. [DOI] [PubMed] [Google Scholar]
- 20. Valensi P, Avignon A, Sultan A, Chanu B, Nguyen MT, Cosson E. Atherogenic dyslipidemia and risk of silent coronary artery disease in asymptomatic patients with type 2 diabetes: a cross‐sectional study. Cardiovasc Diabetol. 2016;15:104. [DOI] [PMC free article] [PubMed] [Google Scholar]
- 21. Sarraf‐Zadegan N, Boshtam M, Rafiei M. Risk factors for coronary artery disease in Isfahan, Iran. Eur J Public Health. 1999;9:20‐26. [Google Scholar]
- 22. Ford ES, Mokdad AH, Ajani UA. Trends in risk factors for cardiovascular disease among children and adolescents in the United States. Pediatrics. 2004;114:1534‐1544. [DOI] [PubMed] [Google Scholar]
- 23. Cockerill GW, Rye K‐A, Gamble JR, Vadas MA, Barter PJ. High‐density lipoproteins inhibit cytokine‐induced expression of endothelial cell adhesion molecules. Arterioscler Thromb Vasc Biol. 1995;15:1987‐1994. [DOI] [PubMed] [Google Scholar]
- 24. Pacifico L, Chiesa C, Anania C, et al. Nonalcoholic fatty liver disease and the heart in children and adolescents. World J Gastroenterol. 2014;20:9055. [DOI] [PMC free article] [PubMed] [Google Scholar]
- 25. Expert Panel on Integrated Guidelines and Risk Reduction in Children . Expert panel on integrated guidelines for cardiovascular health and risk reduction in children and adolescents: summary report. Pediatrics. 2011;128:S213. [DOI] [PMC free article] [PubMed] [Google Scholar]
- 26. Steinberger J, Daniels SR. Obesity, insulin resistance, diabetes, and cardiovascular risk in children. Circulation. 2003;107:1448‐1453. [DOI] [PubMed] [Google Scholar]
- 27. Miller M, Stone NJ, Ballantyne C, et al. Triglycerides and cardiovascular disease. Circulation. 2011;123:2292‐2333. [DOI] [PubMed] [Google Scholar]