Abstract
Background
Transferrin, a major glycoprotein has different isoforms depending on the number of sialic acid residues present on its oligosaccharide chain. Genetic variants of transferrin as well as the primary (CDG) & secondary glycosylation defects lead to an altered transferrin pattern. Isoform analysis methods are based on charge/mass variations. We aimed to compare the performance of commercially available capillary electrophoresis CDT kit for diagnosing congenital disorders of glycosylation with our in‐house optimized HPLC method for transferrin isoform analysis.
Methods
The isoform pattern of 30 healthy controls & 50 CDG‐suspected patients was determined by CE using a Carbohydrate‐Deficient Transferrin kit. The results were compared with in‐house HPLC‐based assay for transferrin isoforms.
Results
Transferrin isoform pattern for healthy individuals showed a predominant tetrasialo transferrin fraction followed by pentasialo, trisialo, and disialotransferrin. Two of 50 CDG‐suspected patients showed the presence of asialylated isoforms. The results were comparable with isoform pattern obtained by HPLC. The commercial controls showed a <20% CV for each isoform. Bland Altman plot showed the difference plot to be within +1.96 with no systemic bias in the test results by HPLC & CE.
Conclusion
The CE method is rapid, reproducible and comparable with HPLC and can be used for screening Glycosylation defects.
Keywords: capillary electrophoresis, CDT kit, congenital disorders of glycosylation, HPLC, transferrin isoforms
1. Introduction
Capillary electrophoresis (CE) was first introduced in 1980s and has emerged as a powerful separation technique which is competitive/complimentary to HPLC.1 It is a versatile technique with low maintenance cost and hence suitable for routine clinical laboratories. Its applications in clinical laboratory vary from tests such as protein separation, determination of hemoglobin variants, and classification of gammopathies2 to detect carbohydrate‐deficient transferrin in alcohol abusers.3, 4
Carbohydrate‐deficient transferrin (CDT) collectively refers to the desialylated transferrin isoforms. These isoforms lack sialic acid residues and are deficient in their oligosaccharide chain.5 Transferrin (Tf) is an abundant serum glycoprotein with two N‐linked disialylated biantennary oligosaccharide chains thus most Tf is in tetrasialo form followed by other minor isoforms which vary depending on the number of oligosaccharide chains.6 Hyposialylation or desialylation of transferrin produces altered isoform pattern which is a diagnostic marker for alcohol abuse.5, 7 Patterns similar to these also occur in other secondary glycosylation defects like fructosemia and galactosemia8 and primary defects i.e. Congenital Disorders of Glycosylation (CDG).9
CDG are a group of <40 disorders with multisystemic clinical spectrum ranging from severe mental retardation with dysmorphic features or mild retardation to being asymptomatic in some cases.10 Symptoms observed are highly variable, however, a few common presenting features include hypotonia, skin manifestations, cutix laxa, coagulopathies, inverted nipples, cerebellar atrophy, and hypoplasia etc. These patients show global developmental delay (GDD) often with or without neurological involvement.11, 12 These features are overlapping with several non‐genetic conditions and hence screening for CDG would assist in all unexplained conditions. Transferrin being the most abundant well‐characterized glycoprotein, its isoform analysis is used as an initial test to rule out CDG.13
Transferrin isoforms are being detected by techniques such as SDS‐PAGE14, 15, 16 Isoelectric focusing (IEF),17 HPLC6, 18, 19, 20 & Mass Spectrometry.21 Among these SDS‐PAGE and IEF are laborious while TMS is expensive. HPLC being a versatile technique is a preferred option, however, with more number of tests being optimized on HPLC22, it is usually an over occupied equipment. Thus, a technique with a minimal manual intervention would be a feasible option.
Capillary electrophoresis‐based commercial kits are now available for detecting carbohydrate‐deficient transferrin (CDT) among alcoholics. Because the isoform pattern in CDG is similar to the CDT observed in alcoholics, CE‐based assay may emerge as a viable option for CDG detection. Thus, we aimed to assess the utility of CDT kit in detecting glycosylation defects and also compared its performance with our in‐house HPLC‐based method for detecting Congenital Disorders of Glycosylation.
2. Materials and Methods
Present study on method verification and comparison for transferrin isoforms was carried out in biochemistry section of the institute and was approved by the Institutional review board. Serum and plasma samples were collected from 30 (four males & 26 females) non‐alcoholic healthy individuals for assessment of CDT kit and obtaining the isoform range in them. To detect its efficacy to identify the altered isoform pattern in CDG, blood samples were obtained from 50 patients clinically suspected to have CDG. The samples were stored at −20°C immediately after separation, and were analyzed within 6‐8 weeks. Hemolysis interferes with the separation and hence hemolyzed samples were not included in the study. All the 80 samples (30 controls and 50 patients) were also analyzed usingthe in‐house developed HPLC method for separation of transferrin isoforms.
2.1. Chemicals
Carbohydrate‐Deficient Transferrin kit (CDT MiniCap kit 2208) for Capillary Electrophoresis was obtained from Sebia Inc (Norcross, GA, USA). For HPLC, Iron (III) chloride hexahydrate, bis‐tris and neuraminidase were obtained from Sigma Aldrich (St. Louis, MO, USA); trisodium nitrilo triacetic acid and dextran sulfate were from Santacruz Biotech (Texas, USA) & calcium chloride and sodium chloride were from Merck (Kenilworth, NJ, USA). All chemicals were of analytical grade and reagents were prepared in HPLC grade Milli Q water obtained from Elix® Milli Pore system.
2.2. Analysis on CE
Analysis was carried out with a MINICAP electrophoresis system (Sebia) with an ultraviolet absorbance detector at 200 nm wavelength. The buffer system of the MINICAP CDT method was used for the initial activation of capillaries. It is an automated system with in line dilution and processing of samples. Samples were injected at the anodic end followed by an 8 minute separation and detection at 200 nm. Isoform peaks were auto‐identified & AUCs were calculated with the ‘Phoresis’ software.
2.2.1. Method evaluation
Normal and pathological controls provided in the kit were analyzed in duplicates with each batch. Precision and reproducibility was assured by auto‐integration of each isoform by the software. For accuracy and imprecision, AUCs of isoforms of the controls were compared with the values provided in the kit insert. High/Pathological control provided in the kit was used for the identification of desialylated isoforms. A healthy individual's sample was injected both before and after the pathological control to assess the carryover in the capillaries. Sensitivity of the method was determined from precision of percentage AUC of minor isoforms present in normal and high control. The isoform fractions of all healthy controls and CDG‐suspected patients were compared with that obtained from HPLC.
2.3. Analysis on HPLC
Transferrin isoforms were separated and detected using ion‐exchange chromatography as described by Quintana et al.6 Before separation on HPLC, plasma transferrin was iron saturated with Fe3+ and was treated with Calcium chloride‐Dextran sulfate mixture for the removal of lipids. The isoforms were then separated using SOURCE 15Q PE 4.6/100 anion exchange column from GE Healthcare. The separation was achieved by salt gradient elution at 40ºC followed by isoform detection at 470 nm.
Transferrin calibrator of 273 mg/dL concentration from the transferrin estimation kit of BECKMAN IMMAGE system (kit no 449560) and a healthy control sample were processed for isoform separation and peak identification. A healthy control's sample was then incubated at 37°C with 0.2 U/L of neuraminidase. The incubation was done for varying time points to ensure desialylation of transferrin so as to mimic isoform pattern observed in CDG patients. The separation of these isoforms was then performed on HPLC for detection of asialylated isoforms. For intra‐day and inter‐day precision, an aliquot of pooled serum of healthy control samples was analyzed with every batch.
2.4. Verification of test results
The test results for three healthy controls & two CDG‐suspected patients were also verified by established methods for CDG diagnosis like IEF and MALDI TOF.23 The work was carried out at the Department of Neurology, Laboratory of Genetic, Endocrine and Metabolic diseases, Radboud University Medical Center, Nijmegen, Netherlands. The proficiency testing samples (n=3) from ERNDIM, received for 2015‐A cycle were also analyzed by CE and HPLC and the patterns were compared with peer group results.
2.5. Statistical analysis for method comparison
Transferrin isoform patterns for healthy controls and patients suspected of CDG obtained by both the methods were compared for similarity. Statistical analysis and comparison plots were generated using Medcalc version 15.4. Passing & Bablok regression and Bland Altman plot comparing the % Area Under Curve (AUC) of all the isoforms was plotted to assess the statistical correlation between HPLC and CE.
3. Results
3.1. Isoform detection on capillary electrophoresis
The kit controls showed well‐differentiated isoform fractions with a predominant tetrasialo transferrin peak in normal control and well‐differentiated minor fractions of desialylated isoforms in pathological controls. The isoform pattern of a healthy individual and pathological control is shown in Figure 1. Auto‐integration of the peaks by Phoresis software was obtained for the samples assuring precision and reproducibility of the CDT kit. The % AUC of each isoform fraction in both the controls was within the defined range and showed an intra‐day & inter‐day %CV of <20 for major isoforms (Table 1). Normal control did not show any alteration in transferrin profile when injected after a pathological control suggesting no or insignificant carryover. Sensitivity of the CE system to detect isoforms by the software was obtained to be ≤0.6% of total transferrin. The isoform fractions in 30 healthy individuals were comparable with the reference ranges reported in literature3 (Table 2). Of the 50 suspected patients, 96% of patients showed a normal isoform pattern thus ruling out N‐glycosylation defects. Two patients had an abnormal pattern suggestive of CDG. One patient showed an increase in disialotransferrin while the second patient had an increase of both disialotransferrin and asialotransferrin. There was a proportionate decrease in tetrasialo transferrin in both these patients (Figure 2).
Figure 1.
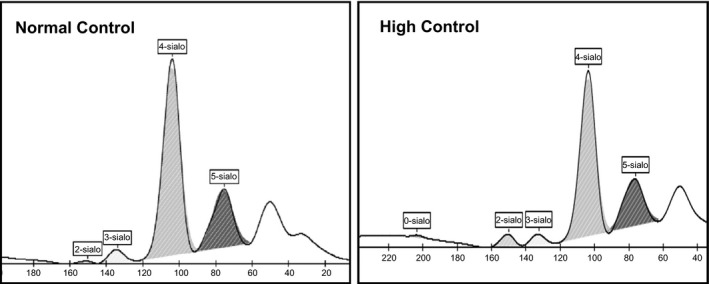
Transferrin isoforms of normal and high kit controls by CE
Table 1.
Tf‐CE: CV of each sialotransferrin in inter‐day and intra‐day assays
| Level of control | %CV of transferrin isoforms | ||||||
|---|---|---|---|---|---|---|---|
| Asialo | Mono | Disialo | Trisialo | Tetrasialo | Pentasialo | ||
| Inter‐day | Normal | ‐ | 11.92 | 4.08 | 4.72 | 18.30 | |
| High | 31.46 | ‐ | 6.29 | 9.03 | 1.84 | 8.58 | |
| Intra‐day | Normal | ‐ | 8.32 | 2.32 | 0.57 | 1.90 | |
| High | 12.86 | ‐ | 5.55 | 7.44 | 0.62 | 3.48 | |
Table 2.
Reference range for transferrin Isoforms by CE
| Transferrin isoforms in % AUC | ||||||
|---|---|---|---|---|---|---|
| Asialo | Monosialo | Disialo | Trisialo | Tetrasialo | Pentasialo | |
| Controlsa n=30 | nd | nd | 0.74 (0.35) | 2.8 (0.8) | 82.6 (2.4) | 13.7 (2.6) |
| Literature reported range3 | nd | nd | 0.5 (0.2) | 4.9 (0.9) | 79 (2) | 12.8 (1) |
Mean (SD); nd – not detected; n – no of subjects.
Figure 2.
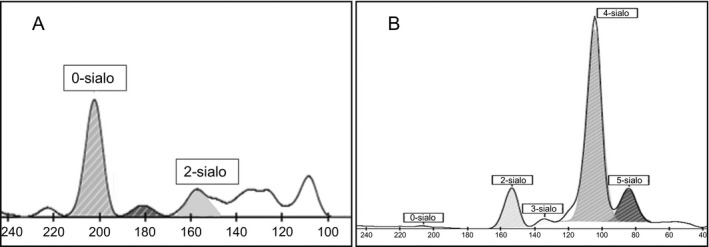
Altered transferrin isoforms of positive patients (A & B) by Capillary Electrophoresis
3.2. Isoform detection on HPLC
Transferrin calibrator and healthy controls showed well‐differentiated isoform fractions with predominant tetrasialo transferrin peak followed by pentasialo, trisialo, and disialotransferrin peaks (Figure 3.1). In vitro desialylation of healthy control plasma with neuraminidase over different time points showed a gradual increase in asialylated transferrin isoforms with a proportional decrease of tetrasialo transferrin (Figure 3.2).
Figure 3.
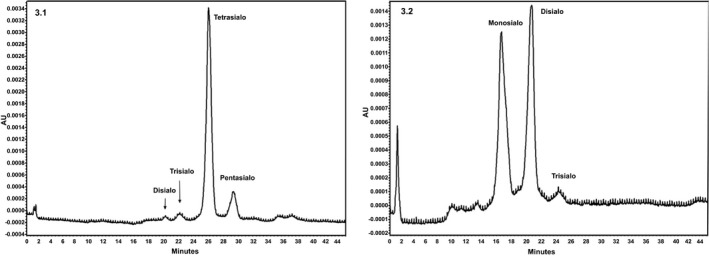
Chromatograms representing the separation of different transferrin isoforms (3.1) Control plasma showing normal pattern of transferrin isoforms (3.2) Neuraminidase‐treated control plasma showing disialylated isoforms
The % AUC for each isoform fraction of pooled control plasma showed an intra‐day and inter‐day %CV of <20. The isoform pattern of all the 30 healthy controls and clinically suspected patients showed comparable results with CE (Table 3). Abnormal isoform pattern obtained in CE showed similar results with HPLC (Figure 4).
Table 3.
Comparable results obtained by both the methods
| Transferrin isoforms in % AUC | |||||||
|---|---|---|---|---|---|---|---|
| Asialo | Monosialo | Disialo | Trisialo | Tetrasialo | Pentasialo | ||
| Healthy controls (n=30) | |||||||
| CEa | ‐ | ‐ | 0.2‐1.8 | 1.5‐4.7 | 76‐88 | 7.8‐17 | |
| HPLCa | ‐ | ‐ | 0.4‐2.4 | 1.6‐6.6 | 81‐94 | 3.0‐15 | |
| CDG‐suspected patients (n=50) | |||||||
| Patients with normal isoform pattern (n=48) | |||||||
| CE | ‐ | ‐ | 0.3‐1.1 | 0.2‐4.0 | 70.5‐84.4 | 11‐26 | |
| HPLC | ‐ | ‐ | 0.4‐1.9 | 0.7‐4.8 | 71.0‐90 | 5.2‐16 | |
| Patients with altered isoform pattern (n=2) | |||||||
| CE | A | 91.5 | ‐ | 8.5 | ‐ | ‐ | ‐ |
| B | ‐ | ‐ | 13.6 | 1 | 75.1 | 10 | |
| HPLC | A | 54.73 | ‐ | 45.27 | ‐ | ‐ | ‐ |
| B | ‐ | ‐ | 15.01 | 3.35 | 70.83 | 10.81 | |
AUC, Area Under Curve; n, no of controls/patients; A, Patient 1; B, Patient 2.
Range.
[Corrections added on April 10, 2017, after first online publication: Monosialo and Disialo data were changed for CE (A) and HPLC (A) for patients with altered isoform pattern (n=2).]
Figure 4.
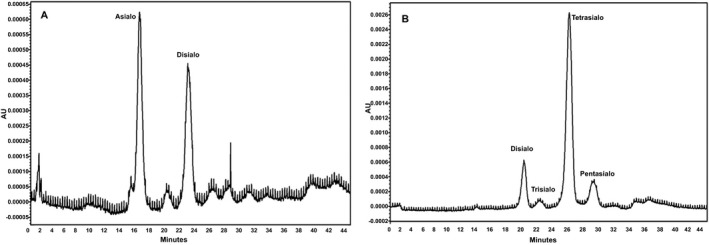
Altered transferrin isoforms of positive patients (A & B) by HPLC
3.3. Verification of results
IEF and MALDI TOF (Quadrapole Time of Flight—QTOF) results of three healthy controls and two CDG‐suspected patients showing an abnormal pattern on CE & HPLC showed consistent results, i.e. normal glycosylation for healthy controls and the presence of disialylated isoforms in patients. Our ERNDIM proficiency testing sample results for the year 2015 cycle A also qualified the peer group results. A normal isoform pattern for sample no. 1 (Figure S1) was obtained only by HPLC as the quantity was insufficient for analysis with CE. Sample no. 2 showed a pattern suggestive of CDG type I (Figure S2) while sample no. 3 showed a normal isoform pattern (Figure S3) by both HPLC & CE. .
3.4. Statistical comparison
The Passing & Bablok regression analysis showed a statistically non‐significant difference (y=0.30+0.23x; P=.05, y=0.03+0.79x; P=.54, y=9.96+0.85x; P=.97, y=2.66+1.08x; P=.84 for di, tri, tetra and penta sialo transferrin respectively) between the two methods for all isoforms. The Bland Altman plot also showed that the difference plots were within ±1.96 for each isoform with no systemic bias in the test results by HPLC & CE (Figure 5).
Figure 5.
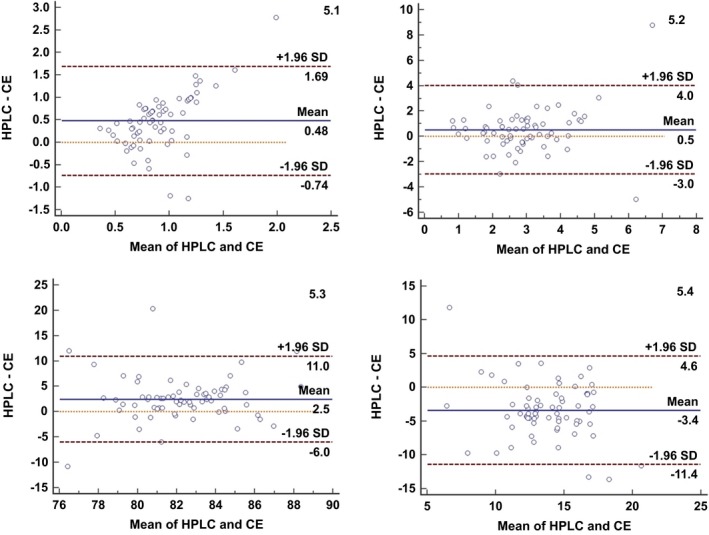
Bland‐Altman plot showing evenly distributed transferrin isoforms values across the mean. (5.1‐Disialotransferrin; 5.2‐Trisialotransferrin; 5.3‐Tetrasialotransferrin; 5.4‐Pentasialotransferrin)
4. Discussion
Transferrin, an abundant glycoprotein exhibits microhetrogeneity because of variable sialic acid residues attached to its glycan chains.24 Among the various isoforms, tetrasialotransferrin is the most predominant isoform followed by penta, tri, and disialotransferrin. Glycosylation defects both primary and secondary result in an altered isoform pattern which is used for diagnosis. Several separation methods such as IEF, HPLC, and CE & mass spectrometry have been used for the detection of isoforms. IEF has been abundantly used since 1980s. However, it has several limitations such as being labor intensive with subjective interpretation5 and is also expensive because of the anti‐sera and stains used for analysis.
Capillary electrophoresis performs separation of isoforms at high voltage based on electric charge and molecular mass. For Tf separation on CE, latest migrating isoform presents the most negative electric charge which is attributable to the number of sialic acid residues.4 In the present study, we have verified the performance of CDT kit on CE. This closed system analyzes samples directly unlike HPLC where samples are treated manually for iron saturation and delipidification. This reduces manual errors and time required for sample pre‐treatment. The reproducibility and reliability of the method was qualified by obtaining <20% AUC for major isoforms of the kit controls. However, for asialotransferrin %CV for AUC was 31.5. This may have been because of the minor proportion of this fraction in the pathological control. A similar increase in %CV for minor isoforms has been reported in HPLC.6 There was a minimal variation in the AUC of the normal controls analyzed alternating to the pathological control ensuring minimal carry over.
Our HPLC method was optimized to detect all isoforms. This was confirmed by neuraminidase treatment where in the presence of desialylated isoforms was directly proportional to the incubation time with neuraminidase. A similar neuraminidase‐treated transferrin isoform variation has also been reported by Helander et al.25 The isoforms showed a <20% CV for AUC of each isoform in pooled plasma except for disialotransferrin which had a %CV of 21.5. This may be because of the minor proportion of this isoform. Quintana et al.6 have also reported a %CV of 21.8 for disialotransferrin. However, for CE our %CV for disialotransferrin is 8.3 & 11.9 for intra‐day and inter‐day, respectively, suggesting the reproducibility of CE even for minor isoforms.
The CE results were comparable with our in‐house developed HPLC‐based assay wherein both healthy controls and the CDG‐suspected patients showed similar results. The variation between AUC of all the isoforms by both methods was statistically non‐significant.
In IEF, the isoelectric point of transferrin is determined by its glycosylation status while MALDI TOF assesses the extent of glycosylation of transferrin depending on the number of glycan chains present on the various glycoforms. The results for all five samples, i.e. three healthy controls and two patients with altered isoform patterns on both CE & HPLC showed consistent results with MALDI TOF. Proficiency testing samples processed by CE and HPLC in our laboratory also qualified the ERNDIM cycle review results thereby validating our methods.
Out of the 50 CDG‐suspected cases recruited in our study, two patients had an abnormal transferrin isoform pattern suggesting N‐Glycosylation defect. . Both these patients had a classic clinical presentation suggestive of CDG. Patient A with an increased asialotransferrin & disialotransferrin had GDD, seizures, recurring diarrhea with corneal clouding while patient B with a six‐fold increase in disialotransferrin presented with GDD, inverted nipples, broad base gait and up‐slant eyes.
To the best of our knowledge, these are the first cases of CDG detected and reported from India. One case of Indian origin has been reported by Newell et al.26 In our small study group of 50 patients, around 4% were detected to have CDG. The results are much higher as compared with 0.66% i.e 10 out of 1500 analyzed per year by Bruneel et al.27 2016. This variation may be attributed to the sample size (n=50) in our study. However, 4% positive results obtained by us may suggest that CDG are underdiagnosed in our country. It would be worthwhile to assess the transferrin isoform pattern in suspected cases for which basic CDG screening should be widely available in clinical laboratories. Further confirmation can be performed in referral Biochemical genetics laboratory.
Carchon et al.28 have reported CE to be comparable with IEF. Our CE results are also consistent with HPLC & MALDI TOF and suggest that CE qualifies as screening test for detecting CDG. CE offers convenience of direct sample analysis, however, the presence of other serum proteins may interfere with the separation. Coelution of CRP with monosialotransferrin has already been reported by Legros et al.3 In our patients, we did not get an increase in monosialo transferrin. Interference of C3 fractions particularly in the samples stored at room temperature have been reported.29 To avoid this degradation and interference we had analyzed the samples within 8 weeks of collection and had preserved them at −20°C until analysis. Genetic variants of transferrin may also give pattern similar to that obtained for CDG. In such cases, the presence of variant can be ruled out analyzing the parental samples and referring samples to referral BGLs for biochemical/enzymatic methods.
Quintana et al.6 have compared cost effectiveness of IEF with HPLC and have concluded that though initial investment in HPLC is more as compared with IEF, the overall cost of test per sample is 50% lesser than that of IEF. Both HPLC & CE have several applications in clinical laboratories and have become a method of choice. CE being fully automated is less labor intensive as compared with IEF & HPLC.
In our experience both HPLC & CE are suitable for screening glycosylation defects and can be adapted by the laboratories based on their equipment accessibility. We have assessed the use of commercially available CDT kit meant for detection of alcoholics for its efficacy to diagnose primary glycosylation defects (CDG). This alleviates the laboratories efforts to standardize the method and also allows easy adoption of the commercial kit. This kit can be adopted by the clinical chemistry laboratories for initial screening of CDG. The patients with an abnormal pattern can then be referred to referral centers for a confirmed enzyme or molecular diagnosis.
Supporting information
Acknowledgments
Resources: We acknowledge support extended by the National Health & Education Society for the funding, healthy volunteers for participating, patients, and their families for providing study samples and clinicians for referring patients.
Technical support: We thank Dr. Dirk Lefeber for processing samples by IEF & MALDI TOF for method validation and providing valuable inputs throughout the study.
Proficiency Testing: P. D. Hinduja Hospital and MRC acknowledge the use of data derived from ERNDIM EQA materials in this paper. The use of ERNDIM EQA materials does not imply that ERNDIM endorses the methods used or the scientific validity of the findings in this paper. ERNDIM (www.erndim.org) is an independent, not for profit foundation that provides EQA schemes in the field of inborn errors of metabolism with the aim of improving diagnosis, treatment and monitoring of inherited metabolic diseases.
Dave MB, Dherai AJ, Udani VP, Hegde AU, Desai NA, Ashavaid TF. Comparison of transferrin isoform analysis by capillary electrophoresis & HPLC for screening congenital disorders of glycosylation. J Clin Lab Anal. 2018;32:e22167 10.1002/jcla.22167
References
- 1. Deyl Z, Miksik I, Tagliaro F. Advances in capillary electrophoresis. Forensic Sci Int. 1998;92:89–124. [DOI] [PubMed] [Google Scholar]
- 2. Landers J. Clinical capillary electrophoresis. Clin Chem. 1995;41:495–509. [PubMed] [Google Scholar]
- 3. Legros F, Nuyens V, Minet E, et al. Carbohydrate‐deficient transferrin isoforms measured by capillary zone electrophoresis for detection of alcohol abuse. Clin Chem. 2002;48:2177–2186. [PubMed] [Google Scholar]
- 4. Wuyts B, Delanghe J, Kasvosve I, Wauters A, Neels H, Janssens J. Determination of carbohydrate‐deficient transferrin using capillary zone electrophoresis. Clin Chem. 2001;47:247–255. [PubMed] [Google Scholar]
- 5. Stibler H. Carbohydrate‐deficient transferrin in serum: a new marker of potentially harmful alcohol consumption reviewed. Clin Chem. 1991;37:2029–2037. [PubMed] [Google Scholar]
- 6. Quintana E, Navarro‐Sastre A, Hernández‐Pérez J, et al. Screening for congenital disorders of glycosylation (CDG): transferrin HPLC versus isoelectric focusing (IEF). Clin Biochem. 2009;42:408–415. [DOI] [PubMed] [Google Scholar]
- 7. Helander A, Eriksson G, Stibler H, Jeppsson JO. Interference of transferrin isoform types with carbohydrate‐deficient transferrin quantification in the identification of alcohol abuse. Clin Chem. 2001;47:1225–1233. [PubMed] [Google Scholar]
- 8. Pronicka E, Adamowicz M, Kowalik A, et al. Elevated carbohydrate‐deficient transferrin (CDT) and its normalization on dietary treatment as a useful biochemical test for hereditary fructose intolerance and galactosemia. Pediatr Res. 2007;62:101–105. [DOI] [PubMed] [Google Scholar]
- 9. Lefeber D, Morava E, Jaeken J. How to find and diagnose a CDG due to defective N‐glycosylation. J Inherit Metab Dis. 2011;34:849–852. [DOI] [PMC free article] [PubMed] [Google Scholar]
- 10. Freeze H, Eklund E, Ng B, Patterson M. Neurology of inherited glycosylation disorders. Lancet Neurol. 2012;11:453–466. [DOI] [PMC free article] [PubMed] [Google Scholar]
- 11. Supraha Goreta S, Dabelic S, Dumic J. Insights into complexity of congenital disorders of glycosylation. Biochem Med. 2012;22:156–170. [DOI] [PMC free article] [PubMed] [Google Scholar]
- 12. Eklund E, Freeze H. The congenital disorders of glycosylation: a multifaceted group of syndromes. NeuroRx. 2006;3:254–263. [DOI] [PMC free article] [PubMed] [Google Scholar]
- 13. Heywood W, Mills P, Grunewald S, et al. A new method for the rapid diagnosis of protein N‐linked congenital disorders of glycosylation. J Proteome Res. 2013;12:3471–3479. [DOI] [PubMed] [Google Scholar]
- 14. Guillard M, Wada Y, Hansikova H, et al. Transferrin mutations at the glycosylation site complicate diagnosis of congenital disorders of glycosylation type I. J Inherit Metab Dis. 2011;34:901–906. [DOI] [PMC free article] [PubMed] [Google Scholar]
- 15. Marquardt T, Freeze H. Congenital disorders of glycosylation: glycosylation defects in man and biological models for their study. Biol Chem. 2001;382:161–177. [DOI] [PubMed] [Google Scholar]
- 16. Strahler J, Rosenblum B, Hanash S, Butkunas R. Separation of transferrin types in human plasma by anion‐exchange high‐performance liquid chromatography. J Chromatogr A. 1983;266:281–291. [DOI] [PubMed] [Google Scholar]
- 17. Lacey J, Bergen H, Magera M, Naylor S, O'Brien J. Rapid determination of transferrin isoforms by immunoaffinity liquid chromatography and electrospray mass spectrometry. Clin Chem. 2001;47:513–518. [PubMed] [Google Scholar]
- 18. Helander A, Husa A, Jeppsson J. Improved HPLC method for carbohydrate‐deficient transferrin in serum. Clin Chem. 2003;49:1881–1890. [DOI] [PubMed] [Google Scholar]
- 19. Renner F, Kanitz R. Quantification of carbohydrate‐deficient transferrin by ion‐exchange chromatography with an enzymatically prepared calibrator. Clin Chem. 1997;43:485–490. [PubMed] [Google Scholar]
- 20. Simonsson P, Lindberg S, Alling C. Carbohydrate‐deficient transferrin measured by high performance liquid chromatography and CDTectTM immunoassay. Alcohol Alcohol. 1996;31:397–402. [DOI] [PubMed] [Google Scholar]
- 21. Marquardt T, Denecke J. Congenital disorders of Glycosylation: review of their molecular bases, clinical presentations and specific therapies. Eur J Pediatr. 2003;162:359–379. [DOI] [PubMed] [Google Scholar]
- 22. Bird I. High performance liquid chromatography: principles and clinical applications. BMJ. 1989;299:783–787. [DOI] [PMC free article] [PubMed] [Google Scholar]
- 23. Van Scherpenzeel M, Steenbergen G, Morava E, Wevers R, Lefeber D. High‐resolution mass spectrometry glycoprofiling of intact transferrin for diagnosis and subtype identification in the congenital disorders of glycosylation. Transl Res. 2015;166:639–649. [DOI] [PubMed] [Google Scholar]
- 24. Arndt T, Kropf J, Brandt R, et al. CDTect‐RIA and CDTect‐EIA for determination of serum carbohydrate‐deficient transferrin compared. Alcohol Alcohol. 1998;33:639–645. [DOI] [PubMed] [Google Scholar]
- 25. Helander A, Bergström J, Freeze H. Testing for congenital disorders of glycosylation by HPLC measurement of serum transferrin glycoforms. Clin Chem. 2004;50:954–958. [DOI] [PubMed] [Google Scholar]
- 26. Newell J, Seo N, Enns G, McCraken M, Mantovani J, Freeze H. Congenital disorder of glycosylation Ic in patients of Indian origin. Mol Genet Metab. 2003;79:221–228. [DOI] [PubMed] [Google Scholar]
- 27. Bruneel A, Dupre T, Chaabouni T, Dupont A, Mansour H, Seta N. Beware of abnormal capillary electrophoresis patterns of serum transferrin: congenital disorders of Glycosylation (CDG) type I can be associated with a protein variant. J Inherit Metab Dis. 2016;39:225. [Google Scholar]
- 28. Carchon HA, Chevigné R, Falmagne JB, Jaeken J. Diagnosis of congenital disorders of glycosylation by capillary zone electrophoresis of serum transferrin. Clin Chem. 2004;50:101–111. [DOI] [PubMed] [Google Scholar]
- 29. Davis N, West C, Ho M. Effect of aging of serum on quantitation of complement component C3. Clin Chem. 1972;18:1485–1487. [PubMed] [Google Scholar]
Associated Data
This section collects any data citations, data availability statements, or supplementary materials included in this article.
Supplementary Materials


