

Abstract
Background
Several studies have shown that platelet‐to‐lymphocyte ratio (PLR) is a prognostic factor for various cancers. However, there is no study about the role of PLR in predicting response to first‐line chemotherapy of metastatic gastric cancer. Therefore, this study aimed to establish whether PLR is associated with the response to first‐line chemotherapy and survival in patients with metastatic gastric cancer.
Methods
We enrolled 273 patients diagnosed with metastatic gastric cancer. The best cut‐off value of PLR to predict chemotherapeutic response was chosen by receiver operating characteristic (ROC) curve analysis. Prognostic significance was determined using the log‐rank test and multivariate Cox regression analysis.
Results
Based on the cut‐off value of PLR, patients were divided into a low PLR group and high PLR group. In logistic regression analysis, the low PLR group had a significantly higher disease control rate than the high PLR group had (91.3 vs 76.1%, P=.002), and PLR was an independent risk factor for response to first‐line chemotherapy (odds ratio [OR]: 3.256; 95% confidence interval [CI]: 1.521‐6.969; P=.002). The low PLR group had significantly longer overall survival (OS) than the high PLR group had (13.4 vs 9.2 months; P=.020). Multivariate survival analysis showed that PLR was significantly associated with OS [hazard ratio (HR): 1.002; 95% CI: 1.000‐1.003; P=.020].
Conclusions
Pre‐treatment PLR is associated with the response rate to first‐line chemotherapy and survival outcomes in patients with metastatic gastric cancer.
Keywords: chemotherapy, gastric cancer, platelet‐to‐lymphocyte ratio, tumor response
1. Introduction
Gastric cancer is one of the most common malignancies worldwide, and almost half of the total occurs in Eastern Asia (mainly in China).1 Although diagnosis and treatment have improved greatly, two‐thirds of gastric cancer patients are diagnosed with metastatic disease.2 At present, the major treatment options for metastatic gastric cancer include chemotherapy and targeted therapy. However, the response rate to first‐line treatment is only 27%‐54%.3, 4, 5 Therefore, it is important to find biomarkers that can distinguish patients who might benefit from potentially efficacious treatment. Human epidermal growth factor receptor (HER) 2 is the only molecular biomarker currently in clinical use to tailor patients to targeted therapy with trastuzumab.5 However, chemotherapeutic drugs still have no consistent and recognized biomarkers.
It is reported that some clinical variables have the potential to influence therapeutic effects in gastric cancer. These variables fit broadly into three categories: patient‐ and tumor‐related characteristics and host reaction to the tumor. The patient‐related factors include performance status (PS) and complications, and the tumor‐related factors include tumor differentiation, size and localization.6, 7 The host‐related factors are usually systemic inflammatory response. More recently, there has been a growing interest in systemic inflammatory response, which is thought to have an important role in tumor development and growth through several mechanisms.8 The tumor, host‐derived stromal tissues containing host inflammatory cells, and blood vessels that have a complex microenvironmental host‐tumor relationship may lead to tumor growth, progression, and metastasis.9 On the basis of these findings, a variety of inflammatory markers have been investigated. Among these inflammatory parameters, the lymphocyte response has an effect on suppression of cancer progression.10 Platelets might be involved in the inflammatory reaction by releasing growth factors or increasing angiogenesis.9, 10
Thus, the platelet‐to‐lymphocyte ratio (PLR) might provide more information in clinical practice. In recent studies, peripheral PLR has been shown as a prognostic indicator in several types of cancer, including non‐small lung cancer, gastric cancer, colorectal cancer, ovarian clear cell carcinoma, prostate cancer and pancreatic cancer.11, 12, 13, 14, 15, 16 Studies of the role of PLR in gastric cancer had some limitations that need to be taken into account. First, most of them only selected patients with resectable early‐stage rather than metastatic gastric cancer.16, 17 Second, even in patients with metastatic gastric cancer, chemotherapy was not considered or mentioned.18, 19 Nevertheless, chemotherapy regimen should be considered as an important confounding factor. Third, almost all the studies focused on the correlation between PLR and survival outcomes such as overall survival (OS), cancer‐special survival or progression‐free survival.16, 17
There are no reports on the relationship between PLR and chemotherapeutic response in metastatic gastric cancer. Therefore, the objective of this study was to explore whether pre‐treatment PLR is associated with the response to first‐line chemotherapy and survival in patients with metastatic gastric cancer.
2. Materials and Methods
2.1. Patients
Between May 2005 and December 2013, 335 patients received first‐line palliative chemotherapy for metastatic gastric cancer at the First Hospital of China Medical University. The criteria for patient inclusion were: (1) age ≥18 years; (2) histologically confirmed diagnosis of gastric cancer; (3) presence of evaluable disease or measurable lesions; (4) at least two cycles of chemotherapy and treatment response evaluation after two cycles; (5) Eastern Cooperative Oncology Group (ECOG) PS ≤2; (6) clinicopathological data available at the beginning of chemotherapy; and (7) no prior anti‐tumor treatment in ~6 months, such as radiotherapy or chemotherapy. Patients with esophageal cancer, squamous cell carcinoma, or gastroesophageal junction tumors were excluded. Finally, 273 patients met the inclusion criteria. This study was approved by the Ethical Standards Committee of the First Hospital of China Medical University. Written informed consent was obtained from each participant before enrollment.
All patients underwent laboratory tests and chest and abdominal pelvic computed tomography. History taking and physical examination revealed no systemic infection and fever before patients started the first cycle of chemotherapy. OS was counted from the time of metastasis to the time of death or last follow‐up visit, which was 27 July 2014.
2.2. Measurement of PLR
Venous blood was sampled before the first cycle of chemotherapy and collected in EDTA‐containing tubes. Baseline PLR was calculated as the platelet count divided by the lymphocyte count.
2.3. Treatment and response evaluation
All the patients received standardized palliative first‐line chemotherapy after diagnosis. The most commonly used chemotherapy regimen was oxaliplatin‐based regimen (n=130, 47.6%), followed by taxane‐based (n=80, 29.3%), platinum‐based and 5‐flurouracil single drug regimen. The oxaliplatin‐based regimen was oxaliplatin and fluoropyrimidine (5‐flurouracil, capecitabine or S‐1). The taxane‐based regimens included paclitaxel or docetaxel and fluoropyrimidine (capecitabine or S‐1) and DCF(docetaxel,cisplatin, and 5‐fluorourancil). The platinum‐based regimens were XP (capecitabine plus cisplatin) and FP (5‐fluorourancil plus cisplatin). The 5‐flurouracil single drug regimen was capecitabine or S‐1. The chemotherapy regimen was decided at the discretion of the physicians.
Tumor response to treatment was assessed after two cycles of chemotherapy, based on the rules established by the Response Evaluation Criteria in Solid Tumors (RECIST).20 The responses were: complete response (CR), partial response (PR), stable disease (SD) and progressive disease (PD). Disease control was defined as CR, PR or SD.
2.4. Statistical analysis
Receiver operator characteristic (ROC) analysis was conducted to reveal an association between PLR and tumor response after two cycles of first‐line chemotherapy. The independent t test and χ2 test were used to evaluate the relatedness between PLR and baseline clinical characteristics. A logistic regression model was used to analyze the independent risk indicators for the response to first‐line chemotherapy. Survival data were analyzed using the Kaplan‐Meier method. Comparison of survival curves was performed using log‐rank analysis. A multivariate prognostic model was performed for all variables that were significantly associated with OS at P≤.05 in the univariate analysis. P<.05 was considered statistically significant and all P values corresponded to two‐sided significance tests. All statistical analyses were performed using SPSS version 17.0 software (SPSS, Chicago, IL, USA).
3. Results
3.1. Baseline characteristics and grouping of PLR
There were 273 patients included in this study. The median age was 57 years and 186 (68.1%) patients were male. Two hundred and sixteen patients had died by the last follow‐up date.
Based on the response to first‐line chemotherapy, all patients were divided into two groups: 239 with disease control (CR+PR+SD) and 34 with PD. As shown in Figure 1, the area under the ROC curve (AUC) was 0.627 (95% confidence interval [CI]: 0.526‐0.729) and the optimal cut‐off value of PLR was defined as 201.6, based on the most prominent point with a sensitivity of 47.1% and specificity of 78.7%. In view of the best cut‐off value of PLR for predicting the response by the ROC curve, patients were divided into two groups: low PLR group (<201.6) and high PLR group (≥201.6).
Figure 1.
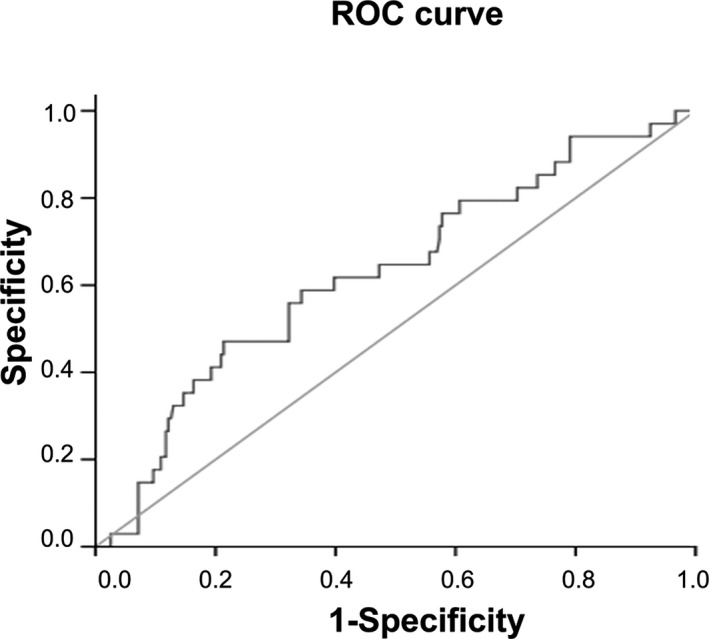
Receiver operating characteristic curve for the platelet‐to‐lymphocyte ratio and the response to first‐line chemotherapy for patients with metastatic advanced gastric cancer
3.2. PLR and clinicopathological characteristics
All the patient characteristics according to PLR group are presented in Table 1. The low PLR group had a lower neutrophil count (P=.002) and platelet count (P<.001) than the high PLR group had. Lymphocyte count (P<.001) and hemoglobin (P<.001) were both higher in the low PLR group. Other clinicopathological characteristics were not significantly different between the two groups.
Table 1.
Baseline characteristics of patients
| Variables | Total (n=273) | Low PLR group (n=206) | High PLR group (n=67) | P value |
|---|---|---|---|---|
| Age | 56.68±10.731 | 57.29±10.565 | 54.82±11.097 | .157 |
| Gender | ||||
| Male | 186 (68.1%) | 146 (70.9%) | 40 (45.6%) | .088 |
| Female | 87 (31.9%) | 60 (29.1%) | 27 (40.3%) | |
| ECOG | ||||
| 0 | 61 (22.3%) | 48 (23.2%) | 13 (19.4%) | .229 |
| 1 | 201 (73.6%) | 152 (73.8%) | 45 (73.1%) | |
| 2 | 11 (4.0%) | 6 (2.9%) | 5 (7.5%) | |
| Chemotherpaeutic regimen | ||||
| Oxaliplatin‐based | 130 (47.6%) | 94 (45.6%) | 36 (53.7%) | .285 |
| Taxane‐based | 80 (29.3%) | 63 (30.6%) | 17 (25.4%) | |
| Platinum‐based | 33 (12.1%) | 23 (11.2%) | 10 (14.9%) | |
| 5‐Fu single drug | 30 (11%) | 26 (12.6%) | 4 (6.0%) | |
| Lung metastasis | ||||
| No | 257 (94.1%) | 194 (94.2%) | 63 (94.0%) | .965 |
| Yes | 16 (5.9%) | 12 (5.8%) | 4 (6.0%) | |
| Peritoneum metastasis | ||||
| No | 207 (75.8%) | 158 (76.7%) | 49 (73.1%) | .554 |
| Yes | 66 (24.2%) | 48 (23.3%) | 18 (26.9%) | |
| Liver metastasis | ||||
| No | 203 (74.4%) | 156 (75.7%) | 47 (70.1%) | .364 |
| Yes | 70 (25.6%) | 50 (24.3%) | 20 (29.9%) | |
| Differentiation | ||||
| Well | 17 (6.2%) | 11 (5.3%) | 6 (9.0%) | .420 |
| Moderate | 48 (17.6%) | 41 (19.9%) | 7 (10.4%) | |
| Poor | 121 (44.3%) | 89 (43.2%) | 32 (47.8%) | |
| Signet ring | 35 (12.8%) | 26 (12.6%) | 9 (13.4%) | |
| No data | 52 (19.0%) | 39 (18.9%) | 13 (19.4%) | |
| White blood cell count, 109/L | 6.45±2.172 | 6.41±2.083 | 6.59±2.436 | .755 |
| Neutrophil count, 109/L | 4.03±1.920 | 3.82±1.823 | 4.67±2.075 | .002 |
| Lymophocyte count, 109/L | 1.74±0.651 | 1.88±0.639 | 1.28±0.446 | <.001 |
| Hemoglobin, g/L | 111.64±20.541 | 116.19±18.770 | 97.67±19.544 | <.001 |
| Platelet count, 109/L | 255.67±102.449 | 225.88±75.996 | 347.25±118.458 | <.001 |
PLR, platelet‐to‐lymphocyte ratio; ECOG, Eastern Cooperative Oncology Group.
Variables are expressed as mean±SD or n (%).
3.3. PLR and first‐line chemotherapeutic response
The distribution of the treatment response after two cycles of chemotherapy with reference to PLR subgroup is systematically evaluated in Table 2. Overall, 0 and 55 patients (20.1%) had CR and PR, while 184 (67.4%) and 34 (12.5%) had SD and PD, respectively. The low PLR group had a significantly higher disease control rate (91.3%) compared with the high PLR group (76.1%, P=.002).
Table 2.
Chemotherapeutic response to first‐line chemotherapy with reference to PLR subgroup
| Response | Total patients (n=273) | Low PLR group (n=206) | High PLR group (n=67) |
|---|---|---|---|
| Non‐progression of diseasea | |||
| Complete response | 0 (0%) | 0 (0%) | 0 (0%) |
| Partial response | 55 (20.1%) | 44 (21.4%) | 11 (16.4%) |
| Stable disease | 184 (67.4%) | 144 (69.9%) | 40 (59.7%) |
| Progressive disease | 34 (12.5%) | 18 (8.7%) | 16 (23.9%) |
PLR, platelet‐to‐lymphocyte ratio.
P=.002 for disease control rate between the low PLR group and the high PLR group.
The potential markers for predicting tumor response and survival were investigated to determine the best therapeutic response factors, including: gender; age; ECOG PS; tumor differentiation; lung, liver, and peritoneal metastasis; and PLR. To this end, a logistic regression model was used to analyze the independent risk factors for response after two cycles of chemotherapy (Table 3). Pre‐treatment PLR was an independent risk factor for response to chemotherapy in patients with metastatic gastric cancer (odds ratio [OR]: 3.256, 95% CI: 1.521‐6.969; P=.002).
Table 3.
Logistic regression analysis of independent risk factors for response to chemotherapy in patients with metastatic advanced gastric cancer
| P value | OR | 95% CI | |
|---|---|---|---|
| Gender | .174 | 1.737 | 0.784‐3.850 |
| Age | .807 | 0.996 | 0.961‐1.032 |
| ECOG | .326 | 0.683 | 0.319‐1.463 |
| Differentiation | .438 | 1.140 | 0.819‐1.586 |
| Lung metastasis | .436 | 1.712 | 0.443‐6.621 |
| Liver metastasis | .923 | 0.860 | 0.378‐2.255 |
| Peritoneum metastasis | .658 | 0.814 | 0.327‐2.027 |
| PLR | .002 | 3.256 | 1.521‐6.969 |
| Constant | .066 | 0.091 |
OR, odds ratio; CI, confidence interval; ECOG, Eastern Cooperative Oncology Group; PLR, platelet‐to‐lymphocyte ratio.
3.4. PLR and OS
The median OS of all patients was 12.0 months (95% CI: 10.4‐13.6). The median OS was longer in the low PLR group (PLR <201.6) than in the high PLR group (PLR ≥201.6) [13.4 months (95% CI: 11.4‐15.5) vs 9.2 months (95% CI: 10.4‐13.6), P=.020] (Figure 2).
Figure 2.
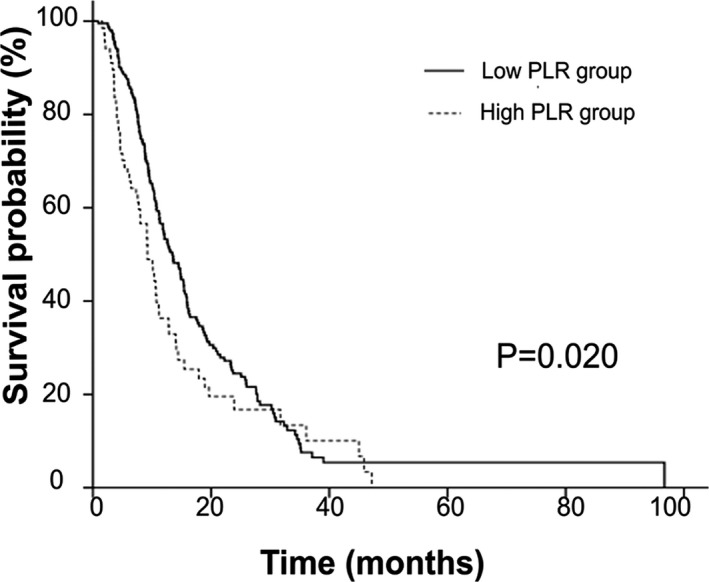
Kaplan‐Meier survival curves of all patients (high and low platelet‐to‐lymphocyte ratio group patients)
In subgroup analysis, OS curves of patients who received an oxaliplatin‐based regimen, stratified by PLR, are shown in Figure 3A. Patients in the high PLR group (n=36) had a significantly poorer OS (9.1 months) when compared with patients in the low PLR group (n=94; 15.4 months, P=.004). Kaplan‐Meier survival curves, stratified by PLR, in patients who received a taxane‐based regimen are shown in Figure 3B. OS for the low PLR group (n=63) and high PLR group (n=17) was 12.6 and 10.3 months (P=.054), respectively.
Figure 3.
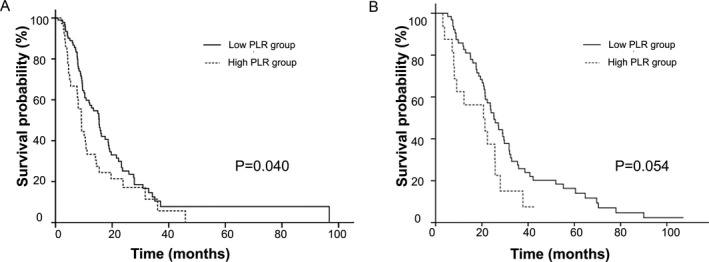
Kaplan‐Meier curves for the overall survival in patients who received two larger regimen subgroups. (A) Patients who received oxaliplatin‐based regimen. (B) Kaplan‐Meier survival curves in patients who received taxane‐based regimen
In some previous studies, cut‐off values of PLR were chosen as a dichotomous cutoff (150) or triple subsets cutoff (<150/150‐300/>300).11, 21 We validated our data using these varying thresholds of PLR. The observed OS curves showed significant differences regardless of the different cut‐off values. The P values were .006 and .001 for the PLR cutoff of dichotomous and triple subsets, respectively (Figure 4).
Figure 4.
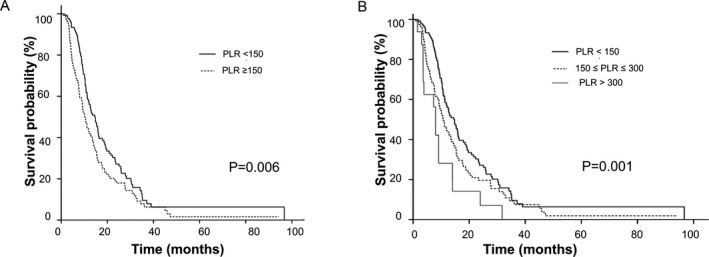
Kaplan‐Meier survival curves in all the patients using different cutoff values of platelet‐to‐lymphocyte ratio (PLR). (A) the overall survival of patients using dichotomized cutoff value for PLR. (B) the overall survival of patients using triple subsets cutoffs for PLR
Univariate and multivariate analyses were performed for clinicopathological variables shown in Table 4. Univariate predictors of OS were gender (P=.037), liver metastasis (P<.001), white blood cell count (P=.010), platelet count (P=.032), and PLR (P=.001). In multivariate analysis, PLR (HR 1.002, 95% CI: 1.000‐1.003; P=.020), white blood cell count (HR 1.062, 95% CI: 1.003‐1.126; P=.041), liver metastasis (HR 1.599, 95% CI; 1.166‐2.194; P=.004) and gender (HR 1.377, 95% CI: 1.036‐1.829; P=.027) were independent predictors of OS.
Table 4.
Results of univariate and multivariate analyses of OS
| Variables | Univariate analysis | Multivariate analysis | ||
|---|---|---|---|---|
| HR (95% CI) | P value | HR (95% CI) | P value | |
| Age | ||||
| ≤57 | 1 (reference) | |||
| >57 | 0.948 (0.724‐1.240) | .695 | ||
| Gender | ||||
| Male | 1 (reference) | 1.421 (1.063‐1.901) | .018 | |
| Female | 1.351 (1.018‐1.792) | .037 | ||
| ECOG | ||||
| 0 | 1 (reference) | |||
| 1 | 1.064 (0.782‐1.449) | .693 | ||
| 2 | 1.013 (0.500‐2.051) | .972 | ||
| Chemotherpeutic regimen | ||||
| Oxaliplatin‐based | 1 (reference) | |||
| Taxane‐based | 1.175 (0.866‐1.593) | .300 | ||
| Other regimens | 1.009 (0.707‐1.439) | .961 | ||
| Lung metastasis | ||||
| No | 1 (reference) | |||
| Yes | 1.071 (0.642‐1.789) | .792 | ||
| Peritoneum metastasis | ||||
| No | 1 (reference) | |||
| Yes | 1.201 (0.877‐1.645) | .254 | ||
| Liver metastasis | ||||
| No | 1 (reference) | 1.599 (1.166‐2.194) | .004 | |
| Yes | 1.715 (1.270‐2.317) | <.001 | ||
| WBC count | 1.079 (1.018‐1.144) | .010 | 1.062 (1.003‐1.126) | .041 |
| Hemoglobin | 0.999 (0.992‐1.006) | .787 | ||
| Platelet count | 1.001 (1.000‐1.003) | .032 | ||
| PLR | 1.002 (1.001‐1.004) | .001 | 1.002 (1.000‐1.003) | .020 |
OS, overall survival; HR, hazard ratio; CI, confidence interval; ECOG, Eastern Cooperative Oncology Group; WBC, white blood cell; PLR, platelet‐to‐lymphocyte ratio.
4. Discussion
This study is believed to be the first attempt to evaluate PLR, which reflects systemic inflammatory response, for the prediction of response to first‐line chemotherapy, and prediction of survival in patients with metastatic gastric cancer.
Pre‐therapeutic indices of systemic inflammatory response provide much important information in the evolution and progression of cancer,22 as well as in the response to therapy.23 On this basis, inflammatory markers of response prediction have been suggested, such as C‐reactive protein, neutrophil‐to‐lymphocyte ratio and PLR.24 Nevertheless, studies about the relationship between PLR and chemotherapeutic response in metastatic cancer are limited. Only one retrospective study with 210 patients with advanced non‐small lung cancer has shown that PLR is associated with the clinical benefit and OS.25 There have been no studies about PLR predicting chemotherapeutic response in metastatic gastric cancer. In our study we demonstrated that patients with low PLR had a significantly higher disease control rate. A logistic regression model showed that PLR was an independent risk factor for the response to first‐line chemotherapy in metastatic gastric cancer.
In recent studies, PLR has also been shown to be a prognostic factor in many malignant solid tumors.11, 12, 13, 14, 15, 16 In a study carried out on 374 prostate cancer patients treated with radiotherapy, increased PLR was an independent prognostic factor of poor distant metastasis‐free survival (HR=2.24, P=.036), cancer‐specific survival (HR=3.99, P=.025) and OS (HR=1.87, P=.044).15 Apart from these, elevated PLR is associated with poor clinical outcome in patients with non‐small cell lung cancer, colorectal cancer, pancreatic cancer, ovarian clear cell carcinoma, gastrointestinal stromal tumors and hepatocellular cancer.10, 11, 12, 13, 14 The prognostic role of PLR in gastric cancer has been studied mainly in patients with operable gastric cancer and rarely in those with metastatic disease.16, 17, 18, 19 Wang et al.18 reviewed the medical records of 439 patients with metastatic gastric cancer and found that elevated PLR was associated with shorter OS in the univariate but not in the multivariate analysis. In another similar study in patients with advanced gastric cancer who received FOLFOX combination chemotherapy, PLR did not have significant prognostic value for predicting progression‐free survival or OS.26 In a retrospective study including 71 (31.1%) patients with distant metastatic gastric cancer, PLR values were significantly higher than in non‐metastatic gastric cancer (P<.001) and PLR was an independent prognostic factor for tumor burden (P=.003). However, there was no survival analysis involved.19 Our study demonstrated longer OS in the low PLR group compared with the high PLR group. This was in accordance with the findings of other studies. In addition, PLR showed a significant relationship with OS in multivariate analysis, which differed from some other studies. The possible reasons for this were population diversity and differences in treatment.
There is much evidence to show the correlation of PLR with chemotherapeutic response and prognostic survival outcomes. The specific mechanisms involved are complex and remain to be elucidated. One potential explanation involves inflammatory cytokines and chemokines. Several studies have shown that interleukin‐1and ‐6 can stimulate megakaryocyte proliferation and thrombopoietin production, which can lead to thrombocytosis in patients with cancer.27 Thrombocytosis and the consequent release of platelet‐derived chemokines in the tumor microenvironment also promote tumor cell growth.28 Lymphocytes have an important role in cancer immune surveillance and prevent development of malignancy.29 The decrease in CD4+ T‐helper lymphocytes may result in a suboptimal lymphocyte‐mediated immune response to tumor cells.30 Therefore, thrombocytosis and lymphocytopenia are considered as negative prognostic markers in various cancers and are related to poor response in solid tumors.31, 32, 33, 34 However, an increase in platelet count and decreased lymphocyte count alone may not reflect the host systemic inflammatory response, including mediated immune response and tumorigenesis process. Thus, the PLR, which combines platelet and lymphocyte counts, may reflect the bonding prognostic information of these two processes, and be a stronger predictor of outcome than platelet or lymphocyte count alone. An elevated PLR (high platelet and low lymphocyte count) might protect tumor cells from lysis by natural killer cells, thereby facilitating metastasis.35
Although none of the patients in this study received identical chemotherapeutic regimens, the values of PLR were not influenced by different regimens. Our subgroup analyses confirmed the role of PLR in the two larger subgroups of patients treated with oxaliplatin and taxane‐based regimens. The results showed that PLR was a significant prognostic factor for patients treated with oxaliplatin‐based regimens (P=.04), in accordance with the overall population. Although PLR was not a significant prognostic factor in the taxane‐based regimen subgroup (P=.054), there was a strong trend towards worse OS in the high PLR group. Apparently, PLR is a prognostic factor regardless of the regimen received by the patients.
In our study, the cut‐off value of PLR was calculated as 201.6 with an ROC curve according to the response after two cycles of first‐line chemotherapy. Kaplan‐Meier survival analysis showed that the curves for OS in patients with pre‐treatment PLR <201.6 and PLR ≥201.6 had significant differences. We obtained significantly different survival curves in our evaluation, using dichotomous and trifurcate cut‐off values of PLR. Therefore, the results might strengthen the viewpoint that PLR is a reliable parameter for predicting prognosis.
Our study had some limitations. First, this was a retrospective study with a small study population. Second, lymphocyte and platelet counts may have been influenced by some anti‐inflammatory drugs that could not be accounted for in our analysis. Third, AUC for PLR with 0.627 is low as a predictive value. Similarly, some studies determined the optimal cut‐off values of PLR with low AUC as 0.57‐0.613.17, 25, 36, 37 Finally, since other inflammatory markers such as C‐reactive protein were not routinely measured, we could not clarify the relationship between PLR and other inflammatory markers. Therefore, further, large prospective studies are required to confirm our results.
5. Conclusions
Pre‐treatment PLR has a significant association with first‐line chemotherapeutic response and prognosis in metastatic advanced gastric cancer. PLR is an independent risk indicator for response to first‐line chemotherapy. An elevated PLR as a prognostic marker predicts poor survival.
Acknowledgments
This work was supported by the National Science and Technology Major Project (No. 2013ZX09303002) and Science and Technology Plan Project of Liaoning Province (No. 2011404013‐1, 2014225013).
Wang J, Qu J, Li Z, et al. Pre‐treatment platelet to lymphocyte ratio is associated with response to first‐line chemotherapy and survival in patients with metastatic gastric cancer. J Clin Lab Anal. 2018;32:e22185 10.1002/jcla.22185
Contributor Information
Yunpeng Liu, Email: cmuliuyunpeng@hotmail.com.
Xiujuan Qu, Email: cmuquxiujuan@163.com.
References
- 1. Ferlay J, Soerjomataram I, Dikshit R, et al. Cancer incidence and mortality worldwide: sources, methods and major patterns in GLOBOCAN 2012. Int J Cancer. 2015;136:E359–E386. [DOI] [PubMed] [Google Scholar]
- 2. Orditura M, Galizia G, Sforza V, et al. Treatment of gastric cancer. World J Gastroenterol. 2014;20:1635–1649. [DOI] [PMC free article] [PubMed] [Google Scholar]
- 3. Koizumi W, Narahara H, Hara T, et al. S‐1 plus cisplatin versus S‐1 alone for first‐line treatment of advanced gastric cancer (SPIRITS trial): a phase III trial. Lancet Oncol. 2008;9:215–221. [DOI] [PubMed] [Google Scholar]
- 4. Koizumi W, Kim YH, Fujii M, et al. Addition of docetaxel to S‐1 without platinum prolongs survival of patients with advanced gastric cancer: a randomized study (START). J Cancer Res Clin Oncol. 2014;140:319–328. [DOI] [PMC free article] [PubMed] [Google Scholar]
- 5. Bang YJ, Van Cutsem E, Feyereislova A, et al. Trastuzumab in combination with chemotherapy versus chemotherapy alone for treatment of HER2‐positive advanced gastric or gastro‐oesophageal junction cancer (ToGA): a phase 3, open‐label, randomised controlled trial. Lancet. 2010;376:687–697. [DOI] [PubMed] [Google Scholar]
- 6. Sylvie L, Susanne B, Katja O. Prediction of response and prognosis by a score including only pretherapeutic parameters in 410 neoadjuvant treated gastric cancer patients. Recent Results Cancer Res. 2012;196:269–289. [DOI] [PubMed] [Google Scholar]
- 7. Wang LB, Teng RY, Jiang ZN, et al. Clinicopathologic variables predicting tumor response to neoadjuvant chemotherapy in patients with locally advanced gastric cancer. J Surg Oncol. 2012;105:293–296. [DOI] [PubMed] [Google Scholar]
- 8. Mantovani A, Allavena P, Sica A, Balkwill F. Cancer‐related inflammation. Nature. 2008;454:436–444. [DOI] [PubMed] [Google Scholar]
- 9. Balkwill F, Mantovani A. Inflammation and cancer: back to Virchow? Lancet. 2001;357:539–545. [DOI] [PubMed] [Google Scholar]
- 10. Williams KA, Labidi‐Galy SI, Terry KL, et al. Prognostic significance and predictors of the neutrophil‐to‐lymphocyte ratio in ovarian cancer. Gynecol Oncol. 2014;132:542–550. [DOI] [PMC free article] [PubMed] [Google Scholar]
- 11. Kwon HC, Kim SH, Oh SY, et al. Clinical significance of preoperative neutrophil‐lymphocyte versus platelet‐lymphocyte ratio in patients with operable colorectal cancer. Biomarkers. 2012;17:216–222. [DOI] [PubMed] [Google Scholar]
- 12. Kos M, Hocazade C, Kos FT, et al. Prognostic role of pretreatment platelet/lymphocyte ratio in patients with non‐small cell lung cancer. Wien Klin Wochenschr. 2016;128:635–640. [DOI] [PubMed] [Google Scholar]
- 13. Kim HS, Choi HY, Lee M, et al. Systemic inflammatory response markers and CA‐125 levels in ovarian clear cell carcinoma: a two center cohort study. Cancer Res Treat. 2016;48:250–258. [DOI] [PMC free article] [PubMed] [Google Scholar]
- 14. Smith RA, Bosonnet L, Raraty M, et al. Preoperative platelet‐lymphocyte ratio is an independent significant prognostic marker in resected pancreatic ductal adenocarcinoma. Am J Surg. 2009;197:466–472. [DOI] [PubMed] [Google Scholar]
- 15. Langsenlehner T, Pichler M, Thurner EM, et al. Evaluation of the platelet‐to‐lymphocyte ratio as a prognostic indicator in a European cohort of patients with prostate cancer treated with radiotherapy. Urol Oncol. 2015;33:201. e9‐16. [DOI] [PubMed] [Google Scholar]
- 16. Kim EY, Lee JW, Yoo HM, Park CH, Song KY. The platelet‐to‐lymphocyte ratio versus neutrophil‐to‐lymphocyte ratio: which is better as a prognostic factor in gastric cancer? Ann Surg Oncol. 2015;22:4363–4370. [DOI] [PubMed] [Google Scholar]
- 17. Deng Q, He B, Liu X, et al. Prognostic value of pre‐operative inflammatory response biomarkers in gastric cancer patients and the construction of a predictive model. J Transl Med. 2015;13:66. [DOI] [PMC free article] [PubMed] [Google Scholar]
- 18. Wang Q, Yang Y, Zhang YP, et al. Prognostic value of carbohydrate tumor markers and inflammation‐based markers in metastatic or recurrent gastric cancer. Med Oncol. 2014;31:289. [DOI] [PubMed] [Google Scholar]
- 19. Cetinkunar S, Guzel H, Emre Gokce I, et al. High levels of platelet/lymphocyte ratio are associated with metastatic gastric cancer. J BUON. 2015;20:78–83. [PubMed] [Google Scholar]
- 20. Eisenhauer EA, Therasse P, Bogaerts J, et al. New response evaluation criteria in solid tumours: revised RECIST guideline (version 1.1). Eur J Cancer. 2009;45:228–247. [DOI] [PubMed] [Google Scholar]
- 21. He W, Yin C, Guo G, et al. Initial neutrophil lymphocyte ratio is superior to platelet lymphocyte ratio as an adverse prognostic and predictive factor in metastatic colorectal cancer. Med Oncol. 2013;30:439. [DOI] [PubMed] [Google Scholar]
- 22. Grivennikov SI, Greten FR, Karin M. Immunity, inflammation, and cancer. Cell. 2010;140:883–899. [DOI] [PMC free article] [PubMed] [Google Scholar]
- 23. Wagner DD. New links between inflammation and thrombosis. Arterioscler Thromb Vasc Biol. 2005;25:1321–1324. [DOI] [PubMed] [Google Scholar]
- 24. Crumley AB, McMillan DC, McKernan M, McDonald AC, Stuart RC. Evaluation of an inflammation‐based prognostic score in patients with inoperable gastro‐oesophageal cancer. Br J Cancer. 2006;94:637–641. [DOI] [PMC free article] [PubMed] [Google Scholar]
- 25. Liu H, Wu Y, Wang Z, et al. Pretreatment platelet‐to‐lymphocyte ratio (PLR) as a predictor of response to first‐line platinum‐based chemotherapy and prognosis for patients with non‐small cell lung cancer. J Thorac Dis. 2013;5:783–789. [DOI] [PMC free article] [PubMed] [Google Scholar]
- 26. Lee S, Oh SY, Kim SH, et al. Prognostic significance of neutrophil lymphocyte ratio and platelet lymphocyte ratio in advanced gastric cancer patients treated with FOLFOX chemotherapy. BMC Cancer. 2013;13:350. [DOI] [PMC free article] [PubMed] [Google Scholar]
- 27. Alexandrakis MG, Passam FH, Moschandrea IA, et al. Levels of serum cytokines and acute phase proteins in patients with essential and cancer‐related thrombocytosis. Am J Clin Oncol. 2003;26:135–140. [DOI] [PubMed] [Google Scholar]
- 28. Sierko E, Wojtukiewicz MZ. Platelets and angiogenesis in malignancy. Semin Thromb Hemost. 2004;30:95–108. [DOI] [PubMed] [Google Scholar]
- 29. Dunn GP, Old LJ, Schreiber RD. The immunobiology of cancer immunosurveillance and immunoediting. Immunity. 2004;21:137–148. [DOI] [PubMed] [Google Scholar]
- 30. An X, Ding PR, Li YH, et al. Elevated neutrophil to lymphocyte ratio predicts survival in advanced pancreatic cancer. Biomarkers. 2010;15:516–522. [DOI] [PubMed] [Google Scholar]
- 31. Hutterer GC, Krieger D, Mrsic E, et al. Preoperative leucocytosis, thrombocytosis and anemia as potential prognostic factors in non‐metastatic renal cell carcinoma. Anticancer Res. 2015;35:3463–3469. [PubMed] [Google Scholar]
- 32. Josa V, Krzystanek M, Eklund AC, et al. Relationship of postoperative thrombocytosis and survival of patients with colorectal cancer. Int J Surg. 2015;18:1–6. [DOI] [PubMed] [Google Scholar]
- 33. Digklia A, Voutsadakis IA. Thrombocytosis as a prognostic marker in stage III and IV serous ovarian cancer. Obstet Gynecol Sci. 2014;57:457–463. [DOI] [PMC free article] [PubMed] [Google Scholar]
- 34. Buergy D, Wenz F, Groden C, Brockmann MA. Tumor‐platelet interaction in solid tumors. Int J Cancer. 2012;130:2747–2760. [DOI] [PubMed] [Google Scholar]
- 35. Nieswandt B, Hafner M, Echtenacher B, Mannel DN. Lysis of tumor cells by natural killer cells in mice is impeded by platelets. Cancer Res. 1999;59:1295–1300. [PubMed] [Google Scholar]
- 36. Ying HQ, Deng QW, He BS, et al. The prognostic value of preoperative NLR, d‐NLR, PLR and LMR for predicting clinical outcome in surgical colorectal cancer patients. Med Oncol. 2014;31:305. [DOI] [PubMed] [Google Scholar]
- 37. Wu Y, Chen Y, Yang X, Chen L, Yang Y. Neutrophil‐to‐lymphocyte ratio (NLR) and platelet‐to‐lymphocyte ratio (PLR) were associated with disease activity in patients with systemic lupus erythematosus. Int Immunopharmacol. 2016;36:94–99. [DOI] [PubMed] [Google Scholar]