

Abstract
Introduction
Proteolytic cleavage through proteases affects peptide hormone levels, which is of particular significance when the time interval between sampling and analysis is prolonged. We evaluated the stability of parathyroid hormone, insulin, and prolactin molecules (i) with different protease inhibitors such as K2 EDTA, aprotinin, and protease inhibitor cocktail (PIC), (ii) with different lag times (6‐72 hours), and (iii) under different storage temperatures (4°C vs room temperature [RT]) until analysis.
Materials and Methods
Blood samples were collected into 2 sets of 5 Vacutainer® tubes (Becton Dickinson) from 10 healthy adults. Tubes 1 and 2 were plain gel separator tubes. Tubes 3, 4, and 5 contained PIC (1%), aprotinin (500 KIU/mL), and K2 EDTA, respectively. After centrifugation at 1300 g for 10 minutes, PIC added to tube 2 of each set. Samples were analyzed and then one set was stored at 4°C, whereas the other at RT until analysis at 6, 24, 48, and 72 hours. Hormone levels were determined with electrochemiluminescence immunoassay (ModularE170; Roche Diagnostics). The results were compared with desirable bias limits (DBL) from Westgard QC database.
Results
Insulin at RT decreases exceeding the DBL starting from 24 hours and K2 EDTA preserved insulin. PTH exceeded the DBL at RT for 48 hours or longer and PIC addition after centrifugation inhibited its degradation. Prolactin remained stable in all tested conditions. All parameters in the plain gel separator tubes remained within DBL when stored at 4°C until 72 hours.
Conclusions
Different proteases may degrade peptide hormones and measures should be taken to counteract these effects especially if there is a delay before analysis.
Keywords: insulin, parathyroid hormone, pre‐analytical phase, prolactin, protease inhibitors
1. Introduction
Studies have shown that 61.9‐71.0% of errors occur during the pre‐analytical phase of the total testing process.1, 2, 3 As clinical laboratory services are increasingly centralized and greater number of samples are transported from peripheral sites to central laboratories, samples taken at peripheral sites are subjected to increased number of handling procedures, varying storage conditions, and prolonged durations until they are finally analyzed. The wide variety of pre‐analytical procedures and factors, including the use of anticoagulants, centrifugation, sample processing, and storage conditions4, 5 can affect the stability of plasma and serum proteins.
Parathormone, insulin, and prolactin are three peptide hormones that are commonly measured in routine clinical practice. These peptide hormones have small sizes (intact parathormone; molecular weight of 9425 Da, insulin; 5808 Da, prolactin; 22000 Da), they have some peripheral metabolism and are usually cleared by the kidneys; therefore, they have short half‐lives (intact parathormone; <5 minutes, insulin; 5‐10 minutes in circulation, prolactin; 15‐20 minutes).6 But these in‐vivo data give us little insight about their stability in blood samples after they are collected, especially when there is a prolonged waiting time until analysis. Plasma and serum proteins can also undergo intrinsic proteolytic degradation both during and after blood collection. Five groups of proteases—serine proteases (thrombin, protein C, factor VII, IX, X, and XII, plasmin, tissue plasminogen activator, urokinase plasminogen activator), cysteine proteases (cathepsins), metalloproteases (gelatinase A, matrixins), aspartic proteases, and threonine proteases—exist with various mechanisms of action.7 Metalloproteases need metal ions as cofactors in enzymatic reactions and contain one or two metal ions (in most cases zinc but also cobalt, nickel, or manganese) that are usually bound by three amino acids in the catalytic nucleophile.8 Blood also contains endogenous inhibitors of many of these proteases. The impact of proteolytic cleavage of peptide hormones can become especially important when the time frame between sampling and analysis is prolonged.
Clinical laboratorians should consider the effects of these handling procedures and delays, when the samples are transported from peripheral sites to central laboratories as contradictory results exist in the literature about the stability of serum parameters.9, 10, 11 Although the use of serum samples obtained with the use of gel separator tubes has almost become the industrial standard for spectrophotometric and immunochemistry analyses, the stability of peptide hormones in serum samples has been reviewed.12, 13, 14 In order to produce more accurate and clinically useful results, the stability of peptide hormones under the impact of handling procedures, storage conditions, and prolonged durations in different types of samples should also be investigated.
In our study, we aimed to investigate the stability of three frequently requested peptide hormones: parathyroid hormone, insulin, and prolactin (i) in the presence of different protease inhibitors such as dipotassium ethylenediaminetetraacetic acid (K2EDTA), aprotinin, protease inhibitor cocktail, (ii) with different lag times before analysis (6‐72 hours), and (iii) under different storage temperatures until analysis (4°C vs room temperature [RT]). K2EDTA.
2. Materials and Methods
2.1. Subjects
This prospective study was conducted in October 2014 in the biochemistry laboratory of Marmara University Pendik Education and Research Hospital, Istanbul, Turkey. The study protocol was conducted in accordance with the ethical standards of the institutional committee on human experimentation and with the Helsinki Declaration. The study was approved by the ethical committee of Marmara University School of Medicine and an informed consent was obtained from each donor.
2.2. Blood sampling
Blood specimens were collected with 8 hours fasting from 10 volunteering healthcare workers (Female/Male: 6/4, mean ages: 27±5, with no known medical condition and taking no drugs) between 8:00 and 9:00 am into 2 sets of 5 Vacutainer tubes (Becton Dickinson, Franklin Lakes, NJ, USA). Filling and mixing of the tubes were performed according to the manufacturer's recommendations to avoid any collection order effect. The collection duration was set at a maximum of 5 minutes for each donor to avoid any bias between the first and last collected tubes. Tubes 1 and 2 were plain gel separator tubes (cat no. 367985) and did not contain any protease inhibitors. A protease inhibitor cocktail (PIC) was added to tube 3, to inhibit serine, cysteine, aspartic acid proteases, and metalloproteases (Sigma‐Aldrich Co., St. Louis, MO, USA) at 1% concentration as recommended by the manufacturer. Tube 4 was added aprotinin for inhibition of serine proteases (Sigma‐Aldrich Co.) at a final concentration of 500 KIU/mL. Tube 5 contained 18.0 mg K2EDTA (cat no. 367525) for inhibition of metalloproteases (Becton Dickinson). All collected samples were centrifuged at 1300 g for 10 minutes following a 30 minutes of waiting time for clotting. PIC was added to tube 2 of each set after centrifugation to determine the differential effect of adding PIC to whole blood or serum. Each sample was analyzed immediately; one set was stored at 4°C (±2), whereas the other set was stored at RT (22±2°C) until analysis at 6, 24, 48, and 72 hours. Sample collection and all analyses were performed at the Biochemistry Laboratory of Marmara University Pendik Education and Research Hospital.
2.3. Methods
Insulin, parathyroid hormone, and prolactin levels were determined using electrochemiluminescence immunoassay on the Modular E170 analyzer (Roche Diagnostics, Mannheim, Germany). The parathormone assay uses a sandwich test principle in which a biotinylated monoclonal antibody reacts with the N‐terminal fragment (1‐37) and a monoclonal antibody with ruthenium complex reacts with the C‐terminal fragment (38‐84). Prolactin II and insulin assays use two monoclonal antibodies also. Within‐run and between‐run imprecisions at given concentrations for insulin, parathyroid hormone, and prolactin were calculated using two levels of control materials (PreciControl Varia for PTH [cat no.05618860] and PreciControl Universal [cat no. 11731416] for the others; Roche Diagnostics) in our laboratory and are presented in Table 1.
Table 1.
Within‐run and between‐run imprecisions (%) at given concentrations and desirable biases from the Westgard QC Database for insulin, parathyroid hormone, and prolactin
| Analyte | Concentration±SD | Within‐run precision | Between‐run precision | Desirable Bias (%) |
|---|---|---|---|---|
| Insulin (mU/L) | 25.3±0.4 | 1.6 | 2.5 | 15.5 |
| 79.1±1.2 | 1.5 | 2.1 | ||
| Parathyroid hormone (ng/L) | 61±0.5 | 0.9 | 1.7 | 8.8 |
| 201.8±1.4 | 0.7 | 1.6 | ||
| Prolactin (μg/L) | 12.6±0.3 | 2.1 | 4.2 | 10.5 |
| 44.9±0.4 | 1.0 | 3.4 |
2.4. Statistical analysis
Statistical analyses were performed using the SPSS 15.0 (SPSS Inc., Chicago, IL, USA). The differences between 0‐6, 0‐24, 0‐48, and 0‐72 hours were compared with Wilcoxon sign test. For post‐hoc analyses, the Bonferroni correction was made and P values of less than .0125 (0.05/4) were accepted as significant. Percent relative bias from the baseline (0 hour) was calculated for each sample by the following formula: [(concentration of any hour − concentration of 0 hour)/concentration of 0 hour]×100 at each time point. Then, the median bias for each group has been calculated and relative bias percentages for paired groups (0‐6, 0‐24, 0‐48, 0‐72 hours, etc.) were compared with the current analytical quality specifications for desirable bias limits (DBL) (from the Westgard QC,15 which was first published at 1999 and updated at 2012 by Ricos et al.) to determine clinically significant variations (Table 1).
3. Results
The results of groups under each condition are represented as median (25th‐75th percentile) and the changes observed are expressed as the percentage of the observed median to the median of baseline levels (Tables 2, 3, 4, 5, 6). Insulin samples in plain gel separator tubes, when stored at RT, exhibited a significant decrease beginning at 6‐hours duration before analysis. The decrease progressed until 72 hours, exceeding DBL at 24 and 72 hours. Whereas, when stored at 4°C, the changes observed were non‐significant except at 6 hours where a decrease by −1.2% of the baseline levels was found to be significant. PTH levels did not show a significant change when kept at 4°C for up to 72 hours until analysis. At RT, the PTH levels decreased progressively and significantly beginning at 24‐hours duration before analysis, which exceeded the DBL after 48 hours. Prolactin measurements were stable for all the samples stored, except in the group that waited for 48 hours before analysis at 4°C, where the samples showed an 4.4% increase (P=.005), which was still within DBL (Table 2).
Table 2.
The medians (25th‐75th percentile), percent change values, and statistical analyses for insulin, PTH, and prolactin measurements in plain gel separator tubes stored at 4°C or RT, until analyzed at 6, 24, 48, and 72 hours in 10 healthy adults
| 0 hour | 6 hours | 24 hours | 48 hours | 72 hours | |
|---|---|---|---|---|---|
| Insulin | |||||
| RT | |||||
| Median (mU/L) | 9.1 | 8.3 | 7.4 | 7.1 | 6.8 |
| 25‐75p | 5.0‐16.0 | 4.6‐14.6 | 4.4‐13.5 | 4.3‐13.5 | 4.1‐12.6 |
| %Change | −8.9 | −18.6 | −21.7 | −25.6 | |
| P | .005 | .005 | .005 | .005 | |
| 4°C | |||||
| Median (mU/L) | 9.1 | 9.0 | 9.1 | 9.1 | 8.8 |
| 25‐75p | 5.0‐16.0 | 5.1‐15.7 | 5.1‐15.7 | 5.1‐15.8 | 5.0‐15.6 |
| %Change | −1.2 | 0.2 | −0.3 | −3.8 | |
| P | .011 | .721 | .443 | .074 | |
| Parathyroid hormone | |||||
| RT | |||||
| Median (ng/L) | 36.7 | 36.5 | 36.1 | 32.4 | 29.6 |
| 25‐75p | 27.6‐48.4 | 28.3‐49.1 | 25.9‐47.3 | 23.0‐44.0 | 21.3‐42.3 |
| %Change | −0.5 | −1.7 | −11.7 | −19.2 | |
| P | .721 | .007 | .005 | .005 | |
| 4°C | |||||
| Median (ng/L) | 36.7 | 37.5 | 37.2 | 37.1 | 37.1 |
| 25‐75p | 27.6‐48.4 | 32.4‐52.1 | 27.8‐50.5 | 27.7‐50.0 | 26.8‐51.2 |
| %Change | 2.3 | 1.5 | 1.1 | 1.1 | |
| P | .051 | .114 | .575 | .445 | |
| Prolactin | |||||
| RT | |||||
| Median (μg/L) | 7.8 | 7.9 | 7.7 | 7.7 | 7.7 |
| 25‐75p | 5.8‐10.1 | 5.8‐10.3 | 5.8‐10.0 | 5.8‐10.2 | 5.4‐9.5 |
| %Change | 1.0 | −0.6 | −1.1 | −1.0 | |
| P | .059 | .903 | .878 | .093 | |
| 4°C | |||||
| Median (μg/L) | 7.8 | 7.9 | 7.8 | 8.1 | 7.8 |
| 25‐75p | 5.8‐10.1 | 5.8‐10.1 | 5.7‐10.1 | 5.9‐10.4 | 5.6‐9.8 |
| %Change | 0.8 | −0.3 | 4.4 | 0.5 | |
| P | .507 | .53 | .005 | .036 | |
RT: room temperature, statistical significance expressed as bold.
Table 3.
The medians (25th‐75th percentile), percent change values, and statistical analyses for insulin, PTH, and prolactin measurements in plain gel separator tubes with PIC addition after centrifugation which were stored at 4°C or RT, until analyzed at 6, 24, 48, and 72 hours in 10 healthy adults
| 0 hour | 6 hours | 24 hours | 48 hours | 72 hours | |
|---|---|---|---|---|---|
| Insulin | |||||
| RT | |||||
| Median (mU/L) | 8.5 | 7.5 | 6.4 | 6.0 | 5.6 |
| 25‐75p | 4.6‐15.7 | 4.0‐14.1 | 3.7‐12.6 | 3.5‐12.3 | 3.4‐11.6 |
| %Change | −11.5 | −23.9 | −29.5 | −33.3 | |
| P | .005 | .005 | .005 | .005 | |
| 4°C | |||||
| Median (mU/L) | 8.6 | 8.3 | 7.8 | 7.7 | 7.3 |
| 25‐75p | 4.6‐15.7 | 4.5‐15.2 | 4.3‐14.9 | 4.1‐14.6 | 4.1‐14.7 |
| %Change | −1.9 | −7.8 | −9.3 | −13.4 | |
| P | .025 | .005 | .008 | .005 | |
| Parathyroid hormone | |||||
| RT | |||||
| Median (ng/L) | 37.1 | 37.6 | 38.7 | 37.3 | 36.4 |
| 25‐75p | 26.0‐47.9 | 26.1‐48.9 | 27.4‐49.4 | 26.4‐49.1 | 25.7‐48.2 |
| %Change | 1.5 | 4.5 | 0.7 | −1.8 | |
| P | .007 | .005 | .028 | .203 | |
| 4°C | |||||
| Median (ng/L) | 37.1 | 36.9 | 37.2 | 37.5 | 38.7 |
| 25‐75p | 26.0‐47.9 | 25.8‐48.9 | 26.7‐49.2 | 26.6‐50.7 | 27.4‐51.6 |
| %Change | −0.4 | 0.4 | 1.1 | 4.4 | |
| P | .139 | .007 | .007 | .005 | |
| Prolactin | |||||
| RT | |||||
| Median (μg/L) | 7.5 | 7.1 | 7 | 7 | 7 |
| 25‐75p | 5.4‐9.7 | 5.3‐9.4 | 5.0‐9.0 | 5.2‐9.0 | 4.7‐8.4 |
| %Change | −4.4 | −6.0 | −6.2 | −6.7 | |
| P | .005 | .005 | .005 | .005 | |
| 4°C | |||||
| Median (μg/L) | 7.47 | 7.48 | 7.1 | 7.31 | 6.67 |
| 25‐75p | 5.4‐9.7 | 5.5‐9.7 | 5.1‐9.2 | 5.3‐9.3 | 4.9‐8.6 |
| %Change | 0.1 | −5.0 | −2.1 | −10.7 | |
| P | .838 | .005 | .005 | .005 | |
RT, room temperature, statistical significance expressed as bold.
Table 4.
The medians (25‐75 percentile), percent change values, and statistical analyses for PTH and prolactin measurements in plain gel separator tubes with PIC addition before centrifugation, which were stored at 4°C or RT, until analyzed at 6, 24, 48, and 72 hours in 10 healthy adults
| 0 hour | 6 hours | 24 hours | 48 hours | 72 hours | |
|---|---|---|---|---|---|
| Parathyroid hormone | |||||
| RT | |||||
| Median (ng/L) | 36.7 | 38.7 | 39.0 | 38.0 | 37.8 |
| 25‐75p | 26.7‐48.5 | 27.0‐48.7 | 27.3‐49.2 | 25.9‐47.8 | 25.6‐46.7 |
| %Change | 5.6 | 6.3 | 3.7 | 2.9 | |
| P | .012 | .007 | .333 | .169 | |
| 4°C | |||||
| Median (ng/L) | 36.7 | 37.3 | 37.4 | 38.5 | 39.4 |
| 25‐75p | 26.7‐48.5 | 26.6‐49.1 | 27.2‐49.6 | 27.4‐50.3 | 28.0‐51.9 |
| %Change | 1.8 | 2.1 | 5.0 | 7.4 | |
| P | .009 | .005 | .007 | .005 | |
| Prolactin | |||||
| RT | |||||
| Median (μg/L) | 7.37 | 7.33 | 7.25 | 7.32 | 7.36 |
| 25‐75p | 5.5‐9.5 | 5.5‐9.6 | 5.5‐9.4 | 5.4‐9.3 | 5.1‐8.8 |
| %Change | −0.5 | −1.6 | −0.7 | −0.1 | |
| P | .343 | .038 | .009 | .021 | |
| 4°C | |||||
| Median (μg/L) | 7.4 | 7.7 | 7.33 | 7.57 | 6.98 |
| 25‐75p | 5.5‐9.5 | 5.6‐9.8 | 5.3‐9.3 | 5.7‐9.6 | 5.1‐8.9 |
| %Change | 4.3 | −0.5 | 2.7 | −5.3 | |
| P | .008 | .066 | .007 | .005 | |
RT, room temperature, statistical significance expressed as bold.
Table 5.
The medians (25‐75 percentile), percent change values, and statistical analyses for insulin, PTH, and prolactin measurements in plain gel separator tubes with aprotinin which were stored at 4°C or RT, until analyzed at 6, 24, 48, and 72 hours in 10 healthy adults
| 0 hour | 6 hours | 24 hours | 48 hours | 72 hours | |
|---|---|---|---|---|---|
| Insulin | |||||
| RT | |||||
| Median (mU/L) | 8.9 | 8.4 | 7.5 | 7.3 | 7.0 |
| 25‐75p | 4.8‐15.4 | 4.4‐14.3 | 4.1‐12.8 | 4.1‐12.1 | 3.9‐11.4 |
| %Change | −6.4% | −15.9% | −18.1% | −21.7% | |
| P | .005 | .005 | .005 | .005 | |
| 4°C | |||||
| Median (mU/L) | 8.9 | 8.8 | 9.0 | 8.9 | 8.6 |
| 25‐75p | 4.8‐15.4 | 4.8‐15.1 | 4.6‐15.2 | 4.7‐15.2 | 4.7‐14.9 |
| %Change | −1.2 | 1.1 | −0.1 | −3.5 | |
| P | .005 | .138 | .074 | .008 | |
| Parathyroid hormone | |||||
| RT | |||||
| Median (ng/L) | 38.03 | 38.21 | 37.33 | 34.78 | 34.04 |
| 25‐75p | 28.4‐52.5 | 27.7‐52.5 | 28.4‐51.4 | 26.2‐50.1 | 25.1‐47.9 |
| %Change | 0.5 | −1.8 | −8.5 | −10.5 | |
| P | .721 | .169 | .005 | .005 | |
| 4°C | |||||
| Median (ng/L) | 38.03 | 38.29 | 38.09 | 38.41 | 39.28 |
| 25‐75p | 28.4‐52.5 | 28.3‐53.1 | 29.0‐52.9 | 28.6‐54.2 | 29.2‐54.8 |
| %Change | 0.7 | 0.2 | 1.0 | 3.3 | |
| P | .386 | .019 | .013 | .005 | |
| Prolactin | |||||
| RT | |||||
| Median (μg/L) | 7.84 | 7.99 | 8 | 7.9 | 7.95 |
| 25‐75p | 5.7‐10.0 | 5.9‐10.2 | 5.8‐10.1 | 5.9‐10.0 | 5.4‐9.4 |
| %Change | 1.9 | 2.0 | 0.8 | 1.4 | |
| P | .005 | .44 | .202 | .074 | |
| 4°C | |||||
| Median (μg/L) | 7.84 | 8 | 7.83 | 8.18 | 7.67 |
| 25‐75p | 5.7‐10.0 | 5.9‐10.1 | 5.8‐10.1 | 6.2‐10.5 | 5.7‐9.7 |
| %Change | 2.0 | −0.1 | 4.3 | −2.2 | |
| P | .005 | .953 | .005 | .005 | |
RT, room temperature, statistical significance expressed as bold.
Table 6.
The medians (25‐75 percentile), percent change values, and statistical analyses for insulin, PTH, and prolactin measurements in K2‐EDTA tubes which were stored at 4°C or RT, until analyzed at 6, 24, 48, and 72 hours in 10 healthy adults
| 0 hour | 6 hours | 24 hours | 48 hours | 72 hours | |
|---|---|---|---|---|---|
| Insulin | |||||
| RT | |||||
| Median (mU/L) | 9.1 | 9.0 | 9.3 | 9.4 | 9.3 |
| 25‐75p | 5.0‐15.8 | 5.0‐15.6 | 5.1‐15.8 | 5.2‐16.1 | 5.0‐16.1 |
| %Change | −1.4 | 2.3 | 3.3 | 2.5 | |
| P | .022 | .114 | .007 | .074 | |
| 4°C | |||||
| Median (mU/L) | 9.1 | 8.9 | 8.9 | 9.0 | 8.7 |
| 25‐75p | 5.0‐15.7 | 4.9‐15.3 | 4.9‐15.3 | 5.0‐15.6 | 4.9‐15.4 |
| %Change | −1.7 | −2.2 | −1.5 | −4.2 | |
| P | .005 | .028 | .047 | .009 | |
| Parathyroid hormone | |||||
| RT | |||||
| Median (ng/L) | 43.51 | 44.81 | 41.85 | 41.31 | 40.82 |
| 25‐75p | 31.7‐58.1 | 31.9‐57.8 | 30.6‐53.6 | 30.2‐51.4 | 30.4‐50.6 |
| %Change | 3.0 | −3.8 | −5.1 | −6.2 | |
| P | .173 | .017 | .005 | .005 | |
| 4°C | |||||
| Median (ng/L) | 43.51 | 42.48 | 41.98 | 40.55 | 39.39 |
| 25‐75p | 31.7‐58.1 | 31.5‐57.3 | 30.6‐51.7 | 29.6‐47.8 | 29.2‐44.8 |
| %Change | −2.4 | −3.5 | −6.8 | −9.5 | |
| P | .333 | .005 | .005 | .005 | |
| Prolactin | |||||
| RT | |||||
| Median (μg/L) | 8.135 | 8.36 | 8.195 | 8.445 | 8.14 |
| 25‐75p | 5.9‐10.1 | 6.2‐10.4 | 5.9‐10.1 | 6.4‐10.4 | 5.8‐9.9 |
| %Change | 2.8 | 0.7 | 3.8 | 0.1 | |
| P | .005 | .154 | .005 | .041 | |
| 4°C | |||||
| Median (μg/L) | 8.135 | 8.41 | 8.07 | 8.27 | 7.99 |
| 25‐75p | 5.9‐10.1 | 6.1‐10.5 | 6.2‐10.2 | 6.4‐10.2 | 5.8‐10.2 |
| %Change | 3.4 | −0.8 | 1.7 | −1.8 | |
| P | .009 | .059 | .103 | .722 | |
RT, room temperature, statistical significance expressed as bold.
Insulin samples in plain gel separator tubes, to which PIC was added after centrifugation, exhibited a significant decrease (−11.5%) at 6 hours when kept at RT until analysis. This decrease progressed and exceeded the DBL starting from 24 hours and reached to −33.3% at 72 hours. When kept at 4°C, a significant decrease (−7.8%) could be observed at 24 hours, which progressed and reached to −13.4% at 72 hours, all of which were within DBL. PTH levels exhibited an initial increase at 6 and 24 hours at RT. By 48 and 72 hours, the levels were not statistically different than the baseline levels. When kept at 4°C, an increase was observed at 24 and 72 hours, all of which were within DBL. Prolactin levels were decreased by 6 hours of waiting at RT before analysis, which continuously progressed until 72 hours, but were within DBL. When kept at 4°C, decreases were observed at 24 and 48 hours, which had exceeded the DBL at 72 hours (Table 3).
PTH samples in plain gel separator tubes, to which PIC was added before centrifugation, exhibited a slight increase which was significant at 6 and 24 hours, but were not different than the baseline levels at 48 and 72 hours at RT. When the samples were stored at 4°C, PTH levels exhibited a progressive increase starting from 6 hours and up to 72 hours. All observed differences were within DBL. Prolactin levels exhibited a slight decrease, which only reached significance at 48 hours with a value of −0.7%. When kept at 4°C, prolactin samples exhibited slight but significant increases and decreases, but all were within DBL. Insulin determinations were not included, as the addition of PIC before centrifugation resulted in >50% reduction in concentrations due to hemolysis interference16 (Table 4).
Insulin samples in plain gel separator tubes, to which aprotinin was added, exhibited a significant and progressive decrease from starting by 6 hours and exceeded the DBL at and after 24 hours at RT. When kept at 4°C, the only significant decrease from the baseline levels was observed at 72 hours, which was within DBL. PTH levels, when kept at RT, exhibited a significant decrease at 48 hours which progressed and exceeded DBL at 72 hours. When kept at 4°C, a slight increase was observed, which only reached significance at 72 hours, which was still within DBL. Prolactin levels did not exhibit any significant change when kept at RT until 72 hours. When kept at 4°C, the levels showed slight increases up to 4.3% of the baseline, which peaked at 48 hours. All observed differences were within DBL (Table 5).
Insulin samples in K2EDTA tubes, when kept at RT, exhibited slight increases after 24 hours, which reached significance at 48 hours. When kept at 4°C, exhibited slight decreases which reached significance at 6 and 72 hours. All observed differences were within DBL. PTH levels, when kept at RT, exhibited significant decreases at 48 and 72 hours. Of these, only the 72 hours values at RT exceeded the DBL. When kept at 4°C, a progressive decrease was observed, which reached significance at 24 hours and exceeded DBL at 72 hours. Prolactin levels exhibited slight increases at RT, which reached significance at 6 and 48 hours. When samples were kept at 4°C, the only significant change observed was a 3.4% increase at 6 hours. All observed differences were within DBL (Table 6).
Insulin stored at RT exhibited significant decreases starting from 6 hours and the decreases had exceeded DBL by 24 hours. Among the protease inhibitors tested, only K2EDTA preserved insulin at RT. When kept at 4°C, insulin stayed within DBL with all the protease inhibitors tested and even in plain gel separator tubes. PTH exceeded the DBL when stored at RT for 48 hours or longer. Only addition of PIC before or after centrifugation inhibited its protease associated degradation at RT. Since the added PIC amount was less when added after centrifugation, it was also more economical. The addition of PIC before centrifugation led to hemolysis, which enhanced the insulin degradation through proteases. Prolactin generally remained stable in all conditions tested at RT and 4°C, except in tubes where PIC was added after centrifugation at 72 hours. All parameters in the plain gel separator tubes remained within DBL when stored at 4°C until 72 hours (Figures 1).
Figure 1.
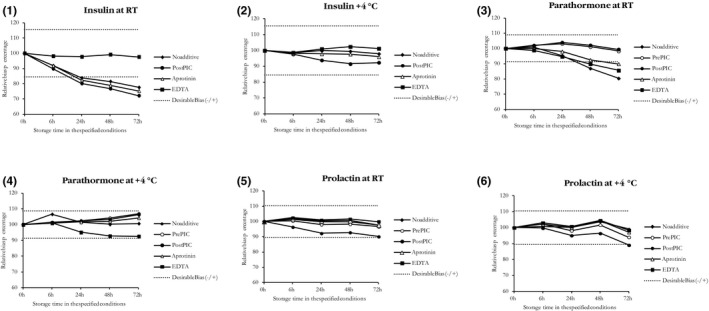
Median insulin, parathyroid hormone and prolactin concentrations over time under various conditions expressed as percentage of the concentration at time (T)=0. RT, room temperature; Post PIC, protease inhibitor cocktail addition after centrifugation; Pre PIC, protease inhibitor cocktail addition before centrifugation
4. Discussion
We have shown that the protease inhibitors tested increased the stability of peptide hormones, especially when the samples were kept at room temperature until analyzed and also that keeping the samples at 4°C exhibited a good stability in most instances.
Insulin samples in plain gel separator tubes exhibited decreases starting at 6 hours when kept at RT, which had exceeded the DBL by 24 hours. The data were in accordance with the data presented by Oddoze et al.11 Similarly, storing at 4°C maintained stability up to 72 hours. The addition of PIC after centrifugation or aprotinin into the tubes kept at RT could not prevent protease‐associated decreases in insulin concentrations, which exceeded the DBL. Only K2EDTA preserved the insulin in samples kept at RT, which is consistent with the WHO report—‐a meta‐analysis that combines the results of several stability studies with lack of homogeneity regarding pre‐analytical duration tested and the preservatives used.17 In addition to the WHO report, we observed that stability was maintained in our study up to 72 hours if kept at 4°C. Therefore, if insulin tests are to be analyzed in samples in plain gel separator tubes kept at RT, it is of utmost importance that they are analyzed within 6 hours. If the analysis will not be performed during this period, drawing samples into K2EDTA tubes and/or preserving the samples at 4°C should be preferred.
Consistent with previous reports, we found that PTH levels in samples without protease inhibitors to be significantly decreased starting from 24 hours, which exceeded DBL at 48 and 72 hours when stored at RT.18, 19 Additionally, we have shown that storing the samples at 4°C, even without protease inhibitors preserves PTH levels. Among the protease inhibitors tested in this study, only PIC was able to prevent PTH degradation in samples stored at RT for 72 hours. These findings indicate that PTH degradation in blood specimen is protease dependent, and various proteases, including especially serine proteases, act together to degrade PTH in blood specimens. Our data suggest PIC for longer stability and that with EDTA the observed bias exceeds DBL when compared to previous reports of Teal et al.20, who reported that PTH remained stable in EDTA plasma for up to 48 hours at room temperature, and Evans et al.16, who provided data showing that PTH remained stable in EDTA‐plasma for 36 hours at 30°C. These discrepancies are likely to be due to differences in EDTA concentrations. In the current study, K2‐EDTA used had a final concentration of about 5000 μmol/L to obtain plasma, which is high enough to remove almost all metal ions in blood samples including zinc, calcium, and copper.21 According to our study, we conclude that the best option for the stability of PTH is to store the samples at 4°C without any protease inhibitor addition.
Samples for prolactin determination, either with or without protease inhibitors, showed some increases or decreases which were within DBL, but samples in plain gel separator tubes with PIC added after centrifugation stored at 4°C exceeded DBL at 72 hours. Our results for plain samples and those containing K2EDTA were in accordance with Oddoze et al.11 We have shown that storing the samples up to 72 hours in plain gel separator tubes either at RT or at 4°C ensures stability.
In the kit inserts used, there is no specific data regarding stability of insulin and prolactin in the sample, only recommendations about on‐board stability because of evaporation. For PTH, immediate centrifugation is recommended because of short half‐life of the peptide, which was the procedure applied in this article. It is also stated that K3‐EDTA plasma should be preferred because it is more stable (2 days at RT), which is non‐consistent with our findings. Our data showed that by 48 hours, PTH exceeded DBL and that addition of PIC protected the PTH better at RT.
Human plasma and serum proteins are subject to intrinsic proteolytic degradation both during and after blood collection. Yi et al.22 indicated that plasma peptides were significantly different from serum peptides. Intrinsic proteases caused these differences between plasma and serum samples, as well as the differences among three plasma samples using either EDTA, sodium citrate, or heparin as the anticoagulant, which accounts for partial inhibitory effects on plasma proteolytic activities. After degradation, proteins were expected to fall apart in different fragments, but these degradation products will not affect the measured hormone level. In their study, van Ballegooijen et al.23 measured PTH using a second‐generation immunoassay that is specific to whole‐molecule (1,84) PTH. Although this assay cross reacts with exogenous 7,84 PTH fragments synthesized in the laboratory, there is no evidence that 7,84 PTH fragments circulate in normal individuals. For PTH, our assay uses double monoclonal antibodies; therefore, we did not expect any cross reactivity for degradation products.
Stability of the molecules in tubes until analysis has always been an important issue of discussion. As sample tubes are transferred from peripheral institutions to central laboratories, the number of handling procedures the tube is subjected increases, the physical conditions vary, and the duration between sampling and analysis increase, all of which may increase the instability of the peptide hormones in the sample. There is also growing awareness about the stability of peptide hormones, and the necessity of protease inhibitors in the sample to prevent the cleavage and degradation of small peptides by proteolytic hormones is discussed.14 Tubes with protease inhibitors are even produced for proteomic analyses, but the stability routinely analyzed peptide hormones should be understood and recognized by laboratorians. Since samples for these parameters are usually taken in a single tube to be analyzed with other hormone and clinical chemistry parameters, a common solution that preserves them all should always be preferred.
According to our knowledge, this is the only study that compares the protective effect of three different protease inhibitors on the stability of insulin, parathyroid hormone, and prolactin under different lag times and storage conditions until analysis. We investigated the impact of pre‐analytical conditions for three hormones and other laboratories can easily apply a similar approach to enhance the data. These results, which were obtained with the reagents, methods and instruments of our laboratory, should be verified with other vendors’ reagents and methods. Our study was performed on healthy donors and although it reflects a large percent of the population, further studies with pathological samples will increase the data range. According to our study, we conclude that different proteases in circulation may degrade peptide hormones, and measures should be taken to counteract these effects especially if there will be a lag period between sampling and analysis as we observe in instances where samples are transported between laboratories.
Baykan O, Yaman A, Gerin F, Sirikci O, Haklar G. The effect of different protease inhibitors on stability of parathyroid hormone, insulin, and prolactin levels under different lag times and storage conditions until analysis. J Clin Lab Anal. 2017;31:e22144 10.1002/jcla.22144
References
- 1. Plebani M. Errors in laboratory medicine and patient safety: the road ahead. Clin Chem Lab Med. 2007;45:700–707. [DOI] [PubMed] [Google Scholar]
- 2. Astion ML, Shojania KG, Hamill TR, Kim S, Ng VL. Classifying laboratory incident reports to identify problems that jeopardize patient safety. Am J Clin Pathol. 2003;120:18–26. [DOI] [PubMed] [Google Scholar]
- 3. Simundic A‐M, Lippi G. Preanalytical phase–a continuous challenge for laboratory professionals. Biochem Medica [Internet]. 2012;22:145–149. [DOI] [PMC free article] [PubMed] [Google Scholar]
- 4. Rai AJ, Gelfand CA, Haywood BC, et al. HUPO Plasma Proteome Project specimen collection and handling: towards the standardization of parameters for plasma proteome samples. Proteomics. 2005;5:3262–3277. [DOI] [PubMed] [Google Scholar]
- 5. Hsieh S, Chen R, Pan Y, Lee H. Systematical evaluation of the effects of sample collection procedures on low‐molecular‐weight serum/plasma proteome profiling. Proteomics. 2006;6:3189–3198. [DOI] [PubMed] [Google Scholar]
- 6. Sacks DB, Endres DB, Rude RK, Demers LM. Ch.24,39 and 41 In: Burtis CA, Ashwood ER, eds. Tietz Textbook of Clinical Chemistry, 3rd edn Philadelphia, PA: W.B. Saunders;1999:750–808, 1395,–1457, 1470–1495. [Google Scholar]
- 7. Gerhartz B, Niestroj AJ. Enzyme classes and mechanisms In: Smith HJ, Simon C, eds. Proteinase and Peptidase Inhibition: Recent Potential Targets for Drug Development. London, New York, NY: Taylor and Francis;2002:1–20. [Google Scholar]
- 8. Garcia‐Touchard A, Henry TD, Sangiorgi G, et al. Extracellular proteases in atherosclerosis and restenosis. Arterioscler Thromb Vasc Biol. 2005;25:1119–1127. [DOI] [PubMed] [Google Scholar]
- 9. CLSI . Procedures for the Handling and Processing of Blood Specimens for Common Laboratory Tests; Approved Guideline‐Fourth Edition. CLSI document H18‐A4. Wayne, PA: Clinical Laboratory and Standards Institute; 2010. [Google Scholar]
- 10. Heins M, Heil W, Withold W. Storage of serum or whole blood samples? Effects of time and temperature on 22 serum analytes. Clin Chem Lab Med. 1995;33:231–238. [DOI] [PubMed] [Google Scholar]
- 11. Oddoze C, Lombard E, Portugal H. Stability study of 81 analytes in human whole blood, in serum and in plasma. Clin Biochem. 2012;45:464–469. [DOI] [PubMed] [Google Scholar]
- 12. La'ulu S, Straseski J, Schmidt R, Genzen J. Thrombin‐mediated degradation of parathyroid hormone in serum tubes. Clin Chim Acta. 2014;437:191–196. [DOI] [PubMed] [Google Scholar]
- 13. Hanon EA, Sturgeon CM, Lamb EJ. Sampling and storage conditions influencing the measurement of parathyroid hormone in blood samples: a systematic review. Clin Chem Lab Med. 2013;51:1925–1941. [DOI] [PubMed] [Google Scholar]
- 14. Bowen RAR, Remaley AT. Interferences from blood collection tube components on clinical chemistry assays. Biochemia Medica. 2014;24:31–44. [DOI] [PMC free article] [PubMed] [Google Scholar]
- 15. Westgard QC. Desirable specifications for total error, imprecision, and bias, derived from intra‐ and inter ‐ individual biological variation. [Internet]. http://www.westgard.com/biodatabase1.htm. Accessed January 20, 2016.
- 16. Evans M, Livesey J, Ellis M, Yandle T. Effect of anticoagulants and storage temperatures on stability of plasma and serum hormones. Clin Biochem. 2001;34:107–112. [DOI] [PubMed] [Google Scholar]
- 17. Quality of diagnostic samples. Recommendations of the Working Group on Preanalytical Quality of the German Society for Clinical Chemistry and Laboratory Medicine. WHO/DIL/LAB.99.1 Rev, 2;2009:85 p.
- 18. Kim YS, Kwon HJ, Lee HK. The comparison of parathyroid hormone degradation effect by various protease inhibitors in blood specimen. Korean J Lab Med [Internet]. 2009;29:104–109. [DOI] [PubMed] [Google Scholar]
- 19. Anderson NR, Nicholas J, Holland MR, Gama R. Effect of a protease inhibitor on in vitro stability of intact parathyroid hormone. Ann Clin Biochem. 2003;40(Pt 2):188–190. [DOI] [PubMed] [Google Scholar]
- 20. Teal TK, Reed M, Stevens PE, Lamb EJ. Stability of parathyroid hormone ex vivo in haemodialysis patients. Ann Clin Biochem. 2003;40(Pt 2):191–193. [DOI] [PubMed] [Google Scholar]
- 21. National Committee for Clinical Laboratory Standards . Tubes and Additives for Venous Blood Specimen Collection; Approved Standard, H1‐A5. Wayne, PA: National Committee for Clinical Laboratory Standards; 2003. [Google Scholar]
- 22. Yi J, Kim C, Gelfand CA. Inhibition of intrinsic proteolytic activities moderates preanalytical variability and instability of human plasma. J Proteome Res. 2007;6:1768–1781. [DOI] [PubMed] [Google Scholar]
- 23. van Ballegooijen AJ, Rhee EP, Elmariah S, Boer IH, Kestenbaum B. Renal clearance of mineral metabolism biomarkers. J Am Soc Nephrol. 2016;27:392–397. [DOI] [PMC free article] [PubMed] [Google Scholar]