

Abstract
Background
Fecal calprotectin assays are widely used to exclude inflammatory bowel disease (IBD) in patients with suspected IBD. A problem with the fecal calprotectin assays is the rather long test‐turnaround times. A particle enhanced turbidimetric immunoassays (PETIA) for fecal calprotectin would reduce test‐turnaround times and would permit more laboratories to perform the measurements. The aim of this study was to evaluate a new feces calprotectin PETIA.
Method
Using routine fecal samples the feces calprotectin PETIA was validated on two chemistry analyzers, Mindray BS‐380 and Cobas 501.
Results
The assay is linear in the range 11–2000 μg/g, with a limit of quantitation of approximately 10 μg/g. No antigen excess hook effect was observed up to 10 000–15 000 μg/g depending on the instrument used. The turbidimetric method showed a good agreement with the Bühlmann ELISA. The total coefficient of variation was 3%–8% in the 50–100 μg/g range.
Conclusion
The fecal calprotectin PETIA, fCal Turbo, is well suited for rapid analysis of fecal calprotectin on Mindray BS‐380 or Cobas 501 clinical chemistry analyzers. The test results are commutable with Bühlmann fecal MRP8/14 ELISA.
Keywords: biological markers, calprotectin, feces, humans, inflammatory bowel diseases, method validation
1. INTRODUCTION
Many patients in primary care suffer from gastrointestinal problems.1, 2 The majority of these patients have irritable bowel syndrome (IBS) but there are also individuals with inflammatory bowel disease (IBD).3 The prevalence of IBS is between 10% and 20% worldwide, with twice the prevalence in women compared to men.4 It is important to differentiate IBD from IBS as they should be treated differently. IBD involves chronic inflammation of all or part of the colon and small intestine. Crohn's disease and ulcerative colitis are the principal types of inflammatory bowel disease.5
The most widely used blood markers for IBD have been C reactive protein (CRP) and erythrocyte sedimentation rate (ESR) but leukocyte count, albumin, and α1 acid glycoprotein have also been used.6, 7 Fecal calprotectin was introduced approximately two decades ago as a marker of inflammatory bowel disease,8, 9 and has over the years been shown to have a higher sensitivity and specificity for IBD than ESR.10, 11 Fecal calprotectin is mainly released from granulocytes in inflamed areas in the gut.12 Calprotectin represents approximately 30%–40% of the cytosol protein content in neutrophils.13 The calprotectin molecule consists of the two subunits S100A8 (MRP8) and S100A9 (MRP14), two members of the S100 family.14, 15
Most fecal calprotectin assays utilizes microtiter plates. Microtiter plate based assays are usually associated with longer test‐turnaround times as the laboratory tries to fill the whole plate with patient samples before performing the assays. Thus, the test‐turnaround times for fecal calprotectin are longer than for plasma CRP that is analyzed on chemistry analyzers in a random access mode. CRP is usually determined using particle enhanced turbidimetric immunoassays (PETIA) on the chemistry analyzers available at hospital laboratories. The development of PETIA also for fecal calprotectin would permit more laboratories to perform the measurements with short test‐turnaround times.
The aim of the present study was to validate a new PETIA for fecal calprotectin and compare the results of the assay with the Bühlmann ELISA (fCAL; MRP8/14; S100A8/A9).
2. MATERIALS AND METHODS
2.1. Samples
Anonymous leftovers from fecal samples analyzed in the routine work were used for the method validation. Frozen samples were thawed, weighted and extracted according to manufacturer's instructions.
The study was approved by the local ethical board (01‐367) and complied with the World Medical Association Declaration of Helsinki regarding ethical conduct of research.
2.2. Immunoparticles and reaction buffer
fCal Turbo reagent (BÜHLMANN, Schönenbuch, Switzerland) was evaluated on Mindray™ BS‐380 (Mindray Medical International, Shenzhen, China) and Cobas c501, Roche Diagnostics (Mannheim, Germany). The reagent kit contains Reaction Buffer (R1) and Immunoparticles (R2).
2.3. Calibrators
Human calprotectin from granulocyte extracts in BÜHLMANN B‐CAL‐EX™ extraction buffer was used to achieve six calibrator levels: 0, 50, 192, 468, 934 and 1862 μg/g. The calprotectin concentration of the calibrator was assigned via a value transfer protocol toward BÜHLMANN Calprotectin ELISA.
2.4. Controls
Controls were prepared by adding human calprotectin from granulocyte extracts into BÜHLMANN B‐CAL‐EX™ extraction buffer. Two levels were prepared; 75 μg/g and 250 μg/g.
2.5. Instruments
A set of parameter settings was optimized for the Fecal Calprotectin Immunoassay on Mindray™ BS‐380 (Mindray Medical International) and Cobas c501, Roche Diagnostics. The parameter settings are presented in Table 1. For the method comparison, the samples were measured on both the turbidimetric fecal calprotectin immunoassay and BÜHLMANN fCAL ELISA from Bühlmann Laboratories AG, Schönenbuch, Switzerland.
Table 1.
Parameter settings for Mindray BS‐380 and Cobas c501
| Parameter | Mindray BS‐380 | Cobas c501 |
|---|---|---|
| Sample volume (μL) | 10 | 10 |
| R1 volume (μL) | 150 | 100 |
| R2 volume (μL) | 30 | 20 |
| Primary‐/secondary Wavelength (nm) | 546/– | 546/800 |
| Reading times ([cycles]/s) | [37–58]/252 | [36–55]/152 |
2.6. Limit of quantitation (LoQ)
Four samples at different concentration levels ranging from 10 to 25 μg/g were prepared by diluting the extracts from fecal samples (assigned with reference method, Buhlmann ELISA) with extraction buffer supplied from the manufacturer. The theoretical concentration of the diluted samples was calculated using dilution factor and assigned sample value. The diluted samples were aliquoted and frozen at −20°C. Aliquots were measured in 12 replicates during the 3 days. In total, 36 measurements for each concentration level were performed.
Coefficient of variations (CV's) and biases from theoretical values were calculated and the total error results decided by the root mean square method. LoQ was determined to be the lowest concentration where the total error was below 20%.
2.7. Antigen excess
A calprotectin stem solution was prepared by extracting cytosol containing a high level of calprotectin from human granulocytes. The high‐level antigen excess sample was prepared by adding this stem solution into BÜHLMANN B‐CAL‐EX Extraction buffer to a calprotectin concentration of approximately 24 000 μg/g.
From the stem solution, a high‐concentration antigen excess sample was prepared. A dilution series of eight samples was made from the high‐concentration antigen excess sample, ranging from 2.5% to 100% of the original sample. All samples were measured in duplicate. The antigen excess occurs at the concentration, where the turbidimetric result of the measured sample is both lower than expected value and below the value of the highest calibrator.
2.8. Linearity
The preparation of the linearity series was carried out by diluting a high‐fecal calprotectin sample with a low fecal calprotectin sample in different concentrations, ranging from 100% to 0%. The series included eleven levels. The expected value of each level in the series was calculated from the assigned value of the high‐ and low‐fecal calprotectin sample and the amount of high‐ and low sample at each level. All samples were measured in duplicates and the deviation from the expected value was calculated.
2.9. Precision
Four samples in the range 40–1400 μg/g and two controls (Low and High) were aliquoted and stored at −20°C. Before analysis samples were thawed and immediately analyzed in duplicates. After a minimum of 2 hours, a new run of duplicate measurements were performed. This procedure was repeated for 6 days for Cobas c501 and 20 days for BS‐380. A new calibration curve was established every sixth day. Within run, between run and between day CVs were calculated.
2.10. Calibration curve stability
The samples used for the calibration curve stability study were prepared and stored the same way as the samples for the precision study.
On the BS‐380, the set of samples were measured in triplicates twice on day 0. The mean values of each sample were used as the baseline value. For each week, a set of the samples were brought to room temperature and measured in triplicates. The mean values were compared to the baseline values and the recoveries were calculated. A recovery from baseline of 100±20% was acceptable.
When the precision study was finished on Cobas c501, the last established calibration curve was used for measuring the same set of samples for 4 more weeks in order to investigate the on‐board calibration curve stability. The results were compared to the baseline values. The study failed when any of the samples had a recovery outside the range 100±20%.
2.11. Sample carry over
The design of the sample carry over experiment follows the recommendations in the National Committee for Clinical Laboratory Standards (NCCLS) document EP10‐A2, Vol. 22, No. 29, Preliminary Evaluation of Quantitative Clinical Laboratory Methods.
Three samples at different levels (low, medium, high), ranging from 40 to 1100 μg/g were aliquoted and stored at −20°C. Samples were thawed and four medium samples, three low‐ and three high samples were analyzed in a special sequence during 5 days.
2.12. Interference
The interference study was carried out on the BS‐380 instrument only. The list of substances tested is shown in Table 2. No interference was defined as a difference in measured concentration between test pool and control pool below 20% or below 10 μg/g.
Table 2.
The list of substances tested in the interference study and the effect of the addition of the tested substances on two calprotectin levels
| Substance | Concentration | Concentration | Observed difference (μg/g) between test sample and control sample | |
|---|---|---|---|---|
| In undiluted sample | In diluted sample 1:500 | Test sample low (~50 μg/g) | Test sample high (~500 μg/g) | |
| Hemoglobin | 25 g/L | 0.05 g/L | 0.35 | −0.85 |
| Intralipid | 25 g/L | 1 g/L | −3.65 | −3.35 |
| Bilirubin | 250 mg/L | 0.5 mg/L | 0.15 | 2.35 |
| Vitamin E | 300 mg/L | 12 mg/L | 1.15 | −0.65 |
| Multiple vitamins supplement | 21 500 mg/L | 43 mg/L | −2.0 | −1.5 |
| Niferex | 2000 mg/L | 4 mg/L | 0.65 | 0.35 |
| Prednisolon | 6500 mg/L | 13 mg/L | 0.5 | −1.15 |
| Imurel (Azathioprin) | 3500 mg/L | 7 mg/L | 0.65 | −2.35 |
| Pentasa (Mesalazin) | 100 000 mg/L | 200 mg/L | −2.5 | 1.0 |
| Lansoprazol | 3500 mg/L | 7 mg/L | 2.0 | 1.15 |
| Vancomycin | 40 000 mg/L | 80 mg/L | 0.35 | 0.65 |
| Sulphamethoxazol | 32 000 mg/L | 64 mg/L | 0.85 | −4.15 |
| Trimethoprim | 6500 mg/L | 13 mg/L | −0.15 | 4.15 |
| Ciprofloxacin | 4000 mg/L | 8 mg/L | 0.35 | −0.65 |
2.13. Method comparison
Ninety‐one samples, in the range 30–1574 μg/g, were measured with the turbidimetric calprotectin immunoassay on Mindray BS‐380 and the Fecal calprotectin ELISA from Bühlmann Laboratories AG. The results were compared according to CLSI guideline EP09‐A2 by applying an OLR analysis on the results. The coefficient of determination and slope was investigated. In addition, an Altman Bland test was carried out to investigate the average bias between the methods.
For the Passing–Bablok linear regression analysis and an Altman Bland test we used Analyse‐it for Microsoft Excel (Leeds, UK). The Bühlmann ELISA method was the comparative method.
3. RESULTS
3.1. Limit of quantitation
Four samples at different concentration levels ranging from 10 μg/g to 25 μg/g were analyzed during 3 days in 12 replicates. LoQ was determined as the lowest concentration where the total error was below 20%. The total error for Cobas c501 was 19.6% at 20 μg/g and the total error for BS‐380 was 17% at 11 μg/g.
3.2. Antigen excess
The effects of high concentrations of calprotectin were analyzed to define antigen excess points. Obtained results indicate that antigen excess occurs at a concentration between 9400 μg/g and 14 000 μg/g for Cobas c501, and concentration between 10 000 μg/g and 16 500 μg/g for BS‐380.
3.3. Linearity
Dilution series were prepared for the instruments. The high samples and the low samples for each instrument were assigned, and the theoretical value for all levels in the series were calculated from these. The results listed in the Table 3a (Cobas c501) and b (BS‐380) suggests that the assay is linear, according to the preset criteria, within the range between LoQ and the highest calibrator standard for all three instruments.
Table 3.
Linearity testing of the F‐calprotectin method on (a) Cobas c501 and (b) Mindray BS‐380. A high sample was diluted with a low sample to achieve different F‐calprotectin concentrations. The observed values were compared with the expected values and the recovery was calculated. The linearity is acceptable according to the preset criteria for the (a) Cobas c501 and (b) Mindray BS‐380 in the entire range tested
| Fraction of high (%) | Observed value (μg/g) | Expected value (μg/g) | Recovery (%) |
|---|---|---|---|
| (a) Cobas c501 | |||
| 100 | 1966 | 1955 | 100.6 |
| 80 | 1565 | 1565 | 99.9 |
| 60 | 1194 | 1176 | 101.5 |
| 40 | 836 | 787 | 106.2 |
| 20 | 443 | 398 | 111.3 |
| 10 | 226 | 203 | 110.9 |
| 5 | 127 | 106 | 119.4 |
| 2.5 | 66 | 57 | 115.1 |
| 1.25 | 38 | 33 | 115.2 |
| 0.625 | 25 | 21 | 117.6 |
| 0 | 9 | 9 | 103.8 |
| (b) Mindray BS‐380 | |||
| 100 | 2154 | 2146 | 100.3 |
| 80 | 1713 | 1719 | 99.7 |
| 60 | 1297 | 1291 | 100.4 |
| 40 | 873 | 864 | 101.1 |
| 20 | 437 | 436 | 100.1 |
| 10 | 229 | 222 | 103.1 |
| 5 | 124 | 116 | 107.1 |
| 2.5 | 66 | 62 | 105.9 |
| 1.25 | 36 | 35 | 100.3 |
| 0.625 | 24 | 22 | 109.0 |
| 0 | 9 | 9 | 103.8 |
3.4. Precision
The 6 days precision study shows that an imprecision less than 8.1% should be expected for samples between 37.8 and 919 μg/g. On the BS‐380, the imprecision of the 20 days study was observed to be less than 4.5% for all samples ranging from 49 to 1392 μg/g. For more detailed information about the imprecisions observed, see Table 4a and b.
Table 4.
Precision data for the F‐calprotectin method on (a) Cobas c501 and (b) Mindray BS‐380. The total coefficient of variation (CV) was calculated for four different sample concentrations and two control levels
| Sample 1 | Sample 2 | Sample 3 | Sample 4 | Control low | Control high | |
|---|---|---|---|---|---|---|
| (a) Cobas c501 | ||||||
| n | 24 | 24 | 24 | 24 | 24 | 24 |
| Mean | 37.8 | 90.5 | 380 | 919 | 76 | 256.2 |
| CV | 8.13 | 6.14 | 2.26 | 1.61 | 4.52 | 1.57 |
| (b) Mindray BS‐380 | ||||||
| n | 80 | 80 | 80 | 80 | 80 | 80 |
| Mean | 49 | 82 | 248 | 1392 | 77 | 256 |
| CV | 4.5 | 3.5 | 1.9 | 0.6 | 3.2 | 1.7 |
3.5. Calibration curve stability
The calibration curve stability study was only carried out on BS‐380. On the Cobas c501, the on‐board calibration curve stability was investigated by extending the precision study 4 weeks after the last calibration. The samples measured had an acceptable recovery to baseline after 25 days, suggesting an on‐board calibration curve stability of at least 25 days for the turbidimetric fecal calprotectin assay on Cobas c501. Since the reagent cassette was empty after 25 days further testing was not possible. Recovery from baseline in the range 99%–105% implies an on‐board stability significant longer than 25 days.
The samples measured at week 10 of the calibration curve stability study on the BS‐380 showed a recovery between 89% and 101%. The observed calibration curve stability was in this study 10 weeks.
3.6. Interference
The F‐calprotectin results after addition of potentially interfering substances was compared with the original (control) F‐calprotectin result. None of the tested substances caused a clinically significant effect (defined as a difference between test and control sample of <10 μg/g or 20%) on the assay results (Table 2).
3.7. Method comparison
Method comparison was performed between the turbidimetric assay on BS‐380 instrument and ELISA method. Analyzing the results from the comparison of the turbidimetric assay on BS‐380 to ELISA with a Passing–Bablok linear regression analysis, gave an intercept of −5.16 [−14.8 to 1.3] and a slope of 1.04 [0.97 to 1.10] (Fig. 1).
Figure 1.
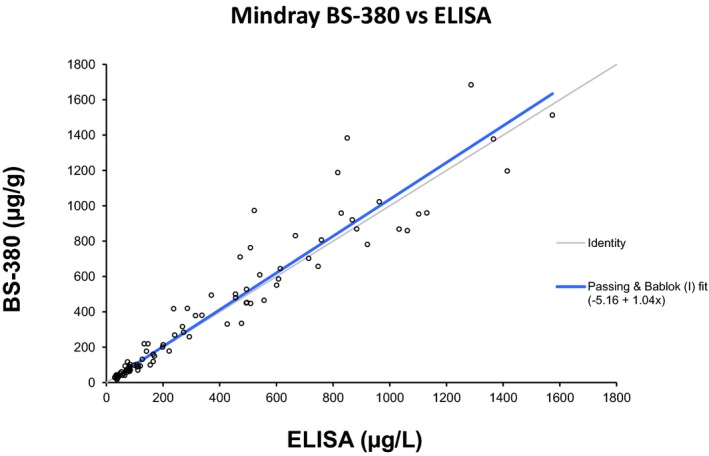
Passing–Bablok method comparison between the BÜHLMANN fCAL ELISA and the turbidimetric assay performed on the Mindray BS‐380. The Passing–Bablok regression analysis gave a slope of 1.04 and an intercept of −5.16
We also performed a method comparison between the turbidimetric assay on Cobas c501 and BS‐380. There was a very strong correlation between the two instruments with a Passing–Bablok fit of 2.45+1.02x, Fig. 2.
Figure 2.
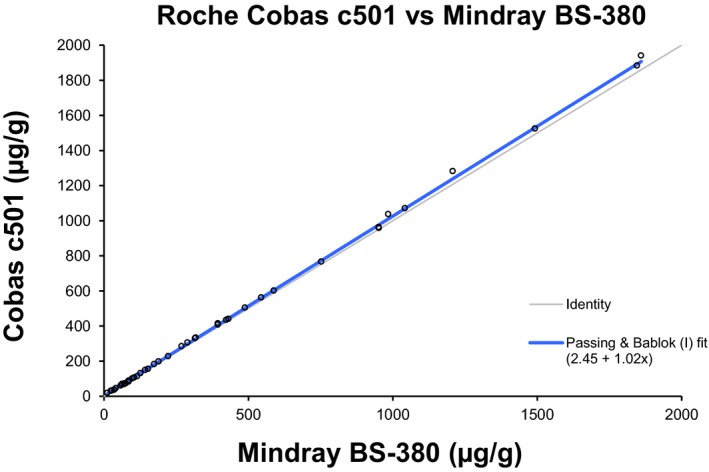
Passing–Bablok method comparison between the turbidimetric assay performed on the Mindray BS‐380 and Cobas c501
4. DISCUSSION
Endoscopic evaluation with ileocolonoscopy is the gold standard for the diagnosis of IBD but the endoscopies are invasive, costly, and time‐consuming. Patients with inflammatory disorders often have elevated levels of calprotectin in blood or feces.16, 17, 18, 19 The main clinical use of calprotectin is, however, as a fecal marker to exclude IBD.20 Traditionally, F‐calprotectin has been analyzed by ELISA using microtiter plates. The microtiter format favors batch analysis of samples which leads to longer test‐turnaround time in comparison with random access testing. The current turbidimetric assay has an assay time of approximately 10 minutes and if the instrument used allows automatic reruns with lower sample volumes/higher dilutions if the highest standard point is exceeded a rerun can be performed within 10 additional minutes.
Some laboratories may have concerns regarding running fecal samples on their routine serum instruments. In the present study, we did not observe any problems when running the fecal samples on our instruments. Most laboratory are today running urine samples on their serum platforms without any problems and several of these samples have high‐bacterial counts due to urinary infections. The fecal samples are prediluted 500 times with extraction buffer and centrifuged prior to loading the samples onto the instrument, which reduces the amounts of bacteria and particles.
We evaluated the reagent on two different instrument platforms, Cobas c501 and Mindray™ BS‐380. The instruments were chosen to cover different assay capacities. Cobas c501 has the highest assay capacity of the two instruments and it is present in many clinical laboratories. The results show that the reagent can be applied on the Cobas c501 platform and it is probably the most convenient alternative for the laboratories that have c501 instruments. The Mindray™ BS‐380 resembles a Hitachi 717 instrument and could be used as a dedicated instrument for fecal samples if the laboratory is concerned about running fecal samples on their main chemistry analyzer.
Our study shows that the turbidimetric reagent had a good agreement with the BÜHLMANN fCAL ELISA with a slope close to 1.0. We observed no interference problems, the reagents had good stabilities and the method had a good linearity and precision on the investigated assay platforms.
In conclusion, the fCal Turbo PETIA is well suited for rapid analysis of fecal calprotectin on Mindray BS‐380 or Cobas c501 analyzers providing short test turn‐around times. The test results are commutable with Bühlmann fecal MRP8/14 ELISA.
CONFLICT OF INTEREST
Tom Nilsen and Kathrin Sunde are employed by Gentian who developed the turbidimetric immunoassay evaluated in this paper.
ACKNOWLEDGMENTS
This study was supported by EU through the Eurostar project E!7991 Fecal‐Calprotectin.
REFERENCES
- 1. Gikas A, Triantafillidis JK. The role of primary care physicians in early diagnosis and treatment of chronic gastrointestinal diseases. Int J Gen Med. 2014;7:159–173. [DOI] [PMC free article] [PubMed] [Google Scholar]
- 2. Jones R. Primary care research and clinical practice: Gastroenterology. Postgrad Med J. 2008;84:454–458. [DOI] [PubMed] [Google Scholar]
- 3. Long MD, Drossman DA. Inflammatory bowel disease, irritable bowel syndrome, or what?: A challenge to the functional‐organic dichotomy. Am J Gastroenterol. 2010;105:1796–1798. [DOI] [PubMed] [Google Scholar]
- 4. Plavsic I, Hauser G, Tkalcic M, et al. Diagnosis of irritable bowel syndrome: Role of potential biomarkers. Gastroenterol Res Pract. 2015;2015:490183. [DOI] [PMC free article] [PubMed] [Google Scholar]
- 5. Costa F, Mumolo MG, Ceccarelli L, et al. Calprotectin is a stronger predictive marker of relapse in ulcerative colitis than in Crohn's disease. Gut. 2005;54:364–368. [DOI] [PMC free article] [PubMed] [Google Scholar]
- 6. Vermeire S, Van AG, Rutgeerts P. Laboratory markers in IBD: Useful, magic, or unnecessary toys? Gut. 2006;55:426–431. [DOI] [PMC free article] [PubMed] [Google Scholar]
- 7. Menees SB, Powell C, Kurlander J, et al. A meta‐analysis of the utility of C‐reactive protein, erythrocyte sedimentation rate, fecal calprotectin, and fecal lactoferrin to exclude inflammatory bowel disease in adults with IBS. Am J Gastroenterol. 2015;110:444–454. [DOI] [PubMed] [Google Scholar]
- 8. Kennedy NA, Clark A, Walkden A, et al. Clinical utility and diagnostic accuracy of faecal calprotectin for IBD at first presentation to gastroenterology services in adults aged 16‐50 years. J Crohns Colitis. 2015;9:41–49. [DOI] [PMC free article] [PubMed] [Google Scholar]
- 9. Ikhtaire S, Shajib MS, Reinisch W, et al. Fecal calprotectin: Its scope and utility in the management of inflammatory bowel disease. J Gastroenterol. 2016;51:434–446. [DOI] [PubMed] [Google Scholar]
- 10. Schoepfer AM, Beglinger C, Straumann A, et al. Fecal calprotectin more accurately reflects endoscopic activity of ulcerative colitis than the Lichtiger Index, C‐reactive protein, platelets, hemoglobin, and blood leukocytes. Inflamm Bowel Dis. 2013;19:332–341. [DOI] [PubMed] [Google Scholar]
- 11. Waugh N, Cummins E, Royle P, et al. Faecal calprotectin testing for differentiating amongst inflammatory and non‐inflammatory bowel diseases: Systematic review and economic evaluation. Health Technol Assess. 2013;17:xv‐211. [DOI] [PMC free article] [PubMed] [Google Scholar]
- 12. Roseth AG, Schmidt PN, Fagerhol MK. Correlation between faecal excretion of indium‐111‐labelled granulocytes and calprotectin, a granulocyte marker protein, in patients with inflammatory bowel disease. Scand J Gastroenterol. 1999;34:50–54. [DOI] [PubMed] [Google Scholar]
- 13. Costa F, Mumolo MG, Bellini M, et al. Role of faecal calprotectin as non‐invasive marker of intestinal inflammation. Dig Liver Dis. 2003;35:642–647. [DOI] [PubMed] [Google Scholar]
- 14. Foell D, Wittkowski H, Ren Z, et al. Phagocyte‐specific S100 proteins are released from affected mucosa and promote immune responses during inflammatory bowel disease. J Pathol. 2008;216:183–192. [DOI] [PubMed] [Google Scholar]
- 15. Brophy MB, Nakashige TG, Gaillard A, et al. Contributions of the S100A9 C‐terminal tail to high‐affinity Mn(II) chelation by the host‐defense protein human calprotectin. J Am Chem Soc. 2013;135:17804–17817. [DOI] [PMC free article] [PubMed] [Google Scholar]
- 16. Yui S, Nakatani Y, Mikami M. Calprotectin (S100A8/S100A9), an inflammatory protein complex from neutrophils with a broad apoptosis‐inducing activity. Biol Pharm Bull. 2003;26:753–760. [DOI] [PubMed] [Google Scholar]
- 17. Berntzen HB, Fagerhol MK. L1, a major granulocyte protein; isolation of high quantities of its subunits. Scand J Clin Lab Invest. 1990;50:769–774. [DOI] [PubMed] [Google Scholar]
- 18. Fernandes SR, Santos P, Fatela N, et al. Ascitic calprotectin is a novel and accurate marker for spontaneous bacterial peritonitis. J Clin Lab Anal. 2016; doi: 10.1002/jcla.21994 [Epub ahead of print]. [DOI] [PMC free article] [PubMed] [Google Scholar]
- 19. Pergialiotis V, Konstantopoulos P, Karampetsou N, et al. Calprotectin levels in necrotizing enterocolitis: A systematic review of the literature. Inflamm Res. 2016; [Epub ahead of print]. [DOI] [PubMed] [Google Scholar]
- 20. Walsham NE, Sherwood RA. Fecal calprotectin in inflammatory bowel disease. Clin Exp Gastroenterol. 2016;9:21–29. [DOI] [PMC free article] [PubMed] [Google Scholar]