

Abstract
Objectives
T‐SPOT.TB is a promising diagnosis tool to identify both pulmonary tuberculosis and extrapulmonary tuberculosis, as well as latent tuberculosis; however, the factors that affect the results of T‐SPOT.TB remains unclear. In this study, we aim to figure out the risk factor of T‐SPOT.TB for active TB.
Methods
A total of 349 patients were recruited between January 1st, 2016 and January 22st, 2017 at Renmin Hospital of Wuhan University, including 98 subjects with TB and 251 subjects with non‐TB disease, and received T‐SPOT.TB (Oxford Immunotec Ltd). Statistics were analyzed by SPSS 19.0 using logistic regression.
Results
The overall specificity and sensitivity of the T‐SPOT.TB was 92.83% (233/251; 95%CI 0.8872‐0.9557) and 83.67% (82/98; 95%CI 0.7454‐0.9010), respectively. Patients with tuberculous meningitis were more likely to have false‐negative results (OR 17.4, 95%CI 3.068‐98.671; P<.001) while patients with cured TB tended to induce false‐positive results (OR 30.297; 95%CI 7.069‐129.849; P<.001). The results were not affected by sex, age, onset time, smoke, alcohol, treatment, allergic history, co‐morbidity, TB (exclude tuberculous meningitis) (P>.05).
Conclusion
Tuberculous meningitis was a risk factor of false‐negative for T‐SPOT.TB, while cured TB was a risk factor of false‐positive.
Keywords: diagnosis, risk factor, TB, T‐SPOT, tuberculosis
1. INTRODUCTION
With the drug resistance being serious, tuberculosis (TB) reminds a major concern among the world. Its nearly three million of people in the world to develop active TB without being diagnosed every year,1 inducing constantly transmission in community. TB is diagnosed by epidemiological, clinical and radiographic characteristics and confirmed by microbiology or pathology traditionally.2 This strategy is dollar‐costing, time‐consuming, lame in specific or sensitivity, and laborious. Promising are the methods including the tuberculin skin test (TST) and the interferon gamma release assays (IGRAs), including the QuantiFERON‐TB Gold In‐Tube Test (QFT‐GIT) and T‐SPOT.TB, which can identify latent tuberculosis (LTBI) infection and active TB infection and has a promising performance in diagnosing active extrapulmonary TB.3, 4
While the TST using a single antigen which could be affected by BCG, QFT‐GIT and T‐SPOT.TB perform greater in specific and sensitive, partly owing to their improved antigen,5 making them replace TST for identifying of LTBI.6 Although the diagnostic efficiency of IGRAs is better than that of TST, its still not good enough for clinical diagnosis to distinguish active TB from health control in some case, as IGRA only use IFN‐γ as marker of tuberculosis infection, making it provides limited information.7, 8 Thus, in this study, we try to figure out the risk factor for false‐positive and false‐negative of T‐SPOT.TB in patient with active TB.
2. MATERIALS AND METHODS
2.1. Study participants
All 779 patients who were suspected tuberculosis were enrolled between November 7th, 2016 and January 22nd, 2017 at Renmin Hospital of Wuhan University. A total of 306 subjects were included after screening. A total of 44 subjects with different kinds of TB were added in this study between January 1st, 2016 and November 7th, 2016, as subject with extra‐pulmonary TB were relatively seldom. Finally, 349 subjects were included in our study including 98 subjects with TB and 251 subjects with non‐TB disease. 24 of the 251 subjects with non‐TB disease had a cured TB history (Figure 1). Clinical information of patients was collected from hospital information system (Table 1). These information included: sex, age, onset time, smoke history, alcohol history, treatment (non‐anti TB) history, allergic history, co‐morbidity (include kidney stone, COPD, anemia, central nervous system (CNS) infection, myocardial infarction, diabetes, pulmonary infection, pleural effussion, liver dysfunction, hypertension, malignancy, urinary infection, pyemia), TB (include pulmonary tuberculosis, tuberculous meningitis, tuberculous pleurisy, intestinal tuberculosis, tuberculosis synovitis, spinal tuberculosis, pelvic tuberculosis, urinary tuberculosis and lymph node tuberculosis) and cured TB history with other disease.
Figure 1.
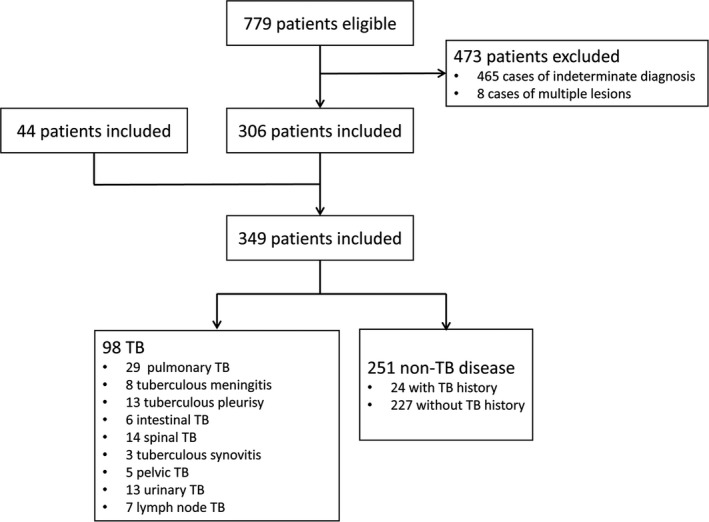
Flow diagram summarizing patient recruitment
Table 1.
Clinical characteristic of TB patients, cured TB patients and patients with other disease
| Risk factor | TB (n=98) | Cured TB (n=24) | Other disease (n=227) | |
|---|---|---|---|---|
| Male/Female | 55:43 | 19:5 | 138:89 | |
| Age | <30 | 21 | 0 | 101 |
| 30~60 | 48 | 6 | 75 | |
| ≥60 | 28 | 18 | 51 | |
| Onset time | <1 mnoth | 44 | 17 | 65 |
| 1 m~1 y | 35 | 1 | 46 | |
| ≥1 year | 19 | 6 | 116 | |
| Smoke | 12 | 8 | 28 | |
| Alcohol | 7 | 4 | 11 | |
| Treatment | 28 | 10 | 133 | |
| Allergic | 9 | 2 | 24 | |
| Co‐morbidity | Kidney stone | 10 | 0 | 7 |
| COPD | 0 | 7 | 8 | |
| Anemia | 4 | 4 | 17 | |
| CNS infect | 1 | 0 | 10 | |
| Myocardial infarction | 3 | 2 | 9 | |
| Diabetes | 8 | 5 | 12 | |
| Pulmonary infection | 18 | 11 | 135 | |
| Pleural effussion | 5 | 2 | 19 | |
| Liver dysfunction | 2 | 0 | 15 | |
| Hypertension | 16 | 8 | 34 | |
| Malignancy | 3 | 2 | 25 | |
| Urinary infection | 11 | 0 | 14 | |
Confirmed TB had to satisfy one of following conditions: (1) identification of bacillus in specimen or tissue by acid fast staining, or by culture, or by PCR, or by the pathological report; and (2) clinical, radiographic, and other supporting test programs characteristics and medical history suggested TB. Meanwhile, TB were diagnosed by physicians and patients improved with anti‐TB treatment. Confirmed non‐TB had to satisfy the following: (1) clinical, radiographic, and other supporting test programs characteristics and medical history suggest non‐TB; and (2) diagnosed non‐TB by physicians and improved without anti‐TB treatment. All diagnoses were made by two physicians. If the two physicians were divided about the diagnosis, then a third physician was referred. Exclusion criteria included: (1) any indeterminate diagnosis judged by physicians; and (2) multiple lesions in different tissue or system.
2.2. T‐SPOT.TB assay
We carried out the T‐SPOT.TB test (Oxford Immunotec Ltd, Oxford, UK) according to the manufacturer's instructions. Peripheral blood (5 mL) of subjects included in our study was collected into sodium heparin tubes, than diluted by an equal volume of RPMI 1640 medium (Shanghai Haoran, Shanghai, China). Peripheral blood were layered onto Ficoll‐Paque Plus lymphocytes separation medium (Shanghai Hengxin, China) at ration of 4:1, and centrifuged at 1000 RCF (g) for 22 minutes at room temperature (18‐25°C). Collect the cloudy peripheral blood mononuclear cells (PBMCs) layer into clean centrifuge tubes. Wash PBMCs with 10 mL RPMI 1640 by centrifuging at 600 RCF (g) for 7 minutes at 18°C (two times). Pour the supernatant off, and resuspend the PBMCs with 0.5 mL AIM‐V (Invitrogen). Transferring 100 μL of the PBMCs into new tubes and calculated the number of cell by automatic blood cell counter (XS‐1000i; Sysmex, Shanghai, China). Adjust the suspend to 250 000 cells/100 μL. Add 50 μL PHA, antigen‐A (ESAT‐6), antigen‐B (CFP‐10), AIM into positive control well, A well, B well, negative control well, respectively. Add 100 μL 250 000 cells/100 μL suspend into each well and place the plate in incubator at 37°C 5%CO2 for 16‐24 hours. Pour and wash the well with 200 μL PBS for three times. Add 50 μL secondary antibody into each wells and incubate the plate for 1 hour. Pour and wash the well again. Add 50 μL substrate solution into each well and protected from light for 7 minutes. Wash the plate thoroughly with distilled water to stop the reaction. Count the spot through plate reader. All blood samples were processed within 4 hours. The spot that is at least 6 or twice compared to the negative control well, would be considered positive.
2.3. Statistical analysis
Sex, age, onset time, smoke, alcohol, treatment (non‐anti TB), allergic history, co‐morbidity (include kidney stone, COPD, anemia, CNS infection, myocardial infarction, diabetes, pulmonary infection, pleural effussion, liver dysfunction, hypertension, malignancy, urinary infection, pyemia), type of TB (include pulmonary tuberculosis, tuberculous meningitis, tuberculous pleurisy, intestinal tuberculosis, tuberculosis synovitis, spinal tuberculosis, pelvic tuberculosis, urinary tuberculosis and lymph node tuberculosis) and cured TB were enrolled into the logistic regression analysis. Age and onset time were divided into three dummy variable. The variable would be include into multiple logistic regression analysis if the P‐value <.2. Odd rations (OR) were analyzed by logistic regression. P‐value <.05 would be considered significant. All statistics were analyzed by SPSS 19.0 (IBM, Armonk, NY, USA).
3. RESULT
3.1. Diagnostic efficiency of T‐SPOT.TB
In this study, the specificity and sensitivity of the T‐SPOT.TB was 92.83% (233/251; 95% CI 0.8872‐0.9557) and 83.67% (82/98; 95% CI 0.7454‐0.9010), respectively. The sensitivity of T‐SPOT.TB in pulmonary tuberculosis, tuberculous meningitis, tuberculous pleurisy, intestinal tuberculosis, tuberculosis synovitis, spinal tuberculosis, pelvic tuberculosis, urinary tuberculosis and lymph node tuberculosis was 89.66% (26/29), 25.00% (2/8), 92.31% (12/13), 83.3% (5/6), 66.66% (2/3), 71.43% (10/14), 100% (5/5), 92.31% (12/13), 100% (7/7), respectively.
3.2. Risk factor of false‐negative
To investigate the risk factor of false‐negative, logistic regression analysis was performed involving different variable including sex, age, onset time, smoke, alcohol, treatment, allergic, co‐morbidity and TB type. Multiple logistic regression was performed if P value lower than .20 in binary logistic regression. The result suggested that sex, age between 30 and 60 years, age >60 years, onset time, smoke, alcohol, treatment, allergic, co‐morbidity and TB type excluding tuberculous meningitis play no significant role in false‐negative. Age <30 and tuberculous meningitis was significant in binary logistic regression. However, only tuberculous meningitis whose OR value, 95% CI and P value was 17.4, (3.068,98.671), <0.001, respectively, was significant in multiple logistic regression. The rest of variable such as sex, age between 30 to 60, age ≥60, onset time, smoke, alcohol, treatment, allergic history, co‐morbidity, pulmonary tuberculosis, tuberculous pleurisy, intestinal tuberculosis, tuberculosis synovitis, spinal tuberculosis, pelvic tuberculosis, urinary tuberculosis and lymph node tuberculosis were not the risk factor (P>.05) of false‐negative (Table 2).
Table 2.
Univariate and multivariate analysis logistic regression analysis of risk factor of false‐negative in 98 TB patients
| Risk factor | n | True‐positive | False‐negative | Univariate | Multivariate | |||||
|---|---|---|---|---|---|---|---|---|---|---|
| OR value | 95% CI | P value | OR value | 95% CI | P value | |||||
| Sex | 55 | 43 | 12 | 2.065 | (0.666,6.406) | .209 | ||||
| Age | <30 | 21 | 20 | 1 | 0.188 | (0.023,1.505) | .115 | 0.29 | (0.035,2.41) | .252 |
| 30~60 | 47 | 37 | 10 | 1.66 | (0.575,4.798) | .349 | ||||
| ≥60 | 28 | 22 | 6 | 1.438 | (0.474,4.36) | .521 | ||||
| Onset time | <1 mo | 44 | 36 | 8 | 1.086 | (0.38,3.102) | .877 | |||
| 1 mo~1 y | 34 | 27 | 7 | 1.374 | (0.471,4.011) | .561 | ||||
| >1 y | 19 | 17 | 2 | 0.494 | (0.103,2.374) | .379 | ||||
| Smoke | 12 | 9 | 3 | 1.69 | (0.406,7.042) | .471 | ||||
| Alcohol | 7 | 5 | 2 | 2 | (0.354,11.293) | .433 | ||||
| Treatment | 28 | 21 | 7 | 1.967 | (0.663,5.83) | 1.967 | ||||
| Allergic | 9 | 7 | 2 | 1.39 | (0.263,7.363) | .698 | ||||
| Co‐morbidity | Kidney stone | 10 | 7 | 3 | 2.235 | (0.515,9.704) | .283 | |||
| Anemia | 4 | 3 | 1 | 1.604 | (0.157,16.428) | .691 | ||||
| Myocardial infarction | 3 | 3 | 0 | 0 | (0,0) | 1 | ||||
| Diabetes | 8 | 7 | 1 | 0.652 | (0.075,5.674) | .698 | ||||
| Pulmonary infection | 18 | 13 | 5 | 2.147 | (0.646,7.133) | .212 | ||||
| Pleural effussion | 5 | 4 | 1 | 1.187 | (0.124,11.342) | .881 | ||||
| Hypertension | 16 | 13 | 3 | 1.214 | (0.303,4.874) | .784 | ||||
| Malignancy | 3 | 3 | 0 | 0 | (0,0) | 1 | ||||
| Urinary infection | 11 | 10 | 1 | 0.438 | (0.052,3.667) | .446 | ||||
| TB | Pulmonary | 29 | 26 | 3 | 0.445 | (0.117,1.686) | .234 | |||
| Meningitis | 8 | 2 | 6 | 21.273 | (3.808,118.834) | <.001 | 17.4 | (3.068,98.671) | .001 | |
| Pleurisy | 13 | 12 | 1 | 0.354 | (0.043,2.925) | .335 | ||||
| Intestinal | 6 | 5 | 1 | 0.938 | (0.102,8.579) | .954 | ||||
| Synovitis | 3 | 2 | 1 | 2.469 | (0.211,28.892) | .471 | ||||
| Spinal | 14 | 10 | 4 | 2.154 | (0.586,7.918) | .248 | ||||
| Pelvic | 5 | 5 | 0 | 0 | (0,0) | 1 | ||||
| Urinary | 13 | 12 | 1 | 0.354 | (0.043,2.925) | .335 | ||||
| Lymph node | 7 | 7 | 0 | 0 | (0,0) | 1 | ||||
3.3. Risk factor of false‐positive
To investigate the risk factor of false‐positive, logistic regression analysis was performed involving different variable including sex, age, onset time, smoke, alcohol, treatment, allergic, co‐morbidity and cured TB. Similarly, multiple logistic regression was performed if P value lower than .20 in binary logistic regression. The result demonstrated that sex, age between 30 and 60, age ≥60, smoke, alcohol, diabetes, cured TB was significant in binary logistic analysis. But only cured TB whose OR value, 95% CI and P value was 30.297, (7.069, 129.849), <0.001, respectively, was significant in multiple logistic analysis. The rest of variable such as age<30, onset time, treatment, allergic history, co‐morbidity (excluding diabetes) were not risk factor (P>.05) of false‐positive (Table 3).
Table 3.
Univariate and multivariate analysis logistic regression analysis of risk factor of false‐positive in 251 non‐TB patients
| Risk factor | n | True‐negative | False‐positive | Univariate | Multivariate | |||||
|---|---|---|---|---|---|---|---|---|---|---|
| OR value | 95% CI | P value | OR value | 95% CI | P value | |||||
| Sex | 251 | 233 | 18 | 2.203 | (0.703,6.902) | .175 | 1.723 | (0.38,7.812) | .481 | |
| Age | <30 | 101 | 101 | 0 | 0 | (0,0) | .996 | |||
| 30~60 | 81 | 72 | 9 | 2.236 | (0.852,5.868) | .102 | 0 | (0,0) | .996 | |
| ≥60 | 69 | 60 | 9 | 2.883 | (1.094,7.602) | .032 | 0 | (0,0) | .997 | |
| Onset time | <1 mo | 182 | 168 | 14 | 1.354 | (0.43,4.266) | .605 | |||
| 1 mo~1 y | 47 | 45 | 2 | 0.522 | (0.116,2.353) | .398 | ||||
| >1 y | 22 | 20 | 2 | 1.331 | (0.285,6.208) | .716 | ||||
| Smoke | 36 | 30 | 6 | 3.383 | (1.181,9.691) | .023 | 1.105 | (0.235,5.191) | .900 | |
| Alcohol | 16 | 13 | 3 | 3.683 | (0.937,14.48) | .062 | 1.359 | (0.192,9.627) | .759 | |
| Treatment | 142 | 134 | 8 | 0.602 | (0.229,1.579) | .302 | ||||
| Allergic | 26 | 24 | 2 | 1.083 | (0.235,5) | .918 | ||||
| Co‐morbidity | Kidney stone | 7 | 7 | 0 | 0 | (0,0) | .999 | |||
| COPD | 15 | 13 | 2 | 2.115 | (0.439,10.197) | .35 | ||||
| Anemia | 21 | 19 | 2 | 1.408 | (0.301,6.587) | .664 | ||||
| CNS infection | 10 | 10 | 0 | 0 | (0,0) | .999 | ||||
| Myocardial infarction | 11 | 10 | 0 | 1.312 | (0.158,10.863) | .801 | ||||
| Diabetes | 17 | 13 | 4 | 4.835 | (1.394,16.777) | .013 | 1.902 | (0.374,9.679) | .439 | |
| Pulmonary infection | 146 | 136 | 10 | 0.892 | (0.339,2.341) | .816 | ||||
| Pleural effussion | 21 | 19 | 2 | 1.408 | (0.301,6.587) | .664 | ||||
| Liver dysfunction | 15 | 15 | 0 | 0 | (0,0) | .999 | ||||
| Hypertension | 42 | 38 | 4 | 1.466 | (0.458,4.697) | .519 | ||||
| Malignancy | 27 | 25 | 2 | 1.04 | (0.226,4.79) | .96 | ||||
| Urinary infection | 14 | 13 | 1 | 0.995 | (0.123,8.072) | .997 | ||||
| Pyemia | 17 | 17 | 0 | 0 | (0,0) | .999 | ||||
| Cured TB | 24 | 12 | 12 | 36.833 | (11.789,115.082) | <.001 | 30.297 | (7.069,129.849) | <.001 | |
3.4. Dummy variables analysis
To investigate the relationship between dummy variables, we analyzed three dummy variables in age group or onset time group. Age <30 (n=21 in false‐negative; n=101 in false positive) group was defined as v1:v2(1,0). Age between 30 and 60 group (n=48 in false‐negative; n=81 in false positive) was defined as v1:v2(0,1). Age ≥60 group (n=28 in false‐negative; n=69 in false positive) was defined as v1:v2(0,0). Onset time <1 month group (n=44 in false‐negative; n=182 in false positive) was defined as v1:v2(1,0), onset time between 1 month and 1 year group (n=35 in false‐negative; n=47 in false positive) was defined as v1:v2(0,1). Onset time >1 year group (n=19 in false‐negative; n=22 in false positive) was defined as v1:v2(0,0). Different dummy variables were defined as reference variables to compare the relationship between each other. The result revealed that there was no significance (P>.05) between each dummy variables of the age or onset time (Table 4).
Table 4.
Dummy variables analysis of risk factor of false‐negative and false‐positive in age group and onset time group
| Risk factor | Observation variable | Reference variable | False‐negative | False‐positive | ||||
|---|---|---|---|---|---|---|---|---|
| OR value | 95% CI | P value | OR value | 95% CI | P value | |||
| Age | <30 | ≥60 | 0 | (0,0) | .996 | 0.22 | (0.024, 2.048) | .183 |
| 30~60 | ≥60 | 0 | (0,0) | .996 | 0.611 | (0.159, 2.353) | .474 | |
| 30~60 | <30 | 1.38 | (0.243, 7.832) | .716 | 2.778 | (0.303, 25.462) | .366 | |
| Onset time | <1 mo | ≥1 y | 0.894 | (0.098, 8.203) | .921 | 0.750 | (0.114, 4.923) | .764 |
| 1 mo~1 y | ≥1 y | 2.683 | (0.282, 25.568) | .391 | 1.889 | (0.341, 10.459) | .466 | |
| <1 mo | 1 mo~1 y | 0.333 | (0.020, 5.664) | .447 | 2.519 | (0.576, 11.01) | .220 | |
4. DISCUSSION
Our study demonstrated the performance of T‐SPOT.TB. For diagnostic efficiency, the T‐SPOT.TB performed well— the overall specificity and sensitivity of the T‐SPOT.TB was 92.83% (233/251) and 83.67% (82/98), respectively. However, the sensitivity of T‐SPOT.TB in various TB was more or less affected by its limited sample size. For risk factor of false‐negative, the initial binary logistic regression analysis indicated that age and tuberculous meningitis were risk factor for false‐negative. After multiple logistic regression analysis, age was proved to be not the risk factor of false‐negative. We found that age<30 group was affected by tuberculous meningitis group, that could be the reason why age<30 group in binary logistic regression analysis was risk factor but not in multiple logistic regression analysis. For risk factor of false‐positive, sex, age between 30 and 60, age ≥60, smoke, alcohol, diabetes and cured TB was significant in binary logistic analysis, but only cured TB was confirmed as the risk factor of false‐positive. Similarly, these variables were significant in binary logistic regression due to the effect of cured TB. Although our results indicated that age was not the risk factor for both sensitivity and specificity, it was contradictory among reports. The specificity of T.SPOT.TB were affected by age in some reports9, 10 while other reports suggested that age did not affect the result of T.SPOT.TB.11, 12 Onset time was not risk factor according to our results, while Pan et al.9 reported that period of illness longer than 6 months was risk factors for false‐negative results.
Our study indicated that tuberculous meningitis was risk factor of false‐negative, and the sensitivity of T‐SPOT.TB in patients with tuberculous meningitis was only 25.00% (2/8). That could partly due to the strict exclusion criterion, which excluded a few indeterminate diagnosis of tuberculous meningitis making the sensitivity lower relatively. However, the performance of T‐SPOT.TB in tuberculous meningitis is controversial. Qin et al.13 reported that sensitivity and specificity in patients with tuberculous meningitis was 83.00% and 82.00%, respectively. Lu et al.14 reported that sensitivity and specificity in patients with tuberculous meningitis was 70% and 87% respectively. In contrast, a prospect study suggested that tuberculous meningitis might be risk factor for false‐negative (OR=2.6; 95% CI 1.0‐6.6).6 Due to the limited sample size of patients, some kind of TB were not credible relatively such as tuberculosis synovitis (n=3). However, the T‐SPOT.TB performance in tuberculosis synovitis was rarely reported. Cheng et al.15 reported that the sensitivity and specificity of T‐SPOT.TB in patients with tuberculosis synovitis (n=6) was 67% and 69%, respectively. For other kinds of TB, a meta‐analysis noted that the sensitivity and specificity of T‐SPOT.TB and/or QFT in patients with tuberculous Pericarditis were 0.77 (95% CI, 0.71‐0.83) and 0.71 (95% CI, 0.65‐0.76), respectively16 while Bian et al.17 reported that sensitivity and specificity in tuberculous Pericarditis was 83% and 95%, respectively. Jia et al.18 noted that the overall sensitivity and specificity of T‐SPOT.TB in patients with lymph node TB was 90.4% and 70.5%, respectively. A meta‐analysis reveled that the sensitivity and specificity of IGRAs in patients with intestinal TB was 82.8% and 86.7%, respectively.19 A study included 122 patients with spinal TB demonstrated that the sensitivity and specificity of T‐SPOT.TB was 88.3% and 86.1%, respectively.20
There were some limitations in our study. Firstly, due to the limited conditions, LTBI patients was not discussed in our study. Secondly, subjects in some kind of TB type were seldom, that could more or less affect our results. Thirdly, the variable of malignancy was not concrete while the characteristic of malignancies vary from each other. Fourthly, anti‐TB treatment was not enrolled in our study as must of subject were initial treatment. Fifthly, BCG vaccination patient were not discussed in our study. Sixthly, because of the low distribution of HIV‐positive subjects in China, these individuals were not seriously distinguished in our study.
ACKNOWLEDGMENTS
We sincerely thank correspondence who guided us for this study, and we also acknowledge the reviewers and editors for viewing our work.
Di L, Li Y. The risk factor of false‐negative and false‐positive for T‐SPOT.TB in active tuberculosis. J Clin Lab Anal. 2018;32:e22273 10.1002/jcla.22273
Funding Information
Our study was supported by the National Natural Science Foundation of China[grants numbers 81572069, 2016].
REFERENCES
- 1. World Health Organization . Global Tuberculosis Report, 2014. (WHO, 2014)
- 2. Sia IG, Wieland ML. Current concepts in the management of tuberculosis. Mayo Clin Proc. 2011;86:348‐361. [DOI] [PMC free article] [PubMed] [Google Scholar]
- 3. Cho OH, Park KH, Kim SM, et al. Diagnostic performance of T‐SPOT.TB for extrapulmonary tuberculosis according to the site of infection. J Infect. 2011;63:362‐369. [DOI] [PubMed] [Google Scholar]
- 4. Azghay M, Bouchaud O, Mechaï F, et al. Utility of QuantiFERON‐TB Gold In‐Tube assay in adult, pulmonary and extrapulmonary, active tuberculosis diagnosis. Int J Infect Dis. 2016;44:25‐30. [DOI] [PubMed] [Google Scholar]
- 5. Tang XL, Zhou YX, Wu SM, et al. CFP10 and ESAT6 aptamers as effective Mycobacterial antigen diagnostic reagents. J Infect. 2014;69:569‐580. [DOI] [PubMed] [Google Scholar]
- 6. Lee YM, Park KH, Kim SM, et al. Risk factors for false‐negative results of T‐SPOT.TB and tuberculin skin test in extrapulmonary tuberculosis. Infection. 2013;41:1089. [DOI] [PubMed] [Google Scholar]
- 7. Sester M, Sotgiu G, Lange C, et al. Interferon‐gamma release assays for the diagnosis of active tuberculosis: a systematic review and meta‐analysis. Eur Respir J. 2011;37:100‐111. [DOI] [PubMed] [Google Scholar]
- 8. Yerlikaya S, Broger T, Maclean E, et al. A tuberculosis biomarker database: the key to novel TB diagnostics. Int J Infect Dis. 2017;56:253‐257. [DOI] [PubMed] [Google Scholar]
- 9. Pan L, Jia H, Liu F, et al. Risk factors for false‐negative T‐SPOT. TB, assay results in patients with pulmonary and extra‐pulmonary TB. J Infect. 2015;70:367‐380. [DOI] [PubMed] [Google Scholar]
- 10. Elzi L, Steffen I, Furrer H, et al. Improved sensitivity of an interferon‐gamma release assay (T‐SPOT.TB) in combination with tuberculin skin test for the diagnosis of latent tuberculosis in the presence of HIV co‐infection. BMC Infect Dis. 2011;11:319. [DOI] [PMC free article] [PubMed] [Google Scholar]
- 11. Lee YM, Kim SM, Su JP, et al. Indeterminate T‐SPOT.TB test results in patients withsuspected extrapulmonary tuberculosis in routine clinical practice. Infect Chemother. 2013;45:44. [DOI] [PMC free article] [PubMed] [Google Scholar]
- 12. Won B, Un PK, Song EY, et al. Comparison of the sensitivity of QuantiFERON‐TB gold in‐tube and T‐SPOT.TB according to patient age. PLoS ONE. 2016;11:e0156917. [DOI] [PMC free article] [PubMed] [Google Scholar]
- 13. Qin L, Zhang L, Zhang Y, et al. Diagnostic value of T‐cell interferon‐γ release assays on cerebrospinal fluid for tuberculous meningitis. PLoS ONE. 2014;10:e0141814. [DOI] [PMC free article] [PubMed] [Google Scholar]
- 14. Lu D, Chen C, Yu S, et al. Diagnosis of tuberculous meningitis using a combination of peripheral blood T‐SPOT.TB and cerebrospinal fluid interferon‐γ detection methods. Lab Med. 2016;47:6. [DOI] [PubMed] [Google Scholar]
- 15. Cheng XH, Bian SN, Zhang YQ, et al. Diagnostic value of T‐cell interferon‐γ release assays on synovial fluid for articular tuberculosis: a pilot study. Zhonghua Yi Xue Za Zhi. 2016;129:1171‐1178. [DOI] [PMC free article] [PubMed] [Google Scholar]
- 16. Aggarwal AN, Agarwal R, Gupta D, et al. Interferon gamma release assays for diagnosis of pleural tuberculosis: a systematic review and meta‐analysis. J Clin Microbiol. 2015;53:2451. [DOI] [PMC free article] [PubMed] [Google Scholar]
- 17. Bian S, Zhang Y, Zhang L, et al. Diagnostic value of interferon‐γ release assays on pericardial effusion for diagnosis of tuberculous pericarditis. PLoS ONE. 2016;11:e0165008. [DOI] [PMC free article] [PubMed] [Google Scholar]
- 18. Jia H, Pan L, Du B, et al. Diagnostic performance of interferon‐γ release assay for lymph node tuberculosis. Diagn Microbiol Infect Dis. 2016;85:56. [DOI] [PubMed] [Google Scholar]
- 19. Xu H, Li Y, Qian JM. A meta‐analysis of the accuracy of interferon‐γ release assays in differentiating intestinal tuberculosis from Crohn's disease in Asia. Zhonghua Nei Ke Za Zhi. 2016;55:535. [DOI] [PubMed] [Google Scholar]
- 20. Hua YZ, Cheng SY, Jiang GH, et al. Clinical value of T‐cell interferon releases detection of tuberculosis infection assay in quick diagnosis of spinal tuberculosis. Zhonghua Yi Xue Za Zhi. 2016;96:2179‐2181. [DOI] [PubMed] [Google Scholar]