Abstract
Introduction
The aim of this study was to establish reference intervals for plasma cystatin C and creatinine in adults using the Gentians cystatin C method traceable to the international calibrator standard ERM‐DA471/IFCC and a creatinine method traceable to the IDMS (Isotope Dilution Mass Spectrometry) creatinine reference method.
Methods
Blood samples were collected from 304 healthy blood donors (152 men and 152 women between 17 and 66 years old) with 30‐31 men and 30‐31 women in each ten‐year interval. Plasma cystatin C was analyzed using the Gentian Cystatin C assay on a Roche cobas c702 analyzer, and plasma creatinine was analyzed using the CREA Plus assay on the Roche Modular P analyzer.
Results
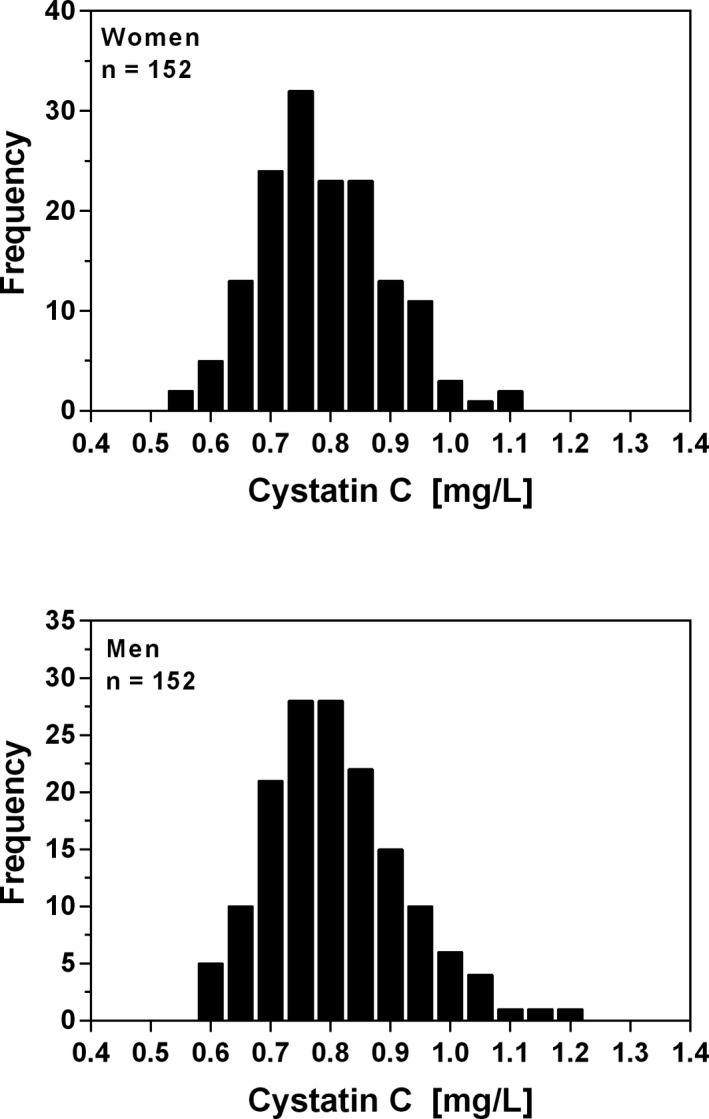
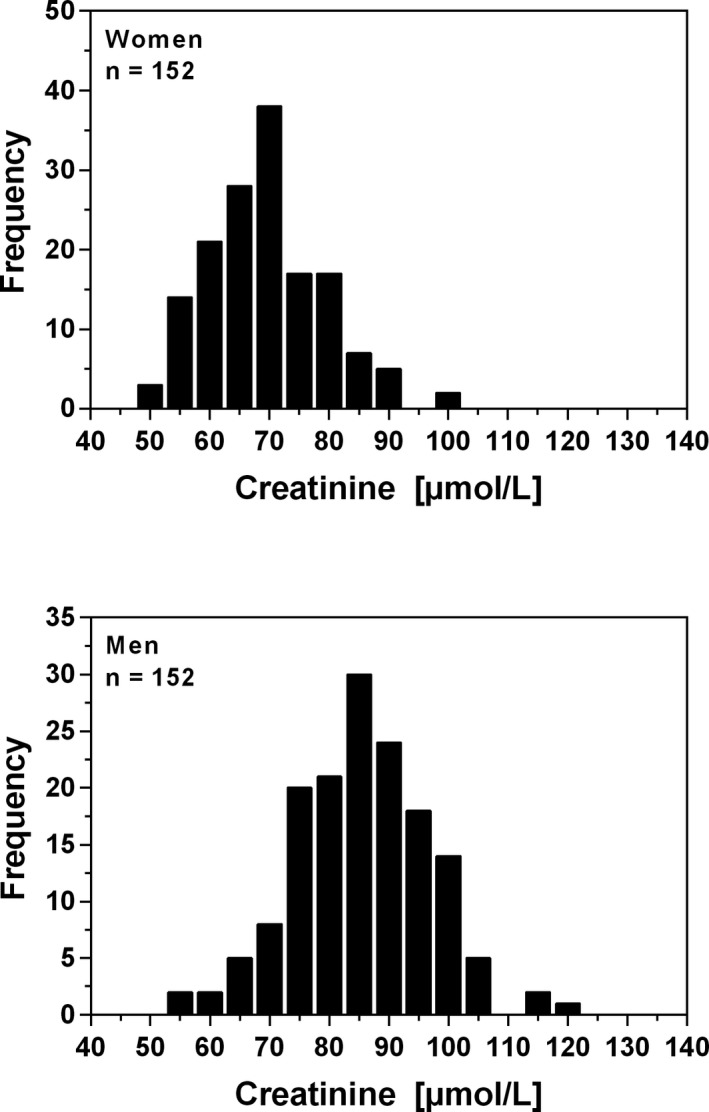
The nonparametric reference intervals for plasma cystatin C were 0.58‐1.00 mg/L in women (median 0.78 mg/L, range 0.56‐1.06 mg/L) and 0.62‐1.04 mg/L in men (median 0.79 mg/L, range 0.61‐1.07 mg/L). The Mann‐Whitney U test revealed no gender‐related difference in plasma cystatin C (P = .21). A common reference interval in women and men was calculated to be 0.61‐1.01 mg/L (median 0.79 mg/L, range 0.56‐1.07 mg/L). The nonparametric reference interval for plasma creatinine was 52‐89 μmol/L in women (median 69 μmol/L, range 52‐92 μmol/L) and 61‐108 μmol/L in men (median 86 μmol/L, range 56‐118 μmol/L). The Mann‐Whitney U test revealed a gender‐related difference in plasma creatinine (P < .0001).
Conclusion
In conclusion, we have established reference intervals for plasma cystatin C and creatinine in adults using methods traceable to international standards.
Keywords: creatinine, cystatin C, glomerular filtration rate, kidney function, reference values
1. INTRODUCTION
Accurate estimation of kidney function is central to the detection, evaluation, and treatment of chronic kidney disease.1 Glomerular filtration rate (GFR) is accepted as the best measure of kidney function and estimated GFR (eGFR) based on cystatin C, creatinine, or both are widely used in clinical practice.1
Cystatin C is a nonglycosylated, low molecular weight protein (Mr = 13359 Da).2 This protein is produced by all nucleated cells at a constant rate, freely filtered in the glomeruli and reabsorbed and catabolized in the proximal tubular cells.3, 4, 5, 6 The characteristics of cystatin C indicate that its plasma level is mainly determined by the GFR, making cystatin C an endogenous marker of GFR.7, 8 Cystatin C has been measured by different methods including particle‐enhanced turbidimetric and nephelometric immunoassays.8 Today, measurements of cystatin C are fully automated and convenient to use in clinical practice. Previously, different reference intervals were established for plasma cystatin C for the different methods, and the measurements were not comparable due to the lack of standardization.9 Since 2010, certified reference material has been available for cystatin C.9 The standardization of cystatin C has led to an increased use of cystatin C as a marker of renal function, and cystatin C is now a well‐established marker of kidney function equal to creatinine.10
Creatinine (Mr = 113.12 Da) is a chemical waste molecule that is generated from muscle metabolism. Serum or plasma creatinine concentration is widely interpreted as a measure of GFR and is used as an index of renal function in clinical practice.11 However, glomerular filtration of creatinine is only one of the variables that determines its concentration in plasma. Alterations in renal handling and metabolism of creatinine and methodological interference in its measurement may have a profound impact on the serum concentration of creatinine.12
The purpose of this study was to establish reference intervals for plasma cystatin C in adults using a cystatin C method traceable to the international calibrator standard ERM‐DA471/IFCC (International Federation of Clinical Chemistry) and verification of the NORRIP (The Nordic Reference Interval Project 2000) reference interval for plasma creatinine using a creatinine method traceable to the IDMS (Isotope Dilution Mass Spectrometry) reference method.9, 13, 14
2. MATERIALS AND METHODS
2.1. Specimen collection and handling
During a period of two months, blood samples were collected between 8 am and 6 pm from 304 nonfasting healthy blood donors (152 men and 152 women between 17 and 66 years) at the Blood Bank at the Viborg Regional Hospital. Men and women were divided into five age groups: 17‐29, 30‐39, 40‐49, 50‐59, and 60‐66 years old, with 30‐31 men and women in each age group. According to the Danish Patient Safety Authority and the local ethics committee, blood from blood donors may be used to quality assurance of routine analysis and to establishing reference intervals.
The procedure was conducted in accordance with the Helsinki Declaration, and each blood donor gave written consent to participate in the study. All blood donors should complete a detailed questionnaire on their health that was reviewed by a nurse or a doctor before blood donation could occur. In Denmark, donation of blood is voluntary and the blood donor will not be paid for it. Only Caucasians and nonpregnant women were included in the study. Blood samples were drawn from the antecubital vein using a BD Vacutainer® Lithium Heparin REF 368884 (BD, Plymouth, UK). Plasma was isolated by centrifugation at 2000 g for 12 minutes and then frozen at −80°C until the samples were analyzed. Plasma samples stored at −80°C were brought to room temperature and centrifuged before analysis. Sixty to 61 samples were analyzed in duplicate each day during a 5‐day period.
2.2. Measurement of cystatin C
Cystatin C was analyzed using the Gentian cystatin C immunoassay (REF 1101, Gentian, Moss, Norway). The Gentian cystatin C application was programed as a VIP channel method with the cobas c702 automatic analyzer (Roche, Mannheim, Germany) using the application notes and instrument settings available from Gentian at www.gentian.no. The reagents were supplied ready for use as Assay Buffer (R1) and immunoparticles (R3). Reagents were transferred into the appropriate compartments B (R1) and C (R3) of the Open Channel Reagent Cassette (cobas c pack MULTI ref. 05353025 190) Roche, Mannheim, Germany) according to the manufacturer, the calibration curve is stable for 4 weeks, and the reagents are stable for at least 9 weeks when stored on board the analyzer. The Gentian Cystatin C calibrator (REF 1012, Gentian, Moss, Norway) is ready for use and standardized against the international calibrator standard ERM‐DA471/IFCC.9 A dilution series for calibration curve establishment is prepared automatically by the cobas c702. The method is linear from 0.32 to 8.00 mg/L (depending on the calibrator concentration). The international calibrator standard ERM‐DA471/IFCC was analyzed to verify the Gentian cystatin C calibrator value. Hemolysis, icterus, and lipemia/turbidity indices (HIL index) were measured to assess sample quality automatically by the cobas c702.
2.3. Measurement of creatinine
Plasma creatinine was analyzed in duplicate using an enzymatic method (Crea Enzyme Plus, REF11875566 216 (R1) and REF11875582 216 (R2)) on the Roche Modular P analyzer (Roche, Mannheim, Germany). Creatinine was calibrated using the Calibrator f.a.s (C.f.a.s) (REF 10759350 190) traceable to the IDMS reference creatinine method. The National Institute of Standards & Technology (NIST) standard reference material® 967a was analyzed to verify the creatinine calibration curve on the Roche Modular P. Hemolysis, icterus, and lipemia/turbidity indices (HIL index) were measured to assess sample quality automatically by the Modular P. The creatinine method on the Modular P was chosen because the cobas c702 creatinine method (CREP2) is biased approximately 5 μmol/L in relation to reference materials and the Modular P CREA PLUS method.
2.4. Control material
For internal control materials, we used third‐party liquid chemistry controls level 1 lot 219UECM and level 2 lot 811UECM from Randox (Randox Laboratories Ltd., Crumlin, United Kingdom).
2.5. Statistical analysis
The statistical analysis was performed using Microsoft Excel 2010 (Microsoft Corporation, Redmond, WA, USA) and GraphPad Prism version 6.00 for Windows (GraphPad Software, San Diego, CA, USA). Nonparametric 95% reference intervals were calculated using MedCalc Statistical Software version 17.8.6 (MedCalc Software, bvba, Ostend, Belgium) according to the recommendations in the CLSI (Clinical and Laboratory Standards Institute) guidelines C28‐A3.15 MedCalc Statistical Software identified possible outlier observations with Tukey's method.16 For statistical tests, P‐values < .05 were considered significant.
3. RESULTS
3.1. Analytical performance
To verify the calibration curve for the Gentians cystatin C assay on the cobas c702 analyzer, the international calibrator standard ERM‐DA471/IFCC was analyzed in duplicate with a mean concentration of 5.45 mg/L (certified value ± 0.15 mg/L) with recovery of 99.5%.
To verify the calibration curve for the Roche creatinine assay on the Modular P analyzer, the NIST standard 967a was analyzed in duplicate. Level 1 was 74.0 μmol/L (certified values 74.9 ± 1.6 μmol/L) with recovery of 98.8%. Level 2 was 344 μmol/L (certified value 342.7 ± 7.2 μmol/L) with recovery of 100.4%. The between‐run imprecision for cystatin C control material from Randox during a three‐week period was 2.17% and 1.01% at 0.65 mg/L (n = 21) and 1.27 mg/L (n = 18), respectively. The between‐run imprecision for creatinine control material from Randox was 3.49% and 1.39% at 51 μmol/L (n = 22) and 390 μmol/L (n = 24), respectively. The coefficients of variation for duplicate measurements of plasma samples for the reference group (n = 304) were 1.45% for cystatin C and 1.40% for creatinine.
3.2. Nonparametric reference intervals for plasma cystatin C
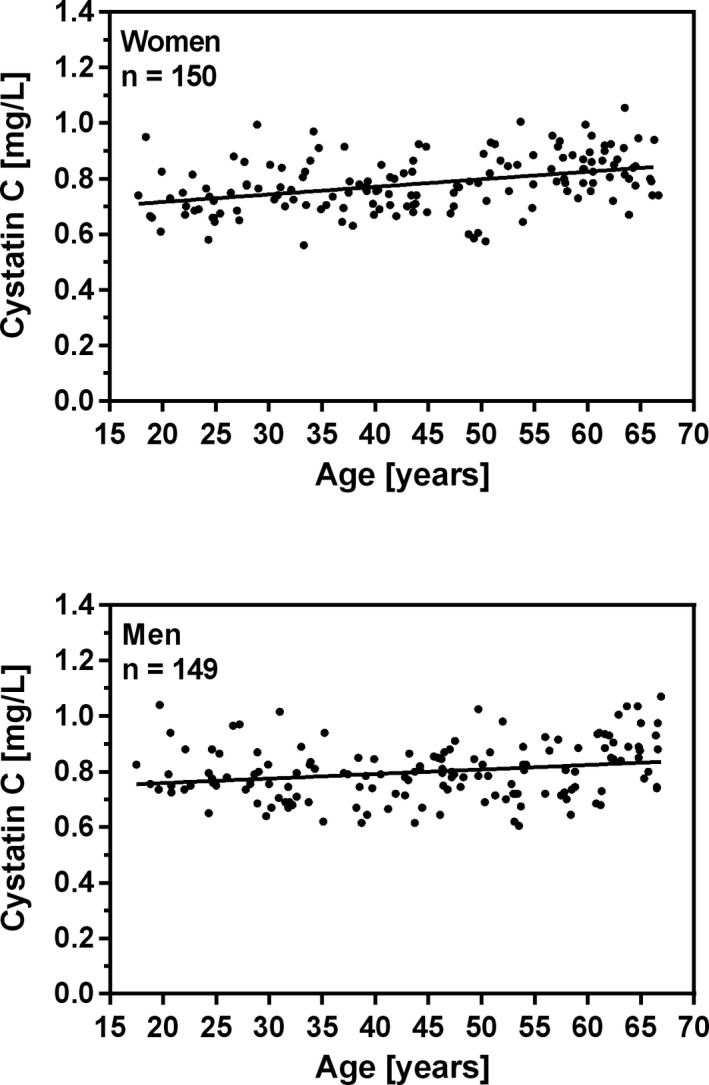
The frequency distributions of plasma cystatin C for women and men are shown in Figure 1. The relationship between age and plasma cystatin C in women and in men is shown in Figure 2. Linear regression showed that cystatin C concentration increased significantly with age for women (P < .0001) and for men (P < .0001). The Mann‐Whitney U test showed that the medians for women and men did not differ significantly (P = .21). The nonparametric reference intervals for women, men, and both genders are shown in Table 1. Two suspected outlier for women (1.09 and 1.115 mg/L) and three suspected outliers for men (1.095, 1.135 and 1.19 mg/L) was excluded from the analysis using Tukey's method.16
Figure 1.

Frequency distribution of plasma cystatin C concentration in healthy blood donors aged between 17 and 66 years
Figure 2.

Relationship between age and plasma cystatin C concentration in healthy blood donors aged between 17 and 66 years. Linear regression shows significant increase in cystatin C concentration with age. Women: Cystatin C (mg/L) = 0.002729 *Age (years) + 0.6615, r2 = 0.15 (p < 0.0001), n = 150. Men: Cystatin C (mg/L) = 0.001632 * Age (years) + 0.7262, r2 = 0.05 (p < 0.0053), n = 149
Table 1.
The nonparametric reference intervals for plasma cystatin C (mg/L)
| n | Reference Interval | 90% confidence limits | Mean | Median | Range | ||
|---|---|---|---|---|---|---|---|
| lower limit | upper limit | ||||||
| Women | 150 | 0.58‐1.00 | 0.56‐0.63 | 0.95‐1.06 | 0.78 | 0.78 | 0.56‐1.06 |
| Men | 149 | 0.62‐1.04 | 0.61‐0.65 | 0.98‐1.07 | 0.80 | 0.79 | 0.61‐1.07 |
| Both sexes | 299 | 0.61‐1.01 | 0.58‐0.63 | 0.98‐1.04 | 0.79 | 0.79 | 0.56‐1.07 |
Two suspected outliers for women (1.09 and 1.115 mg/L) and three suspected outliers for men (1,095, 1.135, and 1.19 mg/L) were excluded from the analysis.
3.3. Nonparametric reference intervals for plasma creatinine
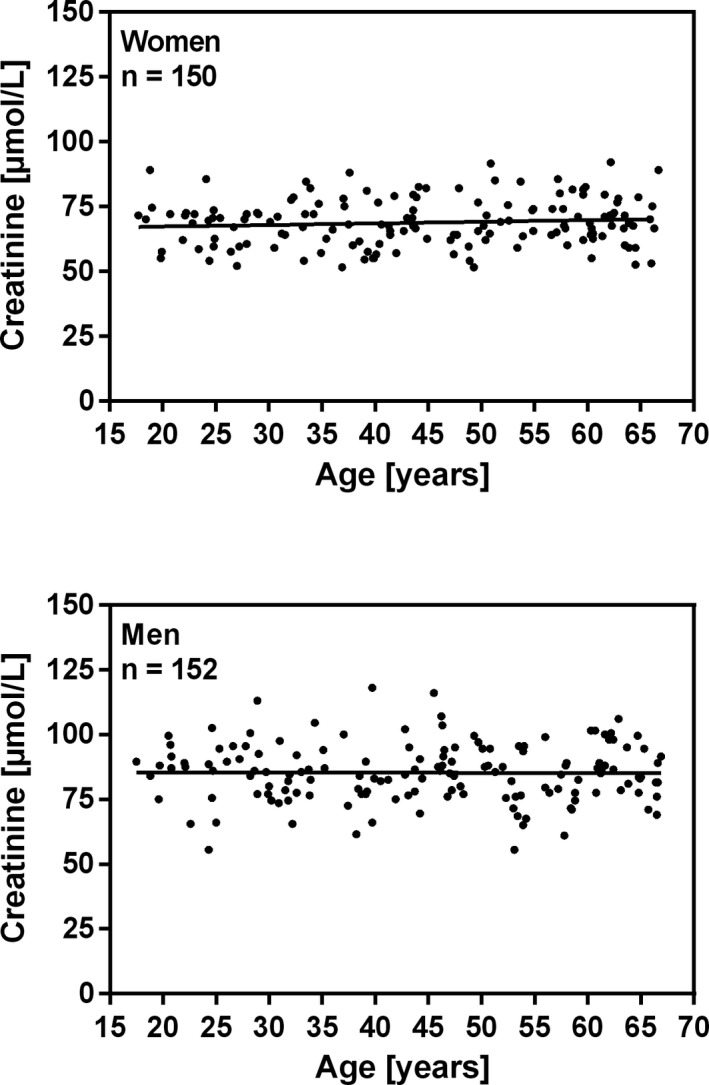
The frequency distributions of plasma creatinine for women and men are shown in Figure 3. The relationship between age and plasma creatinine in women and in men is shown in Figure 4. Linear regression showed that the creatinine concentration did not increase significantly with age for women (P < .24) and for men (P < .91). The Mann‐Whitney U test showed that the medians for women and men differ significantly (p < 0.0001). The nonparametric reference intervals for women and men are shown in Table 2. Two suspected outliers for women (99.5 and 101 μmol/L) were excluded from the analysis using Tukey'smethod.16
Figure 3.

Frequency distribution of plasma creatinine concentration in healthy blood donors aged between 17 and 66 years
Figure 4.

Relationship between age and plasma creatinine concentration in healthy blood donors aged between 17 and 66 years. Linear regression shows no significant increase in creatinine concentration with age. Women: Creatinine (μmol/L) = 0.06223 *Age (years) + 66.00, r2 = 0.009 (p = 0.24), n = 150. Men: Creatinine (μmol/L) = ‐0.007216 *Age (years) + 85.60, r2 = 0.000 (p = 0.91), n = 152
Table 2.
The nonparametric reference intervals for plasma creatinine (μmol/L)
| n | Reference | 90% confidence limits | Mean | Median | Range | ||
|---|---|---|---|---|---|---|---|
| Interval | Lower limit | Upper limit | |||||
| Women | 150 | 52‐89 | 52‐54 | 85‐92 | 69 | 69 | 52‐92 |
| Men | 152 | 61‐108 | 56‐66 | 103‐118 | 85 | 86 | 56‐118 |
Two suspected outliers for women (99.5 and 101 μmol/L) were excluded from the analysis.
4. DISCUSSION
In the present study, we established reference intervals for plasma cystatin C and plasma creatinine in a healthy population of blood donors including more than 120 reference individuals of both genders using a nonparametric method as recommended by the CLSI standard C28‐A3.15 Cystatin C was analyzed by the Gentian cystatin C method traceable to the international calibrator standard ERM‐DA471/IFCC9, and creatinine was analyzed with a method traceable to the IDMS reference method. To our knowledge, there has not previously been published a reference interval for standardized cystatin C published in a Scandinavian reference population.
To verify the Gentian cystatin C calibrator value, the international calibrator standard ERM‐DA471/IFCC was analyzed with a recovery of 99.5%. Although some manufacturers have improved their calibration protocols for cystatin C relative to ERM‐DA471/IFCC, most of them failed to meet the criteria for acceptable cystatin C measurements.17
The Mann‐Whitney U test showed no significant differences between genders for cystatin C, and a common reference interval for both genders was calculated to be 0.61‐1.01 mg/L. For both genders, the cystatin C concentrations increased significantly with age, which reflected decreasing kidney function with age.18 We have previously published reference intervals for cystatin C using the Dako particle‐enhanced turbidimetric assay, the Siemens N Latex particle‐enhanced nephelometric assay, and the Roche particle‐enhanced turbidimetric assay.19, 20, 21 The calculated reference interval in this study is close to the reference interval for cystatin C (0.51‐1.02 mg/L) we published in 2000 using the Siemens N Latex particle‐enhanced nephelometric assay with the Siemens BN II analyzer.20
Establishing an age‐related reference interval for cystatin C will ideally require 120 reference individuals in each age group for women and men, which is time‐consuming and expensive to perform. For practical reasons in the clinic, a common age‐independent reference interval for cystatin C is preferred for ages 17‐66 years.
As expected, the Mann‐Whitney U test showed significant differences in the distribution of creatinine between women and men. For both genders, the creatinine reference intervals did not increase with age. The calculated reference interval in this study, 52‐89 μmol/l for women and 61‐108 μmol/L for men, is comparable to the reference intervals recommended to the Scandinavian population of 45‐90 μmol/L for women and 60‐105 μmol/L for men.14
Three other studies using creatinine methods traceable to the IDMS reference method show comparable reference intervals to our study. Pottel et. al. 42‐82 μmol/L for women and 56‐103 μmol/L for men.22 Junge et. al. 49‐90 μmol/L for women and 64‐104 μmol/L for men.23 Mazzachi et al. 45‐84 μmol/L for women and 59‐104 μmol/L for men.24
A limitation of the study was that the reference individuals were nonfasting. Studies have shown that creatine in meat is converted to creatinine on cooking, which is absorbed, causing significant increases in plasma creatinine up to at least 4 hours, but after 12 hours, the effect disappeared.25, 26
In conclusion, we have established reference intervals for plasma cystatin C and creatinine using methods traceable to international standards.
CONFLICT OF INTEREST
The authors report no conflict of interests. The authors alone are responsible for the content and writing of the article.
ACKNOWLEDGMENTS
The authors would like to thank the staff at the Blood Bank at Viborg Regional Hospital for their assistance during this project. We also thank the blood donors who provided the blood specimens for the study.
Erlandsen EJ, Randers E. Reference intervals for plasma cystatin C and plasma creatinine in adults using methods traceable to international calibrators and reference methods. J Clin Lab Anal. 2018;32:e22433 10.1002/jcla.22433
REFERENCES
- 1. Stevens LA, Levey AS. Measurement of kidney function. Med Clin North Am. 2005;89:457‐473. [DOI] [PubMed] [Google Scholar]
- 2. Grubb A, Lofberg H. Human gamma‐trace, a basic microprotein: amino acid sequence and presence in the adenohypophysis. Proc Natl Acad Sci USA. 1982;79:3024‐3027. [DOI] [PMC free article] [PubMed] [Google Scholar]
- 3. Abrahamson M, Olafsson I, Palsdottir A, et al. Structure and expression of the human cystatin C gene. Biochem J. 1990;268:287‐294. [DOI] [PMC free article] [PubMed] [Google Scholar]
- 4. Grubb A. Diagnostic value of analysis of cystatin C and protein HC in biological fluids. Clin Nephrol 1992;38(Suppl 1):S20‐S27. [PubMed] [Google Scholar]
- 5. Jacobsson B, Lignelid H, Bergerheim US. Transthyretin and cystatin C are catabolized in proximal tubular epithelial cells and the proteins are not useful as markers for renal cell carcinomas. Histopathology. 1995;26:559‐564. [DOI] [PubMed] [Google Scholar]
- 6. Tenstad O, Roald AB, Grubb A, et al. Renal handling of radiolabelled human cystatin‐C in the rat. Scand J Clin Lab Invest. 1996;56:409‐414. [DOI] [PubMed] [Google Scholar]
- 7. Seronie‐Vivien S, Delanaye P, Pieroni L, et al. Cystatin C: current position and future prospects. Clin Chem Lab Med. 2008;46:1664‐1686. [DOI] [PubMed] [Google Scholar]
- 8. Randers E, Erlandsen EJ. Serum cystatin C as an endogenous marker of the renal function–a review. Clin Chem Lab Med. 1999;37:389‐395. [DOI] [PubMed] [Google Scholar]
- 9. Grubb A, Blirup‐Jensen S, Lindstrom V, et al. First certified reference material for cystatin C in human serum ERM‐DA471/IFCC. Clin Chem Lab Med. 2010;48:1619‐1621. [DOI] [PubMed] [Google Scholar]
- 10. Inker LA, Schmid CH, Tighiouart H, et al. Estimating glomerular filtration rate from serum creatinine and cystatin C. N Engl J Med. 2012;367:20‐29. [DOI] [PMC free article] [PubMed] [Google Scholar]
- 11. Delanaye P, Cavalier E, Pottel H. Serum creatinine: not so simple!. Nephron. 2017;136:302‐308. [DOI] [PubMed] [Google Scholar]
- 12. Perrone RD, Madias NE, Levey AS. Serum creatinine as an index of renal function: new insights into old concepts. Clin Chem. 1992;38:1933‐1953. [PubMed] [Google Scholar]
- 13. Rustad P, Felding P, Franzson L, et al. The Nordic reference interval project 2000: recommended reference intervals for 25 common biochemical properties. Scand J Clin Lab Invest. 2004;64:271‐284. [DOI] [PubMed] [Google Scholar]
- 14. Martensson A, Rustad P, Lund H, et al. Creatininium reference intervals for corrected methods. Scand J Clin Lab Invest. 2004;64:439‐441. [DOI] [PubMed] [Google Scholar]
- 15. CLSI . Defining, Establishing, and Verifying Reference Intervals in the Clinical Laboratory; Approved Guideline‐Third Edition. CLSI document EP28‐A3. Wayne, PA: Clinical and Laboratory Standards Institute; 2008. [Google Scholar]
- 16. Tukey JW (eds). Exploratory data analysis. Addison‐Wesley Publishing Company; 1977. [Google Scholar]
- 17. Bargnoux A‐S, Piéroni L, Cristol J‐P, et al. Multicenter Evaluation of Cystatin C Measurement after Assay Standardization. Clin Chem. 2017;63:833‐841. [DOI] [PubMed] [Google Scholar]
- 18. Glassock RJ, Rule AD. The implications of anatomical and functional changes of the aging kidney: with an emphasis on the glomeruli. Kidney Int. 2012;82:270‐277. [DOI] [PMC free article] [PubMed] [Google Scholar]
- 19. Erlandsen EJ, Randers E, Kristensen JH. Reference intervals for serum cystatin C and serum creatinine in adults. Clin Chem Lab Med. 1998;36:393‐397. [DOI] [PubMed] [Google Scholar]
- 20. Randers E, Erlandsen EJ, Pedersen OL, et al. Serum cystatin C asan endogenous parameter of the renal function in patients with normal to moderately impaired kidney function. Clin Nephrol. 2000;54:203‐209. [PubMed] [Google Scholar]
- 21. Erlandsen EJ, Randers E. Performance evaluation of the Roche Tina‐quant Cystatin C assay and reference interval for cystatin C in healthy blood donors. Scand J Clin Lab Invest. 2010;70:300‐304. [DOI] [PubMed] [Google Scholar]
- 22. Pottel H, Vrydags N, Mahieu B, et al. Establishing age/sex related serum creatinine reference intervals from hospital laboratory data based on different statistical methods. Clin Chim Acta. 2008;396:49‐55. [DOI] [PubMed] [Google Scholar]
- 23. Junge W, Wilke B, Halabi A, et al. Determination of reference intervals for serum creatinine, creatinine excretion and creatinine clearance with an enzymatic and a modified Jaffe method. Clin Chim Acta. 2004;344:137‐148. [DOI] [PubMed] [Google Scholar]
- 24. Mazzachi BC, Peake MJ, Ehrhardt V. Reference range and method comparison studies for enzymatic and Jaffe creatinine assays in plasma and serum and early morning urine. Clin Lab. 2000;46:53‐55. [PubMed] [Google Scholar]
- 25. Preiss DJ, Godber IM, Lamb EJ, et al. The influence of a cooked‐meat meal on estimated glomerular filtration rate. Ann Clin Biochem. 2007;44:35‐42. [DOI] [PubMed] [Google Scholar]
- 26. Nair S, O'Brien SV, Hayden K, et al. Effect of a cooked meat meal on serum creatinine and estimated glomerular filtration rate in diabetes‐related kidney disease. Diabetes Care. 2017;37:483‐487. [DOI] [PubMed] [Google Scholar]


