

Abstract
Background
Measurement of immunoglobulins and complement proteins are frontline tests used in the assessment of immune system integrity, and reference values can vary with age. Their measurement provides an insight into the function of the innate and adaptive immune systems.
Methods
We generated pediatric reference ranges for IgG, IgA, IgM, IgD, the IgG and IgA subclasses, and C3 and C4 using the Optilite™ turbidimetric analyzer.
Results
The concentrations of IgG, IgA, and IgD showed an increase with age, as expected, while IgM remained stable between the age groups. For the IgG subclasses, no significant differences were observed in IgG1 or IgG3, while IgG2 and IgG4 concentrations increased steadily with age. The concentration of IgG2 plateaued at 15‐18 years, while IgG4 plateaued at 10‐14 years. The trend of concentrations across all groups was IgG1 > IgG2 > IgG3 > IgG4. For both IgA1 and IgA2, concentrations increased significantly with age, plateauing at 15‐18 years. The median IgA1 concentration was greater than IgA2 across all groups. There was a good correlation between the total IgG or IgA concentration and summation of their subclasses (R 2 = 0.89, P < .0001, slope y = 0.98x + 14.51 mg/dL and R 2 = 0.91, P < .0001, slope y = 1.35x‐3.28 mg/dL, respectively). The concentration of C3 and C4 remained stable across the groups, with no significant differences observed.
Conclusion
We have generated age‐specific reference ranges in healthy children for C3, C4, IgG, IgA, IgM, IgD and the IgG and IgA subclasses using the Optilite™ turbidimetric analyzer. These ranges will help identify individuals with abnormal concentrations, thus will aid in the diagnosis of both primary and secondary immunological disorders.
Keywords: complement system proteins, immunodeficiency, immunoglobulins, pediatric reference values, turbidimetry
1. BACKGROUND
The human immune system varies as a consequence of both heritable and nonheritable influences that lead to an inter‐individual variation that has consequences on immunological health and disease.1 In the clinical laboratory, measurement of immunoglobulins (IgG, IgA, IgM, and IgD), IgG and IgA subclasses, and complement proteins C3 and C4 are common practice for the screening of immune system dysfunction, as well as in the follow‐up of various immunosuppressive therapies and monoclonal gammopathies. Immunoglobulins are primarily involved in adaptive immune responses and are produced by B lymphocytes.2 On the other side, the complement system, which comprises over 30 proteins synthesised mainly by hepatocytes,3, 4 is a crucial part of the human innate immune system, and plays a key role in host defense against pathogenic infections.5 Reference ranges for adult populations are well known6; however, there is little literature regarding pediatric individuals, the age range in which the onset of primary immunodeficiencies is more common.7
Radial immunodiffusion was the gold standard test used to determine immunoglobulin and complement protein concentrations 50 years ago, which is a technically demanding and manual method.8 Technical advances have allowed its replacement by fully automated systems using immunonephelometric and immunoturbidimetric techniques, two closely related analytical techniques based on optical detection systems that measure the scattering of light by a solution containing antigen‐antibody complexes due to the formation of the precipitate.9 The main difference between these two immunoassays is the detection principle. Nephelometry is based on the principle of measuring the intensity of scattered light whereas turbidimetry measures the intensity of transmitted light. Recently, improvement of immunoturbidimetry has enabled this technique to be used as an alternative to immunonephelometry for routine use.10 It is now possible to quantify low protein concentrations in serum, such as Ig subclasses and complement proteins C3 and C4.11 The SPAPLUS® and Optilite™ turbidimetric analyzers allow the measurement of these serum proteins with high sensitivity and specificity shown in Table 1. This has been achieved through the use of the certified reference material (DA470k),12 prozone effect detection tools, and optimized antisera.12, 13, 14, 15
Table 1.
Sensitivity and specificity values for IgG, IgA, IgM, IgD, IgG and IgA subclasses, C3 and C4 proteins
| IgG | IgG1 | IgG2 | IgG3 | IgG4 | IgA | IgA1 | IgA2 | IgM | IgD | C3 | C4 | |
|---|---|---|---|---|---|---|---|---|---|---|---|---|
| Sensitivity (%) | 100.00 | 93.75 | 99.43 | 78.57 | 70.00 | 100.00 | 100.00 | 86.21 | 100.00 | 100.00 | 94.74 | 100.00 |
| Specificity (%) | 100.00 | 99.02 | 94.97 | 98.92 | 98.97 | 99.13 | 99.12 | 100.00 | 100.00 | 100.00 | 97.01 | 98.92 |
Values of sensitivity and specificity are reported for each parameter studied using the Optilite™ turbidimetric analyzer.
It is well known that the production of serum proteins may be age dependent and concentration differences may therefore exist between children and adults.16, 17 The measurement of IgG can be complicated by placental transfer of maternal IgG during gestation, meaning that IgG levels may appear relatively high at birth due to the measurement of maternal IgG. Immunoglobulin concentrations may also vary according to race or ethnicity, sex, sample type, or diet, among other factors.18
The measurement of immunoglobulin concentrations is a useful marker in many clinical settings, including instances where there is abnormal production and/or questionable stability. Their measurement is included as a frontline test upon suspicion of primary and secondary immunodeficiencies19, 20, 21 and may be useful where there is an overproduction of immunoglobulins such as in multiple myeloma or hyper IgD syndrome.22, 23, 24 Congenital defects in one or more components of the humoral immune system may result in a dysfunctional immune system. These individuals may present with severe, unusual, and recurrent infections. Examples include common variable immunodeficiency (CVID),18 Bruton's agammaglobulinemia, Hyper IgM syndrome, and transient hypogammaglobulinemia of infancy.20 Primary immunodeficiencies may present in infancy, adolescence, or adulthood, so is essential that age‐specific concentration ranges are developed, so these functional defects are detected and managed. Measurement of complement protein concentration is a useful marker of innate immune function and is performed where inherited or acquired deficiencies are suspected,25 as well as in inflammatory conditions where complement levels are known to fluctuate with disease activity.26 In diseases, where there is formation of antigen‐antibody complexes like systemic lupus erythematosus, complement levels can be low due to overactivation of the complement pathways and consumption of the proteins.27 Measurement of complement protein concentration, particularly C3, C4, and complement classical pathway functional activity are carried out as part of a panel of tests used to diagnose and monitor these diseases.28, 29
In the present study, we have measured the concentrations of C3, C4, IgG, IgA, IgM, IgD and the IgG and IgA subclasses in serum samples from healthy children under 18 years of age. We report the age‐dependent pediatric reference ranges for these serum proteins using the Optilite™ turbidimetric analyzer that can be used in the clinical laboratory.
2. METHODS
2.1. Samples
Healthy controls were selected, without ethnic segregation, from June to December 2015 at Hospital Universitari Vall d'Hebron, Barcelona, Catalonia, Spain. The inclusion criteria were as follows: healthy pediatric individuals, disease‐free that have not received blood transfusion or immunosuppressive therapy during the last 12 months. Patients with immune‐mediated disorders or clinical syndromes were excluded. The median age was 8 years (range 0‐18 years). Individuals were stratified in five groups according to age as shown in Table 2.
Table 2.
Age‐specific reference ranges for IgG, IgA, IgM, IgD, IgG and IgA subclasses, C3 and C4 proteins
| Age Groups (years) (n = number of samples) | ||||||
|---|---|---|---|---|---|---|
| 0‐2((n = 22) | 3‐4(n = 19) | 5‐9(n = 39) | 10‐14(n = 40) | 15‐18 )(n = 22) | ||
| IgG (mg/dL) | Median conc. 95% CI | 849.8 (241.5‐1108) | 820.4 (485.3‐1160) | 943.8 (514‐1672) | 1045 (581.4‐1652) | 975.8 (478.9‐1433) |
| IgG1 (mg/dL) | Median conc. 95% CI | 615.5 (167‐900) | 538 (313‐941) | 653 (363‐1276) | 640 (315.6‐1076) | 543.5 (325‐894) |
| IgG2 (mg/dL) | Median conc. 95% CI | 114.8 (54.6‐358.5) | 130.3 (72.3‐286.6) | 206.3 (26.64‐397.6) | 268.6 (85.71‐509.4) | 321.5 (156.3‐625.3) |
| IgG3 (mg/dL) | Median conc. 95% CI | 50.4 (33.8‐84.5) | 59.3 (25.1‐117.2) | 56.95 (17.32‐169) | 77.25 (14.39‐201.2) | 66.4 (33.5‐245.8) |
| IgG4 (mg/dL) | Median conc. 95%CI | 8.2 (1‐33.6) | 8.3 (0.7‐64.5) | 22.65 (0.42‐167.6) | 47.05 (0.69‐102.7) | 24.35 (1.8‐170.2) |
| IgA (mg/dL) | Median conc. 95% CI | 54.19 (2.1‐126) | 73.6 (13.92‐212.4) | 109.6 (52.34‐225.8) | 124.3 (41.59‐344.9) | 127.3 (59.84‐348.8) |
| IgA1 (mg/dL) | Median conc. 95% CI | 52.32 (3.35‐145.4) | 82.63 (22.46‐277.8) | 120.4 (42.78‐337.2) | 137.6 (36.81‐430) | 153.4 (76.12‐394.4) |
| IgA2 (mg/dL) | Median conc. 95% CI | 6.57 (0.52‐14.87) | 10.42 (2.68‐43.89) | 16.7 (6.51‐55.67) | 21.13 (0.625‐109.3) | 27.68 (13.92‐54.49) |
| IgM (mg/dL) | Median conc. 95% CI | 93.25 (20.82‐214.7) | 84.72 (26.06‐154.5) | 98.92 (26.25‐187.9) | 98.6 (47.41‐251.8) | 98.07 (25.92‐232.3) |
| IgD (mg/L) | Median conc. 95% CI | 13.9 (13.9‐138.8) | 23.4 (13.9‐208.9) | 37 (13.9‐209) | 24.5 (13.9‐301.4) | 40.4 (13.9‐154.2) |
| C3 (mg/dL) | Median conc. 95% CI | 135.4 (98.56‐207.9) | 130.9 (77.33‐176.5) | 136.6 (87.5‐176.4) | 141.5 (97.36‐195.9) | 136 (68.09‐222.4) |
| C4 (mg/dL) | Median conc. 95% CI | 22.44 (11.25‐39.08) | 22.42 (10.97‐41.88) | 22.07 (7.272‐33.67) | 19.72 (11.43‐36.66) | 20.62 (10.29‐46.92) |
The median concentration of each protein in sera from healthy pediatric donors is shown in mg/dL. The 95% confidence intervals (CI) are shown in parentheses.
2.2. Consent/Ethics
The study was approved by the Ethics Committee of Hospital Universitari Vall d'Hebron, Barcelona, Spain (PR_AG_134‐2011). The study was explained to parents/legal guardian of the volunteers included, and informed consent was obtained. All the participants were registered anonymously, and they were classified according to sex and age.
2.3. Analytical techniques
Serum was obtained after centrifugation of whole blood samples (serum‐separating tubes), then frozen at −80°C for a maximum period of 10 months until analysis. IgG, IgA, IgM, IgD, IgG, and IgA subclasses concentration were measured on an Optilite™ turbidimetric analyzer (The Binding Site®, Birmingham, UK). Complement proteins C3 and C4 were also assessed using this same analyzer and following the routine protocols in our hospital.
2.4. Statistical analysis
All graphs and statistical analysis were generated using Graph Pad Prism statistical software version 5.04 and Analyze‐it® for Microsoft Excel. Distribution of data was assessed by D'Agostino & Pearson omnibus normality tests. Depending on whether data were normally distributed, differences between the age groups were assessed by one‐way analysis of variance with Tukey's multiple comparison test or Kruskal‐Wallis with Dunn's multiple comparison test. A P < .05 was considered statistically significant. The relationship between total IgG or IgA and the summation of the subclasses were analyzed using Bland‐Altman and Passing‐Bablok analysis (Analyse‐it).
3. RESULTS
Samples from 145 healthy donors (69 females and 76 males) were included. The median age was 8 years (interquartile range: 4‐13). Age‐related median concentrations and 95% reference ranges for IgG, IgA, IgM, IgD, the IgG and IgA subclasses, and complement proteins C3 and C4 are shown in Table 1.
IgG was the only immunoglobulin which was normally distributed in all groups, with IgA, IgM, and IgD antibodies displaying nonnormal distribution in one or more age groups. The concentrations of IgG, IgA, and IgD generally showed an increase with increasing age (Figure 1). The IgM concentration remained stable over the age ranges tested, with no statistically significant differences observed in the concentrations between the groups. For both IgG and IgM, the concentrations at 0‐2 years were comparable to that at 3‐4 years.
Figure 1.
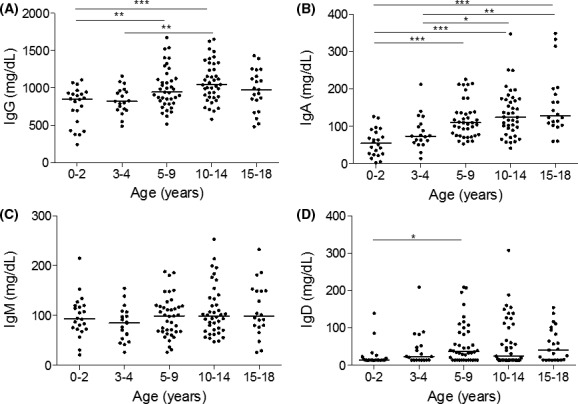
Age‐stratified immunoglobulin concentrations in healthy children. Immunoglobulin isotypes G, A, M, and D were measured in healthy children (A, B, C, and D, respectively). Individual readings were grouped according to age ranges; 0‐2, 3‐4, 5‐9, 10‐14 and 15‐18 y. Line represents median concentrations. *P < .05, **P < .01, ***P < .001
IgG and IgA can be divided further into subclass antibodies, which were also measured in the different age groups (Figures 2 and 3). IgG1 antibodies were normally distributed, while IgG2, IgG3, and IgG4 had a nonnormal distribution in one or more age groups. No significant differences were observed in IgG1 or IgG3 concentrations between the different age groups, while the concentrations of IgG2 and IgG4 increased steadily with age (Figure 2). The concentration of IgG2 plateaued in the 15‐18 year age group, while IgG4 plateaued at 10‐14 years. The trend of concentrations across all age groups was IgG1 > IgG2 > IgG3 > IgG4. The concentrations of both IgA1 and IgA2 displayed nonnormal distribution in one or more age groups, and both increased significantly with age, plateauing in the 15‐18 year age group (Figure 3). The median IgA1 concentration was greater than the IgA2 concentration across all age groups.
Figure 2.
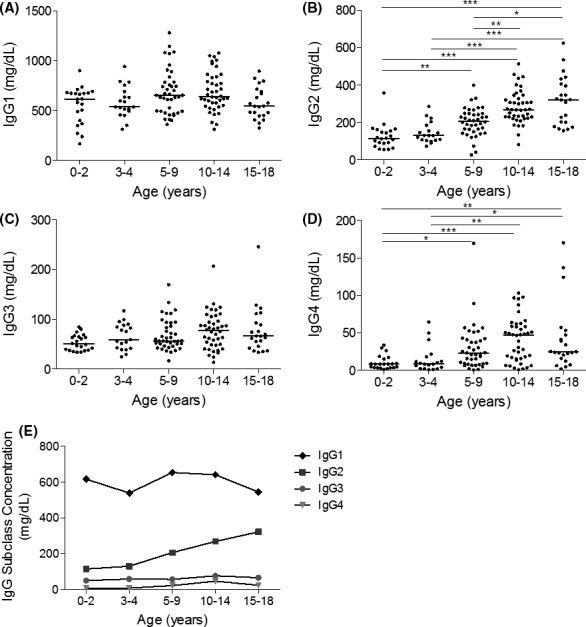
Age‐stratified IgG subclass concentrations in healthy children. (A) IgG1, (B) IgG2, (C) IgG3, and (D) IgG4 were measured in healthy children. Individual readings were grouped according to age ranges: 0‐2, 3‐4, 5‐9, 10‐14, and 15‐18 y, and line represents median concentrations. (E) The median concentrations are shown for all four IgG subclasses. *P < .05, **P < .01, ***P < .001
Figure 3.
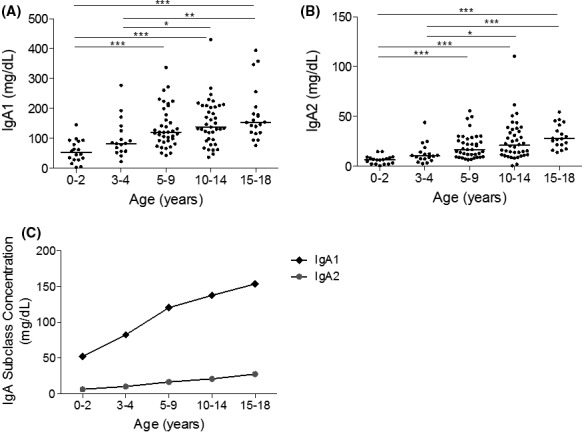
Age‐stratified IgA subclass concentrations in healthy children. (A) IgA1 and (B) IgA2 were measured in healthy children. Individual readings were grouped according to age ranges: 0‐2, 3‐4, 5‐9, 10‐14, and 15‐18 y. Line represents median concentrations. (C) The median concentrations are shown for both IgA1 and IgA2. *P < .05, **P < .01, ***P < .001
There was a good correlation between the total IgG concentration and summation of the IgG subclasses (R 2 = 0.89, P < .0001, slope y = 0.98x + 14.51 mg/dL; Figure 4). There was 94%‐100% agreement between the two methods in classifying patients as below or above the lower limit of the age‐specific normal IgG range. Comparing total IgA and the summation of IgA1 and IgA2 concentrations also provided a good correlation (R 2 = 0.91, P < .0001, slope y = 1.35x‐3.28 mg/dL; Figure 4). There was 97%‐100% agreement between the two methods in classifying patients as below or above the lower limit of the age‐specific normal IgA range.
Figure 4.
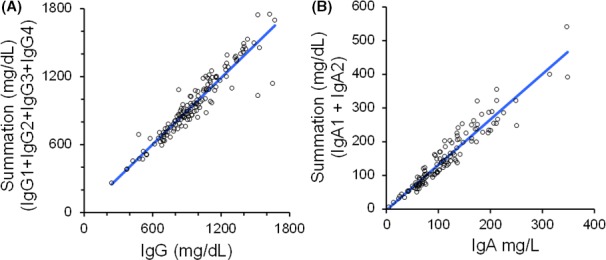
Comparison of immunoglobulin measurements and summation of their subclasses. The measurement of IgG and IgA and the summation of their subclasses were compared using Passing‐Bablok analysis (A and B, respectively)
Measurement of the C3 and C4 concentrations demonstrated that C4 protein expression had normal distribution across all age groups, while C3 did not. The concentration of both C3 and C4 protein remained stable across the age groups, with no significant differences observed in concentrations between age groups (Figure 5).
Figure 5.
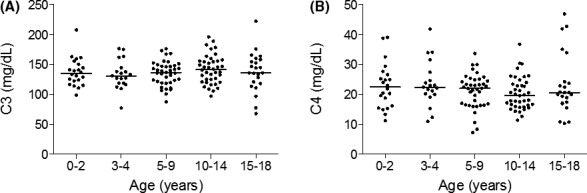
Age‐stratified C3 and C4 concentrations in healthy children. Complement proteins C3 and C4 were measured in healthy children (A and B, respectively). Individual readings were grouped according to age ranges: 0‐2, 3‐4, 5‐9, 10‐14, and 15‐18 y. Line represents median concentrations
4. CONCLUSIONS
In the present work, we provide for the first time reference values for immunoglobulins, immunoglobulin subclasses, and complement proteins in a healthy pediatric population from 0 to 18 years old using immunoturbidimetric assays.
The immune system is a complex system, comprising several types of cells and soluble proteins that have different functions. Their concentration in different tissues can vary depending on their functional activity. For practical reasons, whole blood and serum are the samples which are studied most, and obviously, reference values are necessary to distinguish between normal and pathological values. For this purpose, reference ranges for immunoglobulin and complement protein levels in adult populations are well defined,6 but there is less data that refers to pediatric populations. The importance of these pediatric reference values relies on the fact that the vast majority of PID are diagnosed during the first months or years of life. This is especially critical for immunoglobulins as antibody deficiencies are, by large, the most common group of PID.30
The results that we have obtained for immunoglobulin concentrations are consistent with previous reports in children measured by radial immunodiffusion and nephelometric techniques, where IgG and IgA levels were shown to increase gradually with age, and IgM concentrations remained relatively steady between all age groups.16, 17, 31 Although IgM antibodies appear early during infection, the almost constant concentrations of IgM observed in each age group may be in part due its high avidity pentameric structure. IgM binds to weakly cross‐reacting antigens, for example isohaemagglutinins, stimulating its increased production, even in the absence of prior immunization.32, 33 The steady increase in IgG and IgA with age reflects the repeated and increased exposure of the host to various pathogens and antigens. This will stimulate B cell production of immunoglobulin to change from one isotype to another via class‐switch recombination (CSR), allowing the switch from IgM to IgG and IgA antibody production.34
The IgG subclass ranges reported in this study show similar trends to that previously reported.35, 36, 37, 38, 39 The age‐associated increase in IgG subclass concentrations was most pronounced for IgG2 and IgG4 antibodies, as these subclasses reach normal adult levels later than IgG1 and IgG3.40 IgG2 antibody concentrations are less affected by maternal transfer of IgG (compared to IgG1), as transfer of this subclass is the least efficient of the four IgG subclasses.41, 42, 43 The transient delay in IgG2 antibody production is clinically relevant in the context of vaccination, as this subclass is mainly responsible for the response to polysaccharide antigens.44, 45 This fact explains why response to polysaccharide vaccines is impaired in children under 2 years; thus childhood vaccination schedules utilize predominantly protein (eg, tetanus and diphtheria toxoids) or protein conjugated polysaccharide (eg, Haemophilus influenzae and Streptococcus pneumoniae) vaccines to overcome this issue in this young population where the predominant response is mediated by IgG1.44, 45 As in previous studies performed with radial immunodiffusion and nephelometric techniques, total IgA, IgA1, and IgA2 all increase in concentration with age, with serum IgA1 concentrations consistently much higher than IgA2.46, 47
Serum concentrations of complement proteins C3 and C4 were constant across all age groups, which is consistent with previous results performed with alternative techniques and their role in the innate immune system.15, 48 In contrast to the immunoglobulins and their role in the adaptive arm of the immune system, C3 and C4 are part of the innate immune system with a much broader repertoire of functions. Complement proteins are not transferred across the placenta, and their synthesis occurs early in gestation by the third trimester.49
In conclusion, this work presents reference values for immunoglobulins IgA, IgG, IgM, IgD, the IgG and IgA subclasses as well as C3 and C4 in a multi‐ethnic population of healthy pediatric donors using the Binding Site's automated turbidimetric assays. Immunoturbidimetry is recommended as an alternative to immunonephelometry in the immunoglobulin and complement protein quantification due to its accuracy and the detection capacity of prozone phenomenon that make it suitable for clinical purposes.11
These ranges will be of use in the clinical laboratory for identifying individuals with abnormal concentrations of these proteins and thus will aid in the diagnosis of immunological disorders, especially of primary and secondary immunodeficiencies.
ACKNOWLEDGMENTS
We thank Adrián Steinherr, Oriol Barrachina, Mireia García, Elisenda Vall, and Júlia Porta for their contribution in selecting healthy donors, in obtaining the informed consent and the samples acquisition.
Garcia‐Prat M, Vila‐Pijoan G, Martos Gutierrez S, et al. Age‐specific pediatric reference ranges for immunoglobulins and complement proteins on the Optilite™ automated turbidimetric analyzer. J Clin Lab Anal. 2018;32:e22420 10.1002/jcla.22420
Funding information
The Binding Site has supported this manuscript.
Marina Garcia‐Prat and Gemma Vila‐Pijoan equally contributed to this work.
REFERENCES
- 1. Brodin P, Davis MM. Human immune system variation. Nat Rev Immunol. 2017;17:21‐29. [DOI] [PMC free article] [PubMed] [Google Scholar]
- 2. Schroeder HW, Cavacini L Jr. Structure and function of immunoglobulins. J Allergy Clin Immunol. 2010;2(Suppl 2):S41‐S52. [DOI] [PMC free article] [PubMed] [Google Scholar]
- 3. Perlmutter DH, Colten HR. Molecular immunobiology of complement biosynthesis: a model of single‐cell control of effector‐inhibitor balance. Annu Rev Immunol. 1986;4:231‐251. [DOI] [PubMed] [Google Scholar]
- 4. Alberts B. Molecular Biology of the Cell. 4th edn. New York, NY: Garland Science; 2002:xxxiv, 1548 [Google Scholar]
- 5. Song WC, Sarrias MR, Lambris JD. Complement and innate immunity. Immunopharmacology. 2000;49:187‐198. [DOI] [PubMed] [Google Scholar]
- 6. Puissant‐Lubrano B, Peres M, Apoil PA, Congy‐Jolivet N, Roubinet F, Blancher A. Immunoglobulin IgA, IgD, IgG, IgM and IgG subclass reference values in adults. Clin Chem Lab Med. 2015;53:e359‐e361. [DOI] [PubMed] [Google Scholar]
- 7. Ozen A, Baris S, Karakoc‐Aydiner E, Ozdemir C, Bahceciler NN, Barlan IB. Outcome of hypogammaglobulinemia in children: immunoglobulin levels as predictors. Clin Immunol. 2010;137:374‐383. [DOI] [PubMed] [Google Scholar]
- 8. Maddison SE, Reimer CB. Normative values of serum immunoglobulins by single radial immunodiffusion: a review. Clin Chem. 1976;22:594‐601. [PubMed] [Google Scholar]
- 9. Whicher JT, Price CP, Spencer K. Immunonephelometric and immunoturbidimetric assays for proteins. Crit Rev Clin Lab Sci. 1983;18:213‐260. [DOI] [PubMed] [Google Scholar]
- 10. Blirup‐Jensen S. Protein standardization III: method optimization basic principles for quantitative determination of human serum proteins on automated instruments based on turbidimetry or nephelometry. Clin Chem Lab Med. 2001;39:1098‐1109. [DOI] [PubMed] [Google Scholar]
- 11. Mali B, Armbruster D, Serediak E, Ottenbreit T. Comparison of immunoturbidimetric and immunonephelometric assays for specific proteins. Clin Biochem. 2009;42:1568‐1571. [DOI] [PubMed] [Google Scholar]
- 12. Schauer U, Stemberg F, Rieger CH, et al. IgG subclass concentrations in certified reference material 470 and reference values for children and adults determined with the binding site reagents. Clin Chem. 2003;49:1924‐1929. [DOI] [PubMed] [Google Scholar]
- 13. Lepage N, Huang SH, Nieuwenhuys E, Filler G. Pediatric reference intervals for immunoglobulin G and its subclasses with Siemens immunonephelometric assays. Clin Biochem. 2010;43:694‐696. [DOI] [PubMed] [Google Scholar]
- 14. Jolliff CR, Cost KM, Stivrins PC, et al. Reference intervals for serum IgG, IgA, IgM, C3, and C4 as determined by rate nephelometry. Clin Chem. 1982;28:126‐128. [PubMed] [Google Scholar]
- 15. Kardar GA, Oraei M, Shahsavani M, et al. Reference intervals for serum immunoglobulins IgG, IgA, IgM and complements C3 and C4 in Iranian healthy children. Iran J Public Health. 2012;41:59‐63. [PMC free article] [PubMed] [Google Scholar]
- 16. Stoop JW, Zegers BJ, Sander PC, Ballieux RE. Serum immunoglobulin levels in healthy children and adults. Clin Exp Immunol. 1969;4:101‐112. [PMC free article] [PubMed] [Google Scholar]
- 17. Aksu G, Genel F, Koturoglu G, Kurugöl Z, Kütükçüler N. Serum immunoglobulin (IgG, IgM, IgA) and IgG subclass concentrations in healthy children: a study using nephelometric technique. Turk J Pediatr. 2006;48:19‐24. [PubMed] [Google Scholar]
- 18. Bonilla FA, Barlan I, Chapel H, et al. International Consensus Document (ICON): Common Variable Immunodeficiency Disorders. J Allergy Clin Immunol Pract. 2016;4:38‐59. [DOI] [PMC free article] [PubMed] [Google Scholar]
- 19. de Vries E. Patient‐centred screening for primary immunodeficiency, a multi‐stage diagnostic protocol designed for non‐immunologists: 2011 update. Clin Exp Immunol. 2012;167:108‐119. [DOI] [PMC free article] [PubMed] [Google Scholar]
- 20. Bonilla FA, Khan DA, Ballas ZK, et al. Practice parameter for the diagnosis and management of primary immunodeficiency. J Allergy Clin Immunol. 2015;136:1186‐1205. [DOI] [PubMed] [Google Scholar]
- 21. Dhalla F, Misbah SA. Secondary antibody deficiencies. Curr Opin Allergy Clin Immunol. 2015;15:505‐513. [DOI] [PubMed] [Google Scholar]
- 22. Bird JM, Owen RG, D'Sa S, et al. Guidelines for the diagnosis and management of multiple myeloma 2011. Br J Haematol. 2011;154:32‐75. [DOI] [PubMed] [Google Scholar]
- 23. Bird J, Behrens J, Westin J, et al. UK Myeloma Forum (UKMF) and Nordic Myeloma Study Group (NMSG): guidelines for the investigation of newly detected M‐proteins and the management of monoclonal gammopathy of undetermined significance (MGUS). Br J Haematol. 2009;147:22‐42. [DOI] [PubMed] [Google Scholar]
- 24. van der Meer JW, Simon A. The challenge of autoinflammatory syndromes: with an emphasis on hyper‐IgD syndrome. Rheumatology (Oxford). 2016;55(suppl 2):ii23‐ii29. [DOI] [PubMed] [Google Scholar]
- 25. de Vries E. Patient‐centred screening for primary immunodeficiency: a multi‐stage diagnostic protocol designed for non‐immunologists. Clin Exp Immunol. 2006;145:204‐214. [DOI] [PMC free article] [PubMed] [Google Scholar]
- 26. Prohaszka Z, Nilsson B, Frazer‐Abel A, Kirschfink M. Complement analysis 2016: clinical indications, laboratory diagnostics and quality control. Immunobiology. 2016;221:1247‐1258. [DOI] [PubMed] [Google Scholar]
- 27. Thomas DE. The Lupus Encyclopedia: A Comprehensive Guide for Patients and Families Baltimore, MD: Johns Hopkins University Press; 2014, 874 pages. [Google Scholar]
- 28. Gladman DD, Ibanez D, Urowitz MB. Systemic lupus erythematosus disease activity index 2000. J Rheumatol. 2002;29:288‐291. [PubMed] [Google Scholar]
- 29. Bombardier C, Gladman DD, Urowitz MB, et al. Derivation of the SLEDAI. A disease activity index for lupus patients. The Committee on Prognosis Studies in SLE. Arthritis Rheum. 1992;35:630‐640. [DOI] [PubMed] [Google Scholar]
- 30. Mahlaoui N, Gathmann B, Kindle G, Ehl S. The European Society for Immunodeficiencies (ESID) Registry: recent advancements in the epidemiology of Primary Immunodeficiencies and how does that translate in clinical care. Rare Dis Orphan Drugs. 2014;4(4(S4)):25‐27. [Google Scholar]
- 31. Isaacs D, Altman DG, Tidmarsh CE, Valman HB, Webster AD. Serum immunoglobulin concentrations in preschool children measured by laser nephelometry: reference ranges for IgG, IgA, IgM. J Clin Pathol. 1983;36:1193‐1196. [DOI] [PMC free article] [PubMed] [Google Scholar]
- 32. Kantor AB, Herzenberg LA. Origin of murine B cell lineages. Annu Rev Immunol. 1993;11:501‐538. [DOI] [PubMed] [Google Scholar]
- 33. Vas J, Gronwall C, Silverman GJ. Fundamental roles of the innate‐like repertoire of natural antibodies in immune homeostasis. Front Immunol. 2013;4:4. [DOI] [PMC free article] [PubMed] [Google Scholar]
- 34. Durandy A, Kracker S. Immunoglobulin class‐switch recombination deficiencies. Arthritis Res Ther. 2012;14:218. [DOI] [PMC free article] [PubMed] [Google Scholar]
- 35. Schur PH, Rosen F, Norman ME. Immunoglobulin subclasses in normal children. Pediatr Res. 1979;13:181‐183. [DOI] [PubMed] [Google Scholar]
- 36. Oxelius VA. IgG subclass levels in infancy and childhood. Acta Paediatr Scand. 1979;68:23‐27. [DOI] [PubMed] [Google Scholar]
- 37. Bird D, Duffy S, Isaacs D, Webster AD. Reference ranges for IgG subclasses in preschool children. Arch Dis Child. 1985;60:204‐207. [DOI] [PMC free article] [PubMed] [Google Scholar]
- 38. Beard LJ, Ferrante A, Hagedorn JE, Kiroff G. Percentile ranges for IgG subclass concentrations in healthy Australian children. Pediatr Infect Dis J. 1990;9(8 Suppl):S9‐S15. [PubMed] [Google Scholar]
- 39. Aucouturier P, Bremard‐Oury C, Griscelli C, Berthier M, Preud'homme JL. Serum IgG subclass deficiency in ataxia‐telangiectasia. Clin Exp Immunol. 1987;68:392‐396. [PMC free article] [PubMed] [Google Scholar]
- 40. Herrod HG. Clinical significance of IgG subclasses. Curr Opin Pediatr. 1993;5:696‐699. [DOI] [PubMed] [Google Scholar]
- 41. Wang AC, Faulk WP, Fudenberg HH. Chemical differences of adult, fetal and hypogammaglobulinemic IgG immunoglobulins. Immunochemistry. 1970;7:703‐708. [DOI] [PubMed] [Google Scholar]
- 42. Hay FC, Hull MG, Torrigiani G. The transfer of human IgG subclasses from mother to foetus. Clin Exp Immunol. 1971;9:355‐358. [PMC free article] [PubMed] [Google Scholar]
- 43. Garty BZ, Ludomirsky A, Danon YL, Peter JB, Douglas SD. Placental transfer of immunoglobulin G subclasses. Clin Diagn Lab Immunol. 1994;1:667‐669. [DOI] [PMC free article] [PubMed] [Google Scholar]
- 44. Yount WJ, Dorner MM, Kunkel HG, Kabat EA. Studies on human antibodies. VI. Selective variations in subgroup composition and genetic markers. J Exp Med. 1968;127:633‐646. [DOI] [PMC free article] [PubMed] [Google Scholar]
- 45. Shackelford PG, Granoff DM. IgG subclass composition of the antibody response of healthy adults, and normal or IgG2‐deficient children to immunization with H. influenzae type b polysaccharide vaccine or Hib PS‐protein conjugate vaccines. Monogr Allergy. 1988;23:269‐281. [PubMed] [Google Scholar]
- 46. Conley ME, Arbeter A, Douglas SD. Serum levels of IgA1 and IgA2 in children and in patients with IgA deficiency. Mol Immunol. 1983;20:977‐981. [DOI] [PubMed] [Google Scholar]
- 47. Schauer U, Stemberg F, Rieger CH, et al. Establishment of age‐dependent reference values for IgA subclasses. Clin Chim Acta. 2003;328:129‐133. [DOI] [PubMed] [Google Scholar]
- 48. Mosca T, Menezes M, Dionigi PC, Stirbulov R, Forte WC. C3 and C4 complement system components as biomarkers in the intermittent atopic asthma diagnosis. J Pediatr (Rio J). 2011;87:512‐516. [DOI] [PubMed] [Google Scholar]
- 49. Pettengill MA, van Haren SD, Levy O. Soluble mediators regulating immunity in early life. Front Immunol. 2014;5:457. [DOI] [PMC free article] [PubMed] [Google Scholar]