Abstract
Introduction
Patients with acute pulmonary embolism(APE)who present with right ventricular dysfunction (RVD) have a worse prognosis. This study aimed to evaluate the value of routine biochemical parameters in predicting RVD and 30‐day mortality in patients with APE.
Methods
We retrospectively collected the clinical data for 154 enrolled patients, including the neutrophil‐to‐lymphocyte ratio (NLR), platelet‐to‐lymphocyte ratio (PLR), D‐dimer, cardiac troponin I (cTnI), and N‐terminal pro‐brain natriuretic peptide (NT‐proBNP). We analyzed the correlation between RVD and the parameters and conducted a receiver operating characteristic (ROC) curve to confirm the cut‐off values for predicting RVD and 30‐day mortality. Formulas were built with relevant parameters to predict RVD and 30‐day mortality.
Results
Age, NLR, PLR, D‐dimer, the ratio of cTnI (+), and NT‐proBNP (+) were significantly higher in RVD (+) patients. The ratio of cTnI (+) and NT‐proBNP (+) in 30‐day mortality (+) patients was significantly higher than that in 30‐day mortality (−) patients. According to the logistic regression analysis, NLR, cTnI (+), and NT‐proBNP (+) correlated with RVD. The formula for the RVD risk score is 0.072 × NLR+1.460 × NT‐proBNP (+)+2.113 × cTnI (+), and the area under the curve (AUC) = 0.890 (95% CI: 0.839‐0.941, P = .001). The formula for the 30‐day mortality risk score is 0.115 × NLR + 2.046 × NT‐proBNP (+) + 1.946 × cTnI (+) −0.016 × PLR, and the AUC = 0.903 (95% CI: 0.829‐0.976, P = .001).
Conclusions
The rapid on‐site evaluation of routine biochemical parameters, including NLR, cTnI, and NT‐proBNP levels, and the formula developed using these parameters are valuable for predicting RVD and 30‐day mortality in patients with APE.
Keywords: lymphocyte, neutrophils, platelets, pro‐brain natriuretic peptide, pulmonary embolism, right ventricular dysfunction, troponin I
1. INTRODUCTION
Acute pulmonary embolism (APE) is a potentially life‐threatening cardiovascular disease that is frequently observed in the emergency room (ER).1 The 30‐day mortality rate of patients with APE exceeds 15%, and approximately, 11% of patients with APE die suddenly.2 Due to the frequency and high mortality rate of APE, the rapid identification and accurate risk stratification of patients with APE play a key role in its treatment.3 The majority of patients with APE are normotensive with stable hemodynamics4 and are divided into an intermediate‐risk group and a low‐risk group; the remaining patients with APE belong to a high‐risk group with unstable hemodynamics that is easily differentiated by the observation of decreased blood pressure.3 Deaths related to APE due to right ventricular dysfunction (RVD) occur within the first few hours, even in patients with stable hemodynamics.5 Approximately, 27%‐56% of patients with APE also have RVD.6 With timely diagnosis and treatment, the mortality of APE decreases to 5%.7 Based on the abovementioned findings, the identification of RVD and the severity of APE are critical for reducing the mortality rate among patients with APE.
Inflammation has recently been shown to play a key role in the severity of APE, and changes in neutrophil granulocyte (NE), leukomonocyte (LY), and platelet (PLT) counts reflect the inflammatory response to APE.8, 9, 10, 11, 12 Once a thrombus traveling to the pulmonary artery triggers an APE, the release of procoagulant factors, activation of natural anticoagulant pathways, and fibrinolytic activity are triggered; additionally, the thrombus triggers the release of inflammatory cytokines.13 The abovementioned events promote inflammation in the peripheral blood, which is reflected by a change in NE, LY, and PLT counts. Attention has been paid to several new inflammatory indicators, including the neutrophil‐to‐lymphocyte ratio (NLR) and the platelet‐to‐lymphocyte ratio (PLR), in the risk‐prognosis of vascular disease.8 NLR and PLR effectively predict vascular disease and may be more useful in the ER for rapidly and accurately evaluating the severity of APE and the risk stratification of patients with APE.11, 14, 15 Simultaneously, inflammation is also involved in RVD, which is secondary to APE.16 However, a study of the correlation between RVD and the NLR or PLR, or their potential value in predicting and identifying RVD in an easy and time‐saving manner has not been performed.
We retrospectively collected data on blood cell parameters, including NE, LY, and PLT counts, and calculated the NLR and PLR. In addition, we collected other indicators, including the red cell distribution width (RDW) and D‐dimer, cardiac troponin I (cTnI), and N‐terminal pro‐brain natriuretic peptide (NT‐proBNP) levels, which may be utilized for risk stratification and predicting RVD in patients with APE when analyzed together. Using the abovementioned indicators, we screened for the indicators that exhibited efficacy in predicting RVD, evaluated the efficacy of the NLR and PLR in predicting RVD and 30‐day mortality in patients with APE and derived a formula including relevant clinical parameters for predicting RVD and 30‐day mortality.
2. MATERIALS AND METHODS
2.1. Study population
This study was designed as a retrospective study, and 240 patients with APE confirmed by a computed tomography pulmonary angiography (CTPA) examination who were aged ≥18 years were enrolled from June 2013 to July 2016. Patients with malignant tumors, hematonosis or renal, liver or heart disease, and pregnant patients were excluded to remove the effects of these conditions on the blood cell count. Additionally, patients with cor pulmonale and chronic pulmonary embolism were excluded to reduce interference with the evaluation of RVD; and patients without echocardiography (ECHO) or ECHO performed greater than 24 hours after admission to hospital were excluded. Ultimately, 154 patients with APE were enrolled in our study (Figure 1). This study was approved by the Institutional Ethical Review Board of the Shengjing Hospital of China Medical University and conformed to the Declaration of Helsinki.
Figure 1.
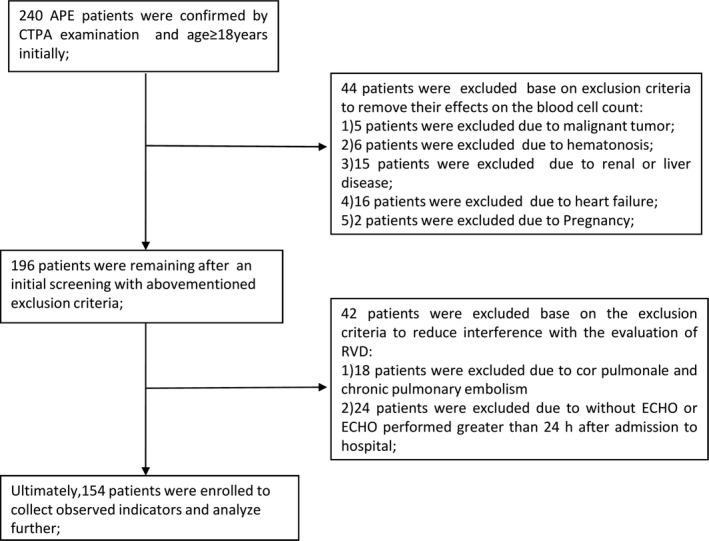
Flowchart of the patient selection process. APE = acute pulmonary embolism, CTPA = computed tomography pulmonary angiography, RVD = right ventricular dysfunction, ECHO = echocardiography
2.2. Definitions of clinical data
We defined 30‐day mortality (+) as patients who died within 30 days of hospital admission; otherwise, patients were designated 30‐day mortality (−). All the abovementioned information was collected through medical records, a follow‐up of the patient's status at 30 days after admission to the hospital, and the recorded date of death.
2.3. Laboratory parameters
Blood cell counts, including NE, LY, and PLT counts, were evaluated upon admission to the ER. The NLR and PLR were calculated as the ratio of NE to LY and PLT to LY, respectively. In addition, the RDW was determined in the same blood sample. D‐dimer, cTnI, and NT‐proBNP levels were also simultaneously analyzed. NE, LY, PLT, and the RDW were analyzed using a hematologic analyzer (Sysmex, XE‐2100, Toa medical Electronics, Kobe, Japan); NT‐proBNP and cTnI levels were analyzed using an immunoassay analyzer (Radiometer AQT90 FLEX, Denmark). cTnI (+) was defined as a cTnI level exceeding 0.055 ng/mL17; otherwise, the sample was designed as cTnI (−). NT‐proBNP (+) was defined as a NT‐proBNP level greater than 1617 ng/L18; otherwise, the sample was designated NT‐proBNP (−).
2.4. Echocardiography
ECHO was performed using an IE Elite ultrasound machine (Philips) equipped with an S 5‐1 transducer with a frequency conversion of 1‐5 MHz by an ultrasound specialist with more than 5 years of experience. RVD was defined as an enlarged right ventricle, a ratio of the observed right ventricular (RV) septal‐lateral diameter in the chamber view to the left ventricular septal‐lateral diameter >0.9, and the presence of right ventricular hypokinesis and tricuspid regurgitation.3 Patients with ECHO results satisfying these requirements were classified as RVD (+); otherwise, they were classified as RVD (−).
2.5. Statistical analysis
SPSS version 22 software (Chicago, IL, USA) was used to perform the statistical analysis. Continuous data are expressed as means ± SD. We used t tests to analyze differences in continuous data. Qualitative data are expressed as (+) or (−). We used the chi‐squared test to analyze differences in the qualitative data. To analyze the correlation between RVD and the observed indicators, we used a logistic regression analysis to select the indicators and the backward conditional method to determine the goodness of fit. We used the area under the receiver operating characteristic (ROC) curve (AUC) to confirm the optimal cut‐off value and to calculate the best sensitivity to specificity ratios. We also developed a prognostic model for RVD and hospital 30‐day mortality based on the selected indicators and estimated logistic regression coefficients. A ROC analysis was used to assess the performance of the prognostic model. We used the Kaplan‐Meier survival analysis to compare the difference in survival between patients with NLR or PLR values that were above and below the optimal cut‐off value for 30‐day mortality. A P value <.05 was considered to indicate a significant difference in all statistical analyses.
3. RESULTS
3.1. Demographic and baseline characteristics of the enrolled patients
After an initial screen, 154 patients with APE were enrolled in our study (Figure 1). All demographic and clinical parameters are summarized in Table 1. Seventy‐two patients exhibited RVD (46.8%), and eighty‐two patients did not exhibit RVD (53.2%).
Table 1.
Comparison of parameters between RVD (−) and RVD (+) patients
| RVD (+) (n = 72) | RVD(−) (n = 82) | P value | |
|---|---|---|---|
| Age (year) | 60.47 ± 12.64a | 54.15 ± 16.35 | .010 |
| Sex (male/female) | 35/37 | 46/36 | .353 |
| NE (×109/L) | 10.62 ± 4.19 | 7.56 ± 3.84 | .904 |
| LY (×109/L) | 1.53 ± 0.68 | 1.15 ± 0.58 | .084 |
| PLT (×109/L) | 203.01 ± 51.42a | 213.28 ± 66.46 | .046 |
| NLR | 12.21 ± 10.67a | 6.50 ± 6.36 | .038 |
| PLR | 239.52 ± 185.38a | 176.82 ± 140.79 | .041 |
| D‐dimer (ng/mL) | 5145.67 ± 8653.32a | 2655.41 ± 5198.50 | .012 |
| RDW (%) | 14.03 ± 1.45 | 13.50 ± 1.45 | .832 |
| cTnI (+) | 51/21b | 12/70 | .000 |
| NT‐proBNP (+) | 52/20b | 14/68 | .000 |
RVD = right ventricular dysfunction, NE = neutrophil granulocyte, LY = leukomonocyte, PLT = platelet, NLR = neutrophil‐to‐lymphocyte ratio, PLR = platelet‐to‐lymphocyte ratio, RDW = red cell distribution width, cTnI = cardiac troponin I, NT‐proBNP = N‐terminal pro‐brain natriuretic peptide.
P < .05 compared with RVD (−) patients.
P < .01 compared with RVD (−) patients.
3.2. Comparison of the observed indicators between RVD (+) and RVD (−) patients
The average age, NLR, PLR, and D‐dimer level among RVD (+) patients and the ratio of NT‐proBNP (+) and cTnI (+) in RVD (+) patients were significantly higher than those in RVD (−) patients, and the PLT counts were significantly lower in RVD (+) patients than in RVD (−) patients. However, differences among the other demographic data and observed indicators between RVD (+) patients and RVD (−) patients were not significant (Table 1).
3.3. Correlations between the observed indicators and RVD
According to the logistic regression analysis, NLR, cTnI, and NT‐proBNP levels were significantly correlated with RVD (P = .024, P < .001, and P = .002, respectively). Statistically significant differences were not observed in the other indicators (Table 2).
Table 2.
Results of the logistic regression analysis of predictors of RVD
| Beta | OR | P value | 95.0% CI | ||
|---|---|---|---|---|---|
| Lower | Upper | ||||
| NLR | 0.072 | 1.075 | .024 | 1.009 | 1.145 |
| cTnI | 2.113 | 8.272 | .001 | 3.358 | 20.378 |
| NT‐proBNP | 1.460 | 4.307 | .002 | 1.722 | 10.775 |
RVD = right ventricular dysfunction, NLR = neutrophil‐to‐lymphocyte ratio, cTnI = cardiac troponin I, NT‐proBNP = N‐terminal pro‐brain natriuretic peptide.
3.4. Comparison of the observed indicators between 30‐day mortality (+) patients and 30‐day mortality (−) patients
The NE and the ratio of NT‐proBNP (+) and cTnI (+) were significantly higher in 30‐day mortality (+) patients than in RVD (−) patients; other differences in the demographic data and observed indicators between RVD (+) patients and RVD (−) patients were not significant (Table 3).
Table 3.
Comparison of parameters between 30‐day morality (+) and 30‐day morality (−) patients
| 30‐day morality (+) (n = 13) | 30‐day morality (−) (n = 141) | P value | |
|---|---|---|---|
| Age (year) | 62.54 ± 16.90 | 56.60 ± 14.80 | .272 |
| Sex (male/female) | 6/7 | 75/66 | .627 |
| NE (×109/L) | 13.95 ± 5.97 | 8.53 ± 3.80a | .007 |
| LY (×109/L) | 1.49 ± 0.68 | 1.34 ± 0.66 | .640 |
| PLT(×109/L) | 176.00 ± 50.55 | 211.28 ± 59.99 | .539 |
| NLR | 12.07 ± 10.69 | 8.90 ± 8.91 | .781 |
| PLR | 142.77 ± 78.23 | 211.98 ± 170.41 | .246 |
| D‐dimer (ng/mL) | 4486.15 ± 4451.74 | 3758.24 ± 7318.80 | .822 |
| RDW (%) | 14.53 ± 1.61 | 13.68 ± 1.45 | .802 |
| cTnI (+) | 12/1 | 51/90b | .000 |
| NT‐proBNP (+) | 12/1 | 54/87b | .000 |
NE = neutrophil granulocyte, LY = leukomonocyte, PLT = platelet, NLR = neutrophil‐to‐lymphocyte ratio, PLR = platelet‐to‐lymphocyte ratio, RDW = red cell distribution width, cTnI = cardiac troponin I, NT‐proBNP = N‐terminal pro‐brain natriuretic peptide.
P < .05 compared with 30‐day mortality (−) patients.
P < .01 compared with 30‐day mortality (−) patients.
3.5. ROC curves for NLR, cTnI, and NT‐proBNP levels demonstrated the ability to predict RVD, and ROC curves for NLR and PLR demonstrated the ability to predict 30‐day mortality
Based on the ROC curve analyses, the AUC values for NLR, cTnI, and NT‐proBNP levels in predicting RVD were 0.803, 0.788, and 0.766, respectively (95% CI: 0.730‐0.875, 0.712‐0.863, and 0.699‐0.853; P < .001, P < .001, and P < .001, respectively). The optimal cut‐off value for the NLR was 7.03 (sensitivity of 83.3% and specificity of 75.6%) (Figure 2).
Figure 2.
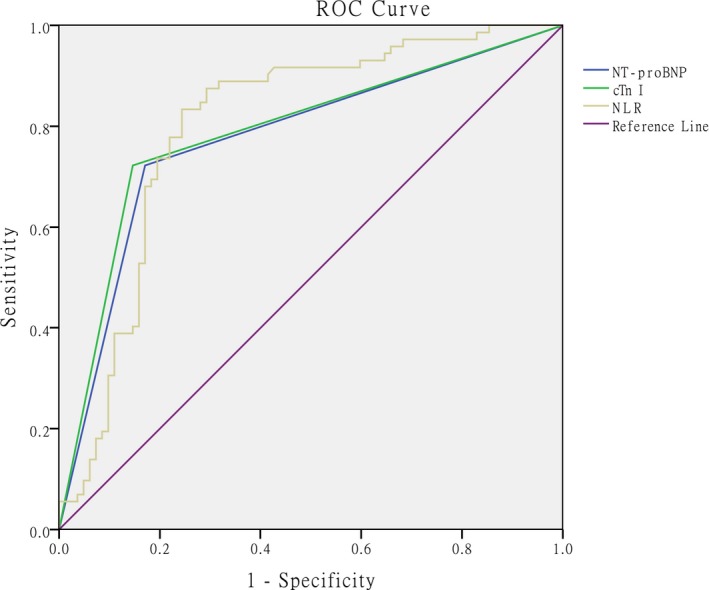
ROC curves, calculated AUC values for NLR, cTnI, and NT‐proBNP levels, and optimal cut‐off value for NLR in predicting RVD. The optimal cut‐off value is 7.03 (sensitivity 83.3%, specificity 75.6%). AUC values were calculated as 0.803, 0.788, and 0.776 (95% CI: 0.730‐0.875, 0.712‐0.863, 0.699‐0.853, respectively. All P < .001). ROC = receiver operating characteristic, AUC = area under the curve, cTnI = cardiac troponin I, NT‐proBNP = N‐terminal pro‐brain natriuretic peptide, NLR = neutrophil‐to‐lymphocyte ratio
As shown in the ROC curve analysis, AUC values for the NLR and PLR in predicting 30‐day mortality were 0.670 and 0.338, respectively (95% CI: 0.527‐0.813 and 0.171‐0.505; P = .043 and P = .054, respectively). The optimal cut‐off value for NLR was 7.57 (sensitivity of 84.6% and specificity of 54.3%) (Figure 3).
Figure 3.
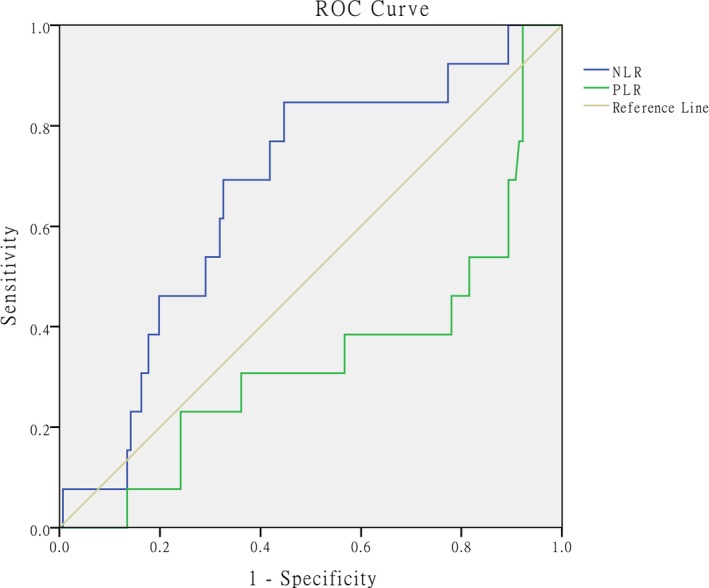
ROC curves, calculated AUC and optimal cut‐off value for NLR in predicting 30‐day morality: AUC values for NLR and PLR were calculated as 0.670 and 0.338 (95% CI: 0.527‐0.813, P = .043; 95% CI: 0.171‐0.505, P = .054, respectively). The optimal cut‐off value for NLR is 7.57 (sensitivity 84.6%, specificity 54.3%). ROC = receiver operating characteristic, AUC = area under the curve, NLR = neutrophil‐to‐lymphocyte ratio, PLR = platelet‐to‐lymphocyte ratio
3.6. Kaplan‐Meier survival curve for 30‐day mortality in patients with an NLR above and below the optimal cut‐off value
The Kaplan‐Meier survival curve revealed that the 30‐day mortality rate of patients with APE who presented an NLR ≥7.57 was significantly higher than that of patients with an NLR <7.57 (log‐rank test = 6.735; P = .007) (Figure 4).
Figure 4.
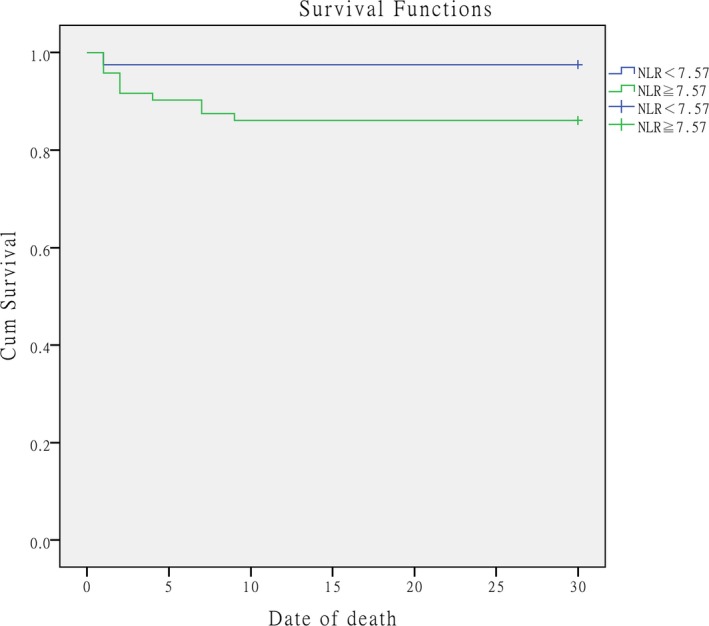
Kaplan‐Meier survival curve showing the survival status of the groups above (green line) or below (blue line) the optimal cut‐off value for NLR (7.57). The log‐rank test = 6.735 (P = .007). NLR = neutrophil‐to‐lymphocyte ratio
3.7. RVD or 30‐day survival prediction model after hospital admission
The prognostic models for RVD developed using the selected indicators and estimated logistic regression coefficients for the three indicators (NLR, NT‐proBNP [+], and cTnI [+]) were constructed and weighted according to the logistic regression coefficients. The formula for the RVD risk score is 0.072 × NLR+1.460 × NT‐proBNP+2.113 × cTnI, which had an AUC of 0.890 (95% CI: 0.839‐ 0.941, P = .001) for predicting RVD and was superior to the univariate model in predicting RVD. The prognostic models for 30‐day mortality developed using the selected indicators and estimated logistic regression coefficients for the indicators (NLR, PLR, NT‐proBNP [+], and cTnI [+]) were constructed and weighted according to the logistic regression coefficients. The formula for the 30‐day mortality risk score was calculated as 0.115 × NLR+2.046 × NT‐proBNP+1.946 × cTnI‐0.016 × PLR, which had an AUC of 0.903 (95% CI: 0.829‐0.976, P = .001) for predicting 30‐day mortality, and was superior to the univariate model in predicting the 30‐day mortality (Figures 5 and 6).
Figure 5.
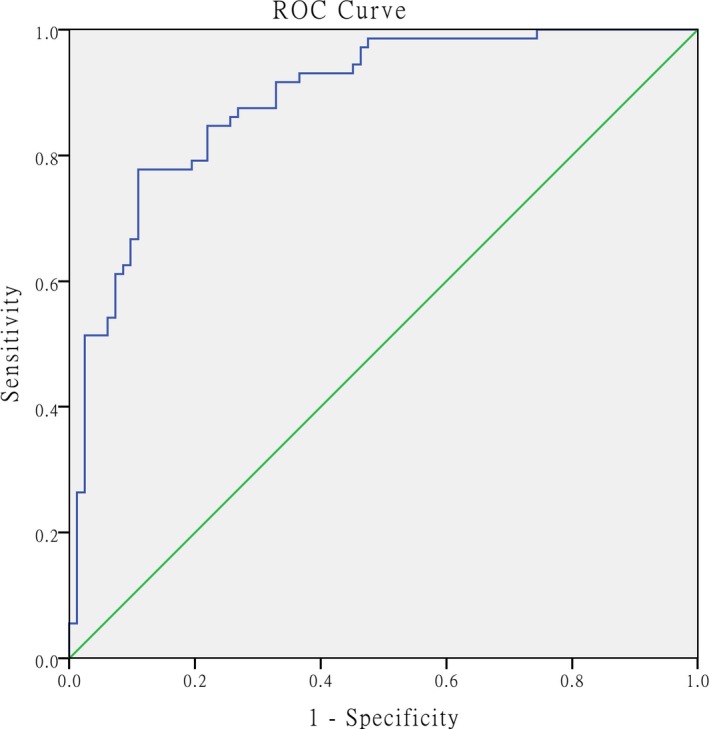
ROC curve for the formula used to calculate the RVD risk score and calculated AUC value for predicting RVD. The AUC was calculated as 0.890 (95% CI: 0.839‐ 0.941, P < .001). ROC = receiver operating characteristic, AUC = area under the curve, RVD = right ventricular dysfunction
Figure 6.
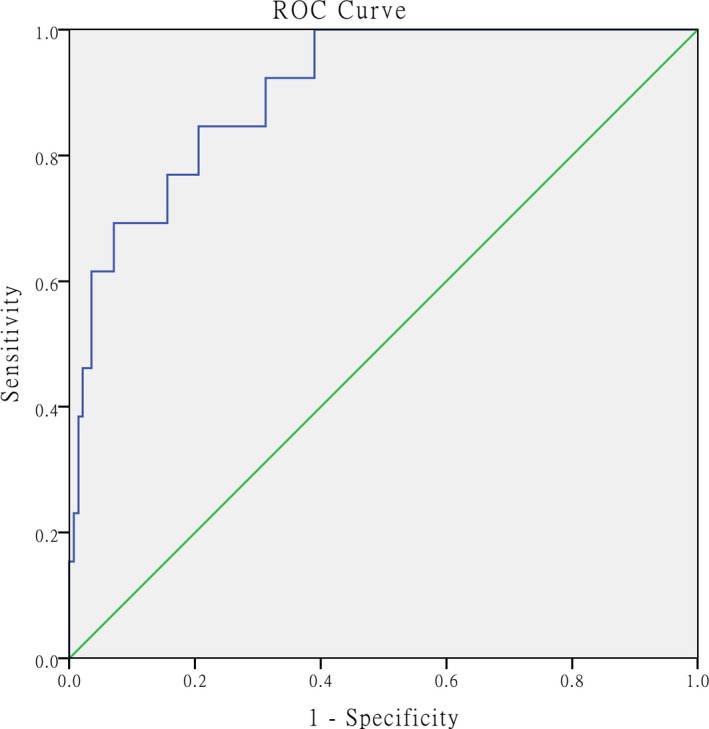
ROC curve for the formula used to calculate the 30‐day morality risk score and calculated AUC for predicting 30‐day mortality. The AUC was calculated as 0.903 (95% CI: 0.829‐0.976, P < .001). ROC = receiver operating characteristic, AUC = area under the curve
4. DISCUSSION
RVD correlated with APE‐related mortality6 and patients with both APE and RVD had a worse prognosis than patients without RVD.19 Based on the poor prognosis of patients with APE complicated with RVD, the rapid and accurate determination of RVD is crucial and essential. Inflammation plays an important role in RVD; based on results from an animal study, a neutrophil response appears early in RVD and neutrophil infiltration in the right ventricle may cause RVD.16 The NLR is regarded as a marker of systemic inflammation11, 15 and has been found to be associated with cardiovascular diseases in previous studies.20 An increase in the NLR is caused by increased NE and decreased LY counts, and an increase in NE counts is caused by increased activity in the neurohormonal and adrenergic systems and the release of inflammatory cytokines as a result of the thrombotic burden in and the blockage of the pulmonary arteries.13, 15 A decrease in LY counts is caused by elevated serum cortisol levels due to stress and increased lymphocyte apoptosis in response to inflammation induced by APE.13, 21 Based on the abovementioned studies, we used a logistic regression analysis to differentiate RVD and found that the NLR, cTnI (+), and NT‐proBNP (+) were significantly correlated with RVD. The NLR represents an inexpensive, rapid, and accurate biochemical prognostic factor and indicator for RVD, particularly in primary hospitals that do not evaluate cTnI and NT‐proBNP or BNP levels. cTnI and NT‐proBNP are two definitive indicators for predicting RVD in patients with APE; they were included in our regression model, were correlated with RVD, and were recommended for risk stratification.3, 22, 23
The PLR, another novel indicator used to evaluate the prognosis of patients with vascular disease, was included in our logistic regression model; it is associated with many inflammatory and thromboembolic diseases, including cardiovascular diseases such as acute coronary syndromes,24 myocardial infarction, and heart failure.25 According to Meyer, G et al, platelets play a major role in the pathogenesis of venous thromboembolism and atherosclerosis,26 which is similar to APE in terms of physiopathology. An increase in the PLR is caused by increased PLT and decreased LY counts, and an increase in PLT counts is reflective of the inflammatory condition and bleeding, which would stimulate megakaryocyte proliferation and induce thrombocytosis.27 A decrease in LY counts is caused by reasons similar to those described for NLR. Although the PLR has a similar predictive ability for vascular disease in our regression model, it was not correlated with RVD.
Most of the previous studies on the NLR, the PLR, and APE have focused on predicting mortality. We also studied the correlations among the NLR, PLY, and 30‐day mortality. The NLR predicted 30‐day mortality in patients with APE. However, we did not observe a statistically significant correlation between the PLR and 30‐day mortality among patients with APE. Several previous studies have revealed correlations between APE‐related mortality and the NLR and PLR. The results of our study were similar to previous studies in the prediction of mortality,11, 15 but none of the studies mentioned above have evaluated the correlation between the NLR and RVD. D‐dimer levels reflect the activation of coagulation and fibrinolysis, and D‐dimer is released in response to thrombus formation. Although D‐dimer levels were higher in the RVD (+) group than in the RVD (−) group, the difference was not statistically significant according to the logistic regression model used in our study. The specificity of D‐dimer was poor for patients with APE, and its levels may be affected by cancer, inflammation, pregnancy, infection, etc.3 The use of D‐dimer levels to evaluate the severity of pulmonary embolism is controversial. As shown in the study by Keller, K et al, D‐dimer levels were useful for the risk stratification of hemodynamically stable patients with APE.28 However, a greater number of studies, including our study, have indicated that D‐dimer levels poorly predict the severity of pulmonary embolism.29, 30 In addition, we developed formulas including cTnI (+), NT‐proBNP (+), NLR and/or PLR for the prediction of RVD and 30‐day mortality and found that they exhibited superior predictive ability compared with the use of single‐parameter evaluations based on the ROC curve analysis.
Nevertheless, our study has several limitations. The strength of our findings is limited due to the retrospective research design. Moreover, the small sample size limits the results of our study, and finally, the cross‐sectional study design and lack of long‐term follow‐up may also limit our results.
5. CONCLUSIONS
Once an APE is confirmed, the rapid on‐site evaluation of the NLR is a valuable adjunct to the classical indicators, such as cTnI and NT‐proBNP levels, in predicting RVD and 30‐day mortality after admission to the ER. Using the predictive formulas developed in our study, we may predict RVD and the 30‐day mortality rate of patients with APE more accurately and with greater applicability and superiority than the evaluation of NLR, cTnI, or NT‐proBNP alone in clinical practice.
ACKNOWLEDGMENT
This research was supported by grant 2014225006 from the Department of Science and Technology of Liaoning Province, China.
Jia D, Liu F, Zhang Q, Zeng G‐Q, Li X‐L, Hou G. Rapid on‐site evaluation of routine biochemical parameters to predict right ventricular dysfunction in and the prognosis of patients with acute pulmonary embolism upon admission to the emergency room. J Clin Lab Anal. 2018;32:e22362 10.1002/jcla.22362
REFERENCES
- 1. Keller K, Beule J, Coldewey M, Geyer M, Balzer JO, Dippold W. The risk factor age in normotensive patients with pulmonary embolism: effectiveness of age in predicting submassive pulmonary embolism, cardiac injury, right ventricular dysfunction and elevated systolic pulmonary artery pressure in normotensive pulmonary embolism patients. Exp Gerontol. 2015;69:116‐121. [DOI] [PubMed] [Google Scholar]
- 2. Ince OAN, Findik S, Sariaydin M. Risk stratification in submassive pulmonary embolism via alveolar‐arterial oxygen gradient. Hippokratia. 2014;18:333‐339. [PMC free article] [PubMed] [Google Scholar]
- 3. Konstantinides SV, Torbicki A, Agnelli G, et al. 2014. ESC guidelines on the diagnosis and management of acute pulmonary embolism. Eur Heart J. 2014;35:3033‐3069, 69a‐69k. [DOI] [PubMed] [Google Scholar]
- 4. Jimenez D, Lobo JL, Barrios D, Prandoni P, Yusen RD. Risk stratification of patients with acute symptomatic pulmonary embolism. Intern Emerg Med. 2016;11:11‐18. [DOI] [PubMed] [Google Scholar]
- 5. Xu Q, Huang K, Zhai Z, Yang Y, Wang J, Wang C. Initial thrombolysis treatment compared with anticoagulation for acute intermediate‐risk pulmonary embolism: a meta‐analysis. J Thorac Dis. 2015;7:810‐821. [DOI] [PMC free article] [PubMed] [Google Scholar]
- 6. Sekhri V, Mehta N, Rawat N, Lehrman SG, Aronow WS. Management of massive and nonmassive pulmonary embolism. Arch Med Sci. 2012;8:957‐969. [DOI] [PMC free article] [PubMed] [Google Scholar]
- 7. Cok G, Tasbakan MS, Ceylan N, Bayraktaroglu S, Duman S. Can we use CT pulmonary angiography as an alternative to echocardiography in determining right ventricular dysfunction and its severity in patients with acute pulmonary thromboembolism? Jpn J Radiol. 2013;31:172‐178. [DOI] [PubMed] [Google Scholar]
- 8. Kundi H, Balun A, Cicekcioglu H, et al. The relation between platelet‐to‐lymphocyte ratio and Pulmonary Embolism Severity Index in acute pulmonary embolism. Heart Lung. 2015;44:340‐343. [DOI] [PubMed] [Google Scholar]
- 9. Kurtipek E, Büyükterzi Z, Büyükterzi M, Alpaydın MS, Erdem SS. Endothelial dysfunction in patients with pulmonary thromboembolism: neutrophil to lymphocyte ratio and platelet to lymphocyte ratio. Clin Respir J. 2017;11:78‐82. [DOI] [PubMed] [Google Scholar]
- 10. Chung T, Connor D, Joseph J, et al. Platelet activation in acute pulmonary embolism. J Thromb Haemost. 2007;5:918‐924. [DOI] [PubMed] [Google Scholar]
- 11. Kayrak M, Erdogan HI, Solak Y, et al. Prognostic value of neutrophil to lymphocyte ratio in patients with acute pulmonary embolism: a restrospective study. Heart Lung Circ. 2014;23:56‐62. [DOI] [PubMed] [Google Scholar]
- 12. Huang J, Chen Y, Cai Z, Chen P. Diagnostic value of platelet indexes for pulmonary embolism. Am J Emerg Med. 2015;33:760‐763. [DOI] [PubMed] [Google Scholar]
- 13. Ma Y, Mao Y, He X, Sun Y, Huang S, Qiu J. The values of neutrophil to lymphocyte ratio and platelet to lymphocyte ratio in predicting 30 day mortality in patients with acute pulmonary embolism. BMC Cardiovasc Disord. 2016;16:123. [DOI] [PMC free article] [PubMed] [Google Scholar]
- 14. Akgullu C, Omurlu IK, Eryilmaz U, et al. Predictors of early death in patients with acute pulmonary embolism. Am J Emerg Med. 2015;33:214‐221. [DOI] [PubMed] [Google Scholar]
- 15. Soylu K, Gedikli O, Eksi A, et al. Neutrophil‐to‐lymphocyte ratio for the assessment of hospital mortality in patients with acute pulmonary embolism. Arch Med Sci. 2016;12:95‐100. [DOI] [PMC free article] [PubMed] [Google Scholar]
- 16. Watts JA, Gellar MA, Obraztsova M, Kline JA, Zagorski J. Role of inflammation in right ventricular damage and repair following experimental pulmonary embolism in rats. Int J Exp Pathol. 2008;89:389‐399. [DOI] [PMC free article] [PubMed] [Google Scholar]
- 17. Choi HS, Kim KH, Yoon HJ, et al. Usefulness of cardiac biomarkers in the prediction of right ventricular dysfunction before echocardiography in acute pulmonary embolism. J Cardiol. 2012;60:508‐513. [DOI] [PubMed] [Google Scholar]
- 18. Henzler T, Roeger S, Meyer M, et al. Pulmonary embolism: CT signs and cardiac biomarkers for predicting right ventricular dysfunction. Eur Respir J. 2012;39:919‐926. [DOI] [PubMed] [Google Scholar]
- 19. Jia D, Zhou XM, Hou G. Estimation of right ventricular dysfunction by computed tomography pulmonary angiography_ a valuable adjunct for evaluating the severity of acute pulmonary embolism. J Thromb Thrombolysis 2017;43:271‐278. [DOI] [PubMed] [Google Scholar]
- 20. Bhat TM, Afari ME, Garcia LA. Neutrophil lymphocyte ratio in peripheral vascular disease: a review. Expert Rev Cardiovasc Ther. 2016;14:871‐875. [DOI] [PubMed] [Google Scholar]
- 21. Acanfora D, Gheorghiade M, Trojano L, et al. Relative lymphocyte count: a prognostic indicator of mortality in elderly patients with congestive heart failure. Am Heart J. 2001;142:167‐173. [DOI] [PubMed] [Google Scholar]
- 22. Scridon T, Scridon C, Skali H, Alvarez A, Goldhaber SZ, Solomon SD. Prognostic significance of troponin elevation and right ventricular enlargement in acute pulmonary embolism. Am J Cardiol. 2005;96:303‐305. [DOI] [PubMed] [Google Scholar]
- 23. Cavallazzi R, Nair A, Vasu T, Marik PE. Natriuretic peptides in acute pulmonary embolism: a systematic review. Intensive Care Med. 2008;34:2147‐2156. [DOI] [PubMed] [Google Scholar]
- 24. Kurtul A, Murat SN, Yarlioglues M, et al. Association of platelet‐to‐lymphocyte ratio with severity and complexity of coronary artery disease in patients with acute coronary syndromes. Am J Cardiol. 2014;114:972‐978. [DOI] [PubMed] [Google Scholar]
- 25. Durmus E, Kivrak T, Gerin F, Sunbul M, Sari I, Erdogan O. Neutrophil‐to‐Lymphocyte Ratio and Platelet‐to‐Lymphocyte Ratio are Predictors of Heart Failure. Arq Bras Cardiol. 2015;105:606‐613. [DOI] [PMC free article] [PubMed] [Google Scholar]
- 26. Meyer G, Planquette B, Sanchez O. Fibrinolysis for Acute Care of Pulmonary Embolism in the Intermediate Risk Patient. Curr Atheroscler Rep. 2015;17:68. [DOI] [PubMed] [Google Scholar]
- 27. Kaplan S, Kaplan ST, Kiris A, Gedikli O. Impact of initial platelet count on baseline angiographic finding and end‐points in ST‐elevation myocardial infarction referred for primary percutaneous coronary intervention. Int J Clin Exp Med. 2014;7:1064‐1070. [PMC free article] [PubMed] [Google Scholar]
- 28. Keller K, Beule J, Schulz A, Coldewey M, Dippold W, Balzer JO. D‐dimer for risk stratification in haemodynamically stable patients with acute pulmonary embolism. Adv Med Sci. 2015;60:204‐210. [DOI] [PubMed] [Google Scholar]
- 29. Agterof MJ, van Bladel ER, Schutgens RE, et al. Risk stratification of patients with pulmonary embolism based on pulse rate and D‐dimer concentration. Thromb Haemost. 2009;102:683‐687. [DOI] [PubMed] [Google Scholar]
- 30. Lobo JL, Zorrilla V, Aizpuru F, et al. D‐dimer levels and 15‐day outcome in acute pulmonary embolism. Findings from the RIETE Registry. J Thromb Haemost 2009;7:1795‐1801. [DOI] [PubMed] [Google Scholar]


