

Abstract
Background
In order to establish a diagnosis of monoclonal gammopathy, it is necessary to detect and identify monoclonal components. To confirm the immunological nature of the proteins, the next step is to define their composition in heavy and light chains using immunofixation. The purpose of this study was to compare two different instruments, one semiautomated and the other fully automated for serum and urine immunofixation.
Methods
We selected 150 sera and 100 urines from patients admitted for routine analysis, which were analyzed by immunofixation to characterize monoclonal components.
Results and conclusion
Comparison study showed a difference in the identification of small monoclonal components and hypogammaglobulinemia, in serum and urine, between the two analyzers. We also observed a difference in the length of the electrophoretic pattern that is of considerable importance as it leads to a better resolution of the gamma region, allowing to identify even the smallest monoclonal component that can be easily hide in an oligoclonal pattern. For this reason, there is need to ameliorate commercial immunofixation assays. It is essential to improve data harmonization and standardize measurement procedures in order to guarantee a correct diagnosis for the right patient care.
Keywords: immunofixation electrophoresis, monoclonal component, system comparison
Introduction
Monoclonal gammopathies (MGs) are chronic lymphoproliferative disorders characterized by the presence of a monoclonal component (MC) which is produced by a dysregulated B‐cell clone that continues proliferating and secreting either intact or parts of immunoglobulins (Igs). The disease spectrum of MGs range from malignant multiple myeloma (MM), with over production of MCs, to a cryptic presentation, such as in nonsecretory MM or some cases of primary amyloidosis (AL) in which there is no detectable monoclonal Ig in serum or urine 1, 2.
In particular, MM is the second most common cancer of the blood and accounts for 1% of all malignancies with an annual incidence of 5.6 cases per 100,000 people in the Western world 3, 4.
The International Myeloma Working Group recommends that immunofixation (IFE) is the “gold standard” and should be performed to confirm the presence of monoclonal proteins. It is essential to differentiate monoclonal gammopathies from polyclonal or oligoclonal gammopathies because the former are neoplastic or potentially neoplastic 5.
This disease evolves from premalignant plasma cell disorders, such as monoclonal gammopathy of undetermined significance (MGUS > 50% of MM) or smoldering multiple myeloma (SMM), in at least one‐third of patients 6. The progression rate of MGUS to MM is from 0.5% to 1% per year, and the risk stratification is based on type and concentration of the MC, quantification of serum free light chain (sFLC) and its ratio, bone marrow plasmacytosis, and proportion of phenotypically clonal plasma cells 7, 8, 9. The term MGUS was first coined 35 years ago to define a clinical condition in which the detectable presence of a MC is not associated to the presence of MM or any other correlated pathologies 10. Thirty‐five percent of MC is diagnosed as MM or other correlated diseases (asymptomatic myeloma, solitary plasmocytoma, or lymphoma) and 10% of them are diagnosed as AL 11. A small percentage (<5%) is associated to rare diseases, such as cryoglobulinemia, light‐chain deposition disease, and POEMS syndrome (polyneuropathy, organomegaly, endocrinopathy, m‐protein, and skin abnormalities), in which the MC may be present as small entity 11, 12, 13. The consequences of MCs at systemic level vary greatly and range from effects due to the evolving neoplastic plasma cell clone (anemia, kidney failure, bone lesions) to effects caused by the accumulation of toxic, circulating proteins (seen in AL, peripheric neuropathies, light‐chain deposition disease) as well as no observable effects which are yet constitutive of an underlying and undefined risk 14.
According to the International Myeloma Working Group recommendations for global myeloma care, it is important to establish a diagnosis of these pathologies by detecting and identifying MCs.
For the detection and characterization of monoclonal immunoglobulin, both serum and urine need to be analyzed. The first step is the detection of MCs with its concentration being estimated by serum electrophoresis (S‐EP). S‐EP is a process whereby proteins are separated in an electric field according to their size and electrical charge. S‐EP is a well‐established technique routinely used in clinical laboratories for screening of protein abnormalities in serum and other biological fluids.
Currently, protein electrophoresis can be considered as an efficient tumor marker identification tool with low cost and high performance.
A single protein band that migrates in a specific region indicates molecular homogeneity of the separated molecule. The next step is to confirm the immunological typing of the protein(s) in order to define its composition in heavy and light chains. This is done using serum and urine IFE.
A monoclonal paraprotein will be easily detected using S‐EP, in more than 80% of patients, but in 16–18% of cases, only free light chains can be detected in either serum and urine or only in urine, and in a few patients, monoclonal proteins cannot be detected in either serum or urine.
Quantification of some serum paraproteins may be hidden by protein electrophoresis when myeloma proteins comigrate with other proteins, such as transferrin, lipoprotein, and C3, toward the anodal region. In this case, nephelometry may be the preferred method, particularly for patients with IgA monoclonal proteins 15.
The aim of this study is to compare a semiautomated electrophoresis system with a fully automated electrophoresis system for serum and urine IFE.
Materials and Methods
Sample Selection and Processing
In our study, 150 serum samples (82 male and 68 female) and 100 urine (54 male and 46 female) samples were selected from patients admitted to the Policlinico A. Gemelli Foundation in 2015 for routine research of MC. The nature of the study was explained to the patients enrolled, and serum and urine samples were collected once patients provided their informed consent, in accordance with the Principles of the Declaration of Helsinki, 6th revision of Edinburgh, 2000. Only patients who had the same result three times in 6 months with the semiautomated system (SAS), Hydrasys 2 (Sebia, France), were analyzed by the fully automated system (FAS) EasyFix G26 (Interlab, Italy). Specimens were stored at 2–8°C and analyzed within 48 h. Fasting blood samples were collected in serum vacutainer tubes with clotting activator. A second morning urine samples were collected and immediately processed for concentration, according to IFCC Committee on Plasma Proteins 16. Urine samples were concentrated using commercially available disposable concentrators (Vivaspin Centrifugal Concentrator Sartorius, Germany) with a 5 kDa molecular weight cut‐off (in order to avoid small protein leakage). Each sample was concentrated 20 times using 6 ml of urine sample 17.
All samples were analyzed on the following two instruments: SAS, defined as the reference system, and FAS identified as the test system. Four serum and four urine samples were processed on each system.
The detection limits were determined by serial dilution of pathological sera and urines with known MC concentration in physiological solution (0.9% NaCl), until the detection limit was reached. The limit of sensitivity corresponds to the lower concentration identified by visual inspection. The detection limit for all methods was a function of the background immunoglobulin staining. The concentration of the background polyclonal IgG in sera ranged from 0.8 to 1.6 g/l.
Semiautomated System
The semiautomated gel electrophoresis system is a system in which sample application, antisera dispensation, and antisera excess removal, by paper filter, are manual procedures. Migration, washing, and staining are performed by the system. Prior to gel application, serum specimens are manually diluted and urines concentrated according to the manufacturer's instructions. The samples are then processed according to the specific protocol. Proteins migrate in alkaline buffer (pH 9.2). Once migration is complete, antisera with different specificity (anti‐heavy μ, α, γ chains and anti‐light chains λ and k, free or bound) is manually dispensed using a dedicated rigid or dynamic mask. After the antisera incubation, the antisera excess is removed with specific adsorbent paper. The gels are then fixed and stained with Acid Violet, destained, and dried on the system (Table 1).
Table 1.
Timing of Each Step of Two Systems
| IFE serum time (min) | IFE urine time (min) | |||
|---|---|---|---|---|
| SAS | FAS | SAS | FAS | |
| Sample dilution | ||||
| Manual | 8 | NO | ||
| Automatic | 3 | NO | ||
| Sample application | ||||
| Manual | 5 | 9 | ||
| Automatic | 1 | 5 | ||
| Migration | ||||
| Manual | ||||
| Automatic | 9 | 9 | 9 | 9 |
| Antisera dispensation and incubation | ||||
| Manual | 10 | 10 | ||
| Automatic | 5 | 5 | ||
| Blotting | ||||
| Manual | 6 | 6 | ||
| Automatic | 3 | 3 | ||
| Drying gel | ||||
| Manual | ||||
| Automatic | 3 | 3 | 3 | 3 |
| Staining/Destaining Gel | ||||
| Manual | ||||
| Automatic | 45 | 27 | 45 | 27 |
Fully Automated System
The fully automated gel electrophoresis system performs the complete analysis for IFE using either serum and/or urine specimens without any operator intervention. The first step is sample dilution. The dilutions for each sample can be according to the manufacturer protocol or can be customized by the operator at the commencement of each run. The customized dilutions are per sample per run. After dilution in the dedicated wells of the sample tray, the samples are applied to the agarose gel by independent applicators. Following application, electrophoretic migration occurs at high voltage and at controlled temperature through the Peltier system. Once migration is complete, the antisera are automatically added by the system using a dedicated rigid mask. This allows the standardization of this extremely delicate and crucial phase. A specific adsorbent paper is then applied to the gel by the system to remove excess antisera.
The final phases of the gel processing, washing with a specific washing solution, staining with Acid Violet, and destaining are performed automatically by the system (Table 1).
The complete automation and the standardization of the results are guaranteed by the use of four different barcodes: one on the sample tube, two on the agarose gel plate, and one on each antisera vial. The matching of these different barcodes ensures the full traceability of the data on the dedicated software.
Statistical Analysis
The statistical evaluation was carried out with GraphPad Prism (GraphPad Software Inc., La Jolla, CA). In order to test the discrepant results between the two systems, the nonparametric McNemar's test was used. The level of agreement was evaluated through Cohen's Kappa test. To establish the degree of agreement, the following values were used: for perfect agreement, the Kappa value was ≥0.8; good agreement ranging from 0.6 to 0.8; and moderate agreement between 0.4 and 0.6. Significance testing was performed at the 5% level (P < 0.05).
Results
In this work, we selected 150 sera and 100 urines for IFE analysis on the instruments object of comparative study. Results of the evaluation of the two systems sensitivity for free light chains and heavy chains assay shows for serum specimens an equal detection limit for IgG (0.05 g/l) and IgA (0.04 g/l) in both systems, while for IgM the detection limit was 0.06 g/l for the fully automated system and 0.08 g/l for the semiautomated system. For urine specimens, the detection limit was 0.03, 0.07, and 0.01 g/l for total λ light chains, λ FLC, and total k light chains, respectively, in both systems, while for k FLC measurement the detection limit was 0.04 g/l for the semiautomated system and 0.02 g/l for the fully automated system as shown in Table 2. Both systems meet the International Myeloma Working group criteria that recommend a sensitivity of 10 mg/l 8.
Table 2.
Results from the Evaluation of Systems Sensitivity for FLC and Heavy Chains Assay in Serum and Urine Specimens
| Detection Limit (g/l) | Serum | Urine | |||||||
|---|---|---|---|---|---|---|---|---|---|
| Antiserum IgG | Antiserum IgA | Antiserum IgM | Antiserum k tot | Antiserum λ tot | Antiserum k tot | Antiserum k free | Antiserum λ tot | Antiserum λ free | |
| Semiautomated system | 0.05 | 0.04 | 0.08 | 0.04 | 0.05 | 0.01 | 0.04 | 0.03 | 0.07 |
| Fully automated system | 0.05 | 0.04 | 0.06 | 0.04 | 0.05 | 0.01 | 0.02 | 0.03 | 0.07 |
Underlined, the differences of sensitivity between two systems.
The analysis for serum IFE detected an equal number of negative samples and MCs, respectively, 48 and 45. However, there was a difference between the two systems in the identification of small MCs (SAS n = 32 vs. FAS n = 44), oligoclonal pattern (SAS n = 15 vs. FAS n = 10), and in the detection of hypogammaglobulinemia (SAS n = 10 vs. FAS n = 3) (reference limits <0.5 g/l) (Table 3).
Table 3.
Serum and Urine Immunofixation Pattern
| Serum | |||||
|---|---|---|---|---|---|
| System | Negative samples | Oligoclonal Pattern | Hypogammaglobulinemia | Small MC | MC |
| Semi automated | 48 | 15 | 10 | 32 | 45 |
| Fully automated | 48 | 10 | 3 | 44 | 45 |
| Urine | ||||||
|---|---|---|---|---|---|---|
| System | Albumin/Albumin in traces | k FLC | λ FLC | Small k free | Small λ free | MC |
| Semi automated | 74 | 11 | 4 | 1 | 0 | 10 |
| Fully automated | 72 | 11 | 4 | 2 | 1 | 10 |
Patients with a small MC are identified by clinicians as subjects with low grade of malignancy, a concentration of IgG lower than 1 g/l and FLC ratio within normal limits 2.
For urinary IFE, there was agreement between the two systems for detection of Bence Jones protein (BJP) k and λ, 11 and 4 samples, respectively, and of MCs (n = 10). The semiautomated system showed a greater number of samples having the presence of albumin or albumin in trace amounts (SAS n = 74 vs. FAS n = 72), and a lower number of small k and λ FLC (k free SAS n = 1 vs. FAS n = 2; λ free SAS n = 0 vs. FAS n = 1) being detected in comparison to the fully automated system (Table 3).
Different results between the two systems were statistically evaluated by the McNemar's test. There was a statistically significant difference regarding the identification of small MC (P = 0.0015) and hypogammaglobulinemia (P = 0.023) in serum IFE, while no statistically significant difference was observed for the detection of oligoclonal pattern (P = 0.07) in serum IFE and for albumin (P = 0.48) in the urine.
Concordance between the reference system and test system, as assessed by Cohen kappa statistics, showed a perfect agreement with a value of 0.95 (95% CI 0.88–1) in the detection of urine albumin. Moreover, good agreement was observed for the detection of small MC and oligoclonal patterns, respectively, 0.79 (95% CI 0.68–0.90) and 0.78 (95% CI 0.60–0.97). Moderate agreement was displayed for hypogammaglobulinemia detection reporting a k value of 0.44 (95% CI 0.11–0.78).
Discussion
Among the diagnostic tests aimed for detecting and monitoring lymphoproliferative disorders, protein electrophoresis, followed by IFE identification, are of particular importance. Different studies have demonstrated the relevance of these “state‐of‐the‐art” techniques in the investigation of MC, immunocomplex, and rare diseases 18. For this reason, there is a need to improve the quality of commercial immunofixation assays to reveal the most difficult MC. There was a recent case report demonstrating how the amyloid clone, in an AL patient, was not detected by a particular commercial IFE kit in either the serum or the urine samples but was revealed by in house high‐resolution IFE 19.
The identification of the MC may be the protein analysis with the highest clinical impact. The identification of a MC allows the diagnosis of a condition belonging to the vast and clinically relevant group of MGs 20. For the investigation of individuals in whom there is a clinical suspicion of B‐cell neoplasia, such as multiple myeloma, light chain AL, Waldenström macroglobulinemia, or related B‐cell lymphoproliferative disorders, both serum and urine should be assessed for monoclonal proteins (M‐proteins/paraproteins) 21. It is extremely important to use highly sensitive, specific, and easy methods for the diagnosis of these MG's because the detection even of the smallest MC is very important. Palladini and coworkers have found that diagnostic clonality sensitivity of FLC k/λ ratio was 76%, and commercial IFE of both serum and urine was 96%, together reaching a sensitivity nearly equal to 100% 18. Using this method, the detection limit of a MC is 50–100 mg/l in serum and 30–100 mg/l in urine, depending on the intensity of the polyclonal background 19. We obtained better sensitivity with detection limit for MCs in serum that ranges from 0.04 to 0.12 g/l and 0.01 to 0.07 g/l in urine.
In our study, we compared two systems, one semiautomatic and another fully automatic, for serum and urine IFE. In the semiautomated gel electrophoresis system, most of the steps require operator intervention, only migration, washing, and staining are performed automatically. In the automated electrophoresis system, instead all IFE steps including sample dilution, antisera addition, incubation, and gel blotting are handled automatically by the system. The IFE technique is uncomplicated and rapid, especially if compared to other methods, but is not without problems. This assay is very tedious, as the electrophoresis step is time consuming but also requires an additional incubation time with antisera, so the antigen–antibody complex can form, the gel is then washed, and stained for reading 22.
For the IFE migration in the FAS, the parameters have been modified in order to obtain longer and more detailed final patterns which lead to a great analytical sensitivity. The most interesting difference observed between the two systems is the length of the electrophoretic pattern that is longer in the FAS. This difference is of considerable importance as it leads to a better resolution of the gamma region allowing identification of even the smallest MCs that can be easily missed in an oligoclonal pattern. So this is a factor that greatly enhances the performance of the method mostly in terms of sensitivity (Fig. 1).
Figure 1.
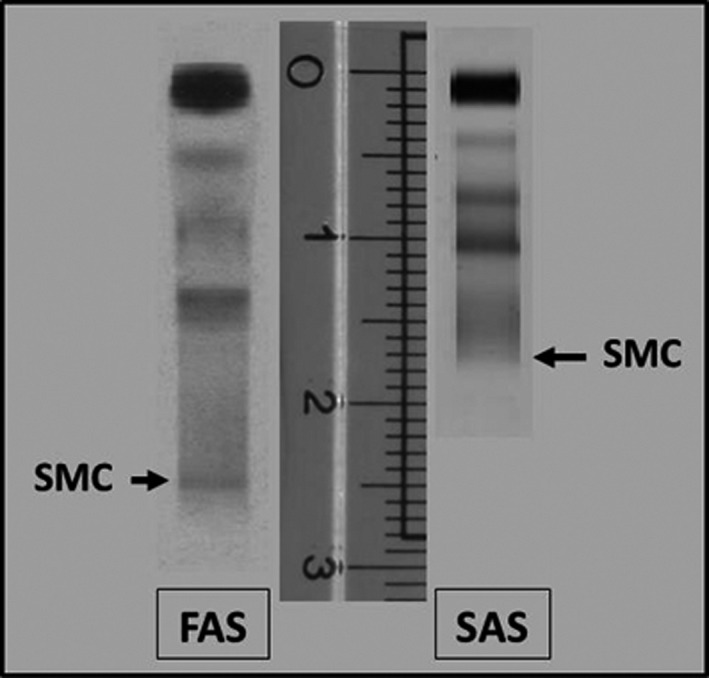
Difference between two systems in the length of electrophoretic pattern. FAS, Fully automated system; SAS, Semiautomated system.
As seen by the results, there is a statistical difference between the two systems in the identification of small MCs, oligoclonal patterns, and in the detection of hypogammaglobulinemia, both in serum and urine IFE. There was a perfect agreement between the two systems in the detection of urine albumin, good agreement was observed for the detection of small MC and oligoclonal pattern, and moderate agreement has been displayed for hypogammaglobulinemia detection.
In this evaluation, the highest failure rate for detection of small MC occurred with the use of SAS.
It is important to note that for the correct performance of this assay using the SAS system; it is desirable to have a highly qualified technical operator, particularly with regard to some of the precision steps, such as dispensing antisera and staining, to avoid various errors including prozone phenomena. It is equally important that the interpretation of the gels is performed by staff members with a high level of expertise.
In cases of high concentrations of MC, the correct identification of BJP on IFE may require dilution and repeated analysis. In FAS, dilutions are done by programming the instrument, while in SAS the samples need to be manually diluted. Repeat dilutions may be required due to interference by the polyclonal multiple banding pattern, other artifacts that may occur due to high protein concentration and, in some cases, MC migrating as more than one band 21.
Another important observation from this study is that the use of FAS for the IFE, not requiring operator intervention, minimizes the potential for technical errors and allows standardization of the IFE process.
The FAS system provides a high degree of flexibility to the operator, by allowing customization of the parameters for each phase. Continuous loading provides a high throughput so reducing the turnaround time by the analyser (Table 1). This allows the results to be given to the clinician be ready in a timely manner to aid with the patient diagnosis and treatment monitoring. The use of the FAS has resulted in more reliable test results and reduced laboratory variances so helping clinicians provide appropriate care for their patients.
Funding
This study received no external funding.
Ethical Approval
The ethics committee of the “Policlinico Universitario A. Gemelli, Roma” approved this study.
References
- 1. Wadhera RK, Rajkumar V. Prevalence of monoclonal gammopathy of undetermined significance: a systemic review. Mayo Clin Proc 2010;85:921–942. [DOI] [PMC free article] [PubMed] [Google Scholar]
- 2. Kyle RA, Therneau TM, Rajkumar SV, et al. Prevalence of monoclonal gammopathy of undetermined significance. N Engl J Med 2006;354:1362–1369. [DOI] [PubMed] [Google Scholar]
- 3. Palumbo A, Anderson K. Multiple myeloma. N Engl J Med 2011;17:1046–1060. [DOI] [PubMed] [Google Scholar]
- 4. Ludwig H, Miguel JS, Dimopoulos MA, et al. International Myeloma Working Group recommendations for global myeloma care. Leukemia 2014;28:981–992. [DOI] [PubMed] [Google Scholar]
- 5. Kyle RA, Child JA, Anderson K, et al. Criteria for the classification of monoclonal gammopathies, multiple myeloma and related disorders: a report of the International Myeloma Working Group. Br J Haematol 2003;121:749–757. [PubMed] [Google Scholar]
- 6. Weiss BM, Abadie J, Verma P, et al. A monoclonal gammopathy precedes multiple myeloma in most patients. Blood 2009;113:5418–5422. [DOI] [PMC free article] [PubMed] [Google Scholar]
- 7. Kyle RA, Therneau TM, Rajkumar SV, et al. A long‐term study of prognosis in monoclonal gammopathy of undetermined significance. N Engl J Med 2002;346:564–569. [DOI] [PubMed] [Google Scholar]
- 8. Katzmann JA, Clark R, Kyle RA, et al. Suppression of uninvolved immunoglobulins defined by heavy/light chain pair suppression is a risk factor for progression of MGUS. Leukemia 2014;27:208–212. [DOI] [PMC free article] [PubMed] [Google Scholar]
- 9. Rajkumar SV, Dimopoulos MA, Palumbo A, et al. International Myeloma Working Group updated criteria for the diagnosis of multiple myeloma. Lancet Oncol 2014;15:538–548. [DOI] [PubMed] [Google Scholar]
- 10. Kyle RA. Monoclonal gammopathy of undetermined significance. Am J Med 1978;64:814–818. [DOI] [PubMed] [Google Scholar]
- 11. Kyle RA, Rajkumar SV. Epidemiology of the plasma‐cell disorders. Best Pract Res Clin Haematol 2007;20:637–664. [DOI] [PubMed] [Google Scholar]
- 12. Merlini G, Stone MJ. Dangerous small B clones. Blood 2006;108:2520–2530. [DOI] [PubMed] [Google Scholar]
- 13. Merlini G. Small monoclonal immunoglobulins should not be neglected. Biochim Clin 2012;36:25–28. [Google Scholar]
- 14. Caldini A, Graziani MS, Basile U, et al. SIBioC Documents. Protein diagnostics in the management of monoclonal gammopathies. Biochim Clin 2014;38:47–53. [Google Scholar]
- 15. Ludwig H, Miguel JS, Dimopoulos MA. International Myeloma Working Group recommendations for global myeloma care. Leukemia 2013;28:1–12. [DOI] [PubMed] [Google Scholar]
- 16. Graziani M, Merlini G, Petrini C, IFCC Committee on Plasma Proteins, SIBioC Study Group on Proteins . Guidelines for the analysis of Bence Jones protein. Clin Chem Lab Med 2003;41:218–246. [DOI] [PubMed] [Google Scholar]
- 17. Beetham R. Detection of Bence‐Jones protein in practice. Ann Clin Biochem 2000;37:563–570. [DOI] [PubMed] [Google Scholar]
- 18. Palladini G, Russo P, Bosoni T, et al. Identification of amyloidogenic light chains requires the combination of serum‐free light chain assay with immunofixation of serum and urine. Clin Chem 2009;55:499–504. [DOI] [PubMed] [Google Scholar]
- 19. Milani P, Valentini V, Ferraro G, et al. A patient with AL amyloidosis with negative free light chain results. Clin Chem Lab Med 2015;54:1035–1037. [DOI] [PubMed] [Google Scholar]
- 20. Merlini G, Marciano S, Gasparro C, et al. The Pavia approach to clinical protein analysis. Clin Chem Lab 2001;39:1025–1028. [DOI] [PubMed] [Google Scholar]
- 21. Levinson SS Urine immunofixation electrophoresis remains important and is complementary to serum free light chain. Clin Chem Lab Med 2011;49:1801–1804. [DOI] [PubMed] [Google Scholar]
- 22. Tate J, Caldwell G, Daly J, et al. Recommendations for standardized reporting of protein electrophoresis in Australia and New Zealand. Ann Clin Biochem 2012;49:242–256. [DOI] [PubMed] [Google Scholar]