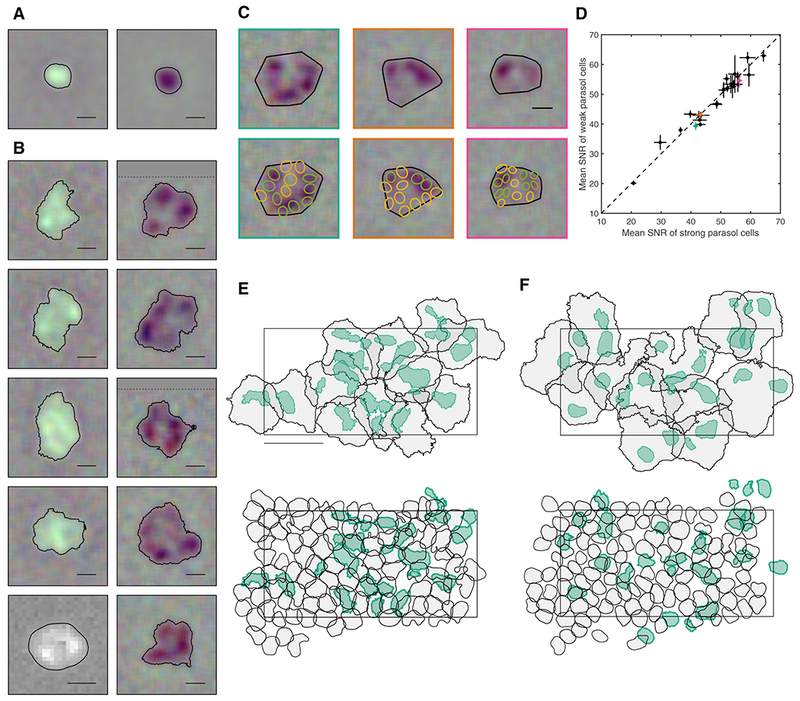
Figure 3: Receptive field structure of ON and OFF smooth monostratified cells.

A: ON (left) and OFF (right) parasol cells RFs, with typical regular, radially symmetric structure. Contour threshold: 0.15. Scale bar: 200 μm.
B: ON (left) and OFF (right) SM cell RFs, exhibiting distinctive hotspots. The bottom left ON SM cell was recorded with patch clamp; the remaining cells were recorded on a MEA. The dotted line in some RFs indicates the end of the visual stimulus (the remainder of the STA was filled in with grey). Contour threshold: 0.15. Scale bar: 200 μm.
C: RF alignment of three OFF SM cells (top) with the simultaneously recorded OFF parasol cells (bottom; green/yellow). The RFs of parasol cells indicated in green and yellow overlie hotspots and gaps in the SM cell RF, respectively. Scale bar: 200 μm.
D: The SNR of parasol cell RFs lying between SM cell hotspots (C, green) is shown as a function of the SNR of parasol cell RFs overlying hotspots (C, yellow). Mean ± SEM across parasol cells is shown for 26 SM cells from three recordings. Three examples highlighted in teal, orange, and pink correspond to the three SM cells shown in C.
E: The RFs of a population of ON SM cells (black; contour threshold: 0.1) and the hotspot(s) within each RF (teal; variable threshold to match parasol size). Below, the same hotspots are shown (teal) with the simultaneously recorded ON parasol cells (contour threshold: 0.5). Rectangle indicates the outline of the electrode array. Temporal equivalent eccentricity: 12 mm. Scale bar: 500 μm.
F: As in E, for OFF SM and OFF parasol cells.
