

Abstract
Objective.
Glutaminase 1 (Gls1) is the first enzyme in glutaminolysis. The selective Gls1 inhibitor Bis-2-(5-phenylacetamido-1,3,4-thiadiazol-2-yl)ethyl sulfide (BPTES) suppresses Th17 development and ameliorates experimental autoimmune encephalomyelitis (EAE). However, whether inhibition of glutaminolysis is beneficial for the treatment of systemic lupus erythematosus (SLE) and the involved mechanisms are still unknown.
Methods.
MRL/lpr mice were treated by BPTES or vehicle control and disease activity was examined. Then naïve CD4+ T cells from patients with SLE were cultured under Th17 conditions with BPTES or the vehicle. Furthermore, using newly generated Gls1 conditional knockout mice in IL-17 producing cells, in vitro Th17 differentiation were examined and EAE was induced in these mice. Glutaminolysis and glycolysis were measured by extracellular flux analyzer. The expression of hypoxia-inducible factor 1α (HIF1α) was also examined by Western blotting.
Results.
Treatment of MRL/lpr mice with BPTES improved autoimmune pathology in a Th17-dependent fashion. T cells from patients with SLE treated with BPTES display decreased Th17 differentiation (P < 0.05). Using the conditional knockout mice we demonstrate that both the in vitro Th17 differentiation (P < 0.05) and the development of EAE depend on Gls1. Gls1 inhibition reduced glycolysis and the expression of HIF1α protein which induces glycolysis.
Conclusion.
We have demonstrated that inhibition of glutaminolysis represents a potential new treatment strategy for patients with SLE and Th17-related autoimmune diseases. Mechanistically we have shown that inhibition of glutaminolysis affects the glycolysis pathway by reducing Hif1α protein in Th17 cells.
Systemic Lupus Erythematosus (SLE) is an autoimmune disease of unknown etiology characterized by diverse T cell effector dysfunction (1). CD4+ T cells in patients with SLE and lupus-prone mice have altered signaling and function and several metabolic abnormalities have been reported (2). Simultaneous administration of the mitochondrial metabolism inhibitor metformin and the glucose metabolism inhibitor 2-deoxy-D-glucose (2DG) ameliorate disease severity of lupus-prone mice significantly suggesting that the metabolic control of lupus may offer new therapeutic tools (3).
Glutaminolysis is a well-known source of energy for effector T cells and inhibition of multiple involved enzymes results in defective helper T cell differentiation especially of Th1 cells and Th17 cells (4). Glutaminase 1 (Gls1) is the first enzyme in the glutaminolysis and converts glutamine to glutamate. Recently we found that Th17 cells depend on glutaminolysis and Gls1 more than other T cell subsets and that the selective Gls1 inhibitor Bis-2-(5-phenylacetamido-1,3,4-thiadiazol-2-yl)ethyl sulfide (BPTES) suppresses Th17 development and ameliorates experimental autoimmune encephalomyelitis (EAE) disease (5). Patients with SLE have a higher frequency of Th17 cells which are considered to contribute to the establishment of pro-inflammatory conditions in multiple organs which they infiltrate (6–8).
Hypoxia-inducible factor 1α (HIF1α) is considered as a key metabolic sensor in Th17 cells and enhances Th17 development through direct transcriptional activation of RORγt and by forming a complex with RORγt and p300 on the IL-17 promoter (9) and by inducing glycolysis in Th17 cells (10). Although Von Hippel-Lindau tumor suppressor protein (VHL) is a component of an E3 ubiquitin ligase complex and is required for the ubiquitin-mediated degradation of HIF1α (11), whether this VHL-HIF1α-dependent mechanism contributes to Th17 development remains unknown.
Here using our newly generated IL-17 specific gls1 conditionally deficient mice we demonstrate the importance of glutaminase for the in vitro and in vivo differentiation of Th17 cells. Translationally, treatment of lupus-prone mice with BPTES reduced pathology and treatment of CD4+ cells from patients with SLE with BPTES reduced their ability to differentiate in to Th17 cells. We observed that pharmacological inhibition of Gls1 affects not only glutaminolysis but also glycolysis particularly in the later phase of Th17 cultures. This effect is more obvious in T cells from lupus-prone mice than those from B6 mice. At mechanistic level, we observed that Gls1 inhibition significantly reduces Hif1α expression in T cells. Because VHL inhibition which contributes to degradation of HIF1α, rescued the Th17 differentiation in vitro, we report that glutaminolysis can affect glycolysis by modulating Hif1α expression in Th17 cells.
PATIENTS AND METHODS
Patients
Patients (n = 6, all females, age 46.2 ± 18 years old) who fulfilled the criteria for the diagnosis of SLE as set forth by the American College of Rheumatology (12) and healthy donors (n = 6, 3 females and 3 males, age 36.5 ± 12 years old) were enrolled. The BIDMC institutional review board approved the study protocol, (2006-P-0298). Informed consent was obtained from all study subjects.
Mice
C57BL/6 (B6), STOCK Il17atm1.1(icre)Stck/J (IL-17 Cre), STOCK Glstm2.1Sray/J (Gls1 lox), and MRL/MpJ-Faslpr/J (MRL/lpr) mice were purchased from The Jackson Laboratory. Gls1fl/flIl17Cre+/− (Gls1fl/flIl17Cre) F2 mice were made by crossing IL-17 Cre mice with Gls1 lox mice. Gls1+/+Il17Cre+/− (Gls1+/+Il17Cre) F2 mice were used as control mice. Animals were sacrificed at the end of their 8–12 weeks of life for in vitro culture experiments and indicated week for in vivo experiments. To examine the effect of pharmacological Gls1 inhibition in vivo, 100 μg/mice BPTES or dimethyl sulfoxide (DMSO) in PBS was treated twice a week intraperitoneally from 8 to 16 weeks in MRL/lpr mice. All mice were maintained in an SPF animal facility (Beth Israel Deaconess Medical Center). Experiments were approved by the Institutional Animal Care and Use Committee of BIDMC.
Single cell isolation
For mouse, spleen and lymph node lymphocytes as well as infiltrating lymphocytes in spinal cords were isolated as previously described (5). Kidneys were perfused with PBS and digested with collagenase type IV (100 μg/ml) (Worthington Biochemical) in Hank’s balanced salt solution (HBSS) for 30 min (37 °C). For human, peripheral blood was collected and total human T cells were purified as described previously. In short, T cells were isolated by negative selection (RosetteSep, Stem Cell Technologies) before density gradient purification (Lymphoprep, Nycomed) (13).
In vitro T cell differentiation
For murine Th17 polarized culture, purified naive T cells were stimulated with plate-bound goat anti-hamster antibodies, soluble anti-CD3 Ab (0.25 μg/ml,145–2C11; Biolegend), anti-CD28 Ab (0.5 μg/ml, 37.51; Biolegend), IL-6 (10 ng/ml; R&D Systems), TGF-β1 (0.3 ng/ml; R&D Systems), anti-IL-4 Ab (10 μg/ml, C17.8; Biolegend), and anti-IFNγ Ab (10 μg/ml; XMG1.2; Biolegend). For the human Th17-polarized cultures, isolated naive CD4 T cells were stimulated with plate-bound anti-CD3 Ab (1 μg/ml, OKT-3; BioXCell), anti-CD28 Ab (1 μg/ml, CD28.2; Biolegend), IL-6 (50 ng/ml; # NM_000600; Biolegend), TGF-β1 (10 ng/ml, # NM_003236; Biolegend), IL-1β (10 ng/ml, # NM_000576; Biolegend), IL-23 (50 ng/ml, # NP_057668 and # NP_002178.2; Biolegend), anti-IL-4 Ab (10 μg/ml, MP4–25D2; BioXCell), and anti-IFNγ Ab (5 μg/ml; B27; BioXCell) (14). For the pharmacological Gls1 inhibition experiments, BPTES were diluted in 0.5 % DMSO and 10 mM BPTES or 0.5 % DMSO were administrated in the culture.
Metabolism assays.
Extracellular acidification rate (ECAR) and oxygen consumption rate (OCR) were measured using a XFp extracellular flux analyzer. To measure glutaminolysis, assay buffer was made of XF base medium (without glutamine) with 10mM Glucose and 1.0mM sodium pyruvate. Cell-Tak Cell and Tissue Adhesive (Corning) was used for coating plates and 0.15×10⁶ T cells per wells were seeded. To analyze glutaminolysis in cells on glutamine (Gln), we calculated and compared the amount of ΔΔOCR as follows (Supplementary Figure 1): We first determined the ΔOCR (with Gln) and ΔOCR (without Gln) which represent the change in the amount of OCR caused by supplementation of media in the presence or absence of Gln respectively (5). Glutaminolysis was defined as the calculated ΔΔOCR (ΔOCR with Gln minus ΔOCR without Gln). All other procedures, including glycolysis stress test were performed according to the manufacturer’s instructions (Agilent).
Western blotting
Cell lysates ware separated on NuPAGE 4%–12% Bis-Tris Gel (Life Technologies) and proteins were transferred to a nitrocellulose membrane (5). The following antibodies were used; anti-βactin Ab (Sigma-Aldrich), anti-glutaminase Ab (Abcam) and goat anti-rabbit IgG coupled with HRP (Jackson Immunoresearch). The ECL system (Amersham) was used for detection.
Flow cytometry
We applied established protocols as previously described (5). The following antibodies were used for flow cytometry analysis; For mouse, CD4 (GK1.5), CD45 (30-F11), CD90.2 (53–2.1), and IL-17A (JC11–18H10.1) were purchased from BioLegend. For human, CD45RA (HI100) was purchased from BioLegend. A CD4 (SK3) was purchased from eBioscience. A Zombie Aqua™ Fixable Viability Kit (intracellular) staining was performed for eliminating dead cells. Surface staining was performed on ice for 20–30 min. Absolute cell numbers were calculated on the basis of the percentage of each cell population. For intracellular staining, harvested cells were stimulated for 4 hours in culture medium with PMA (Sigma-Aldrich), ionomycin (Sigma-Aldrich), and monensin (BD Biosciences). Cytofix/Cytoperm and Perm/Wash buffer (IL-17A/ IFNγ; BD Biosciences) was used for fixation and permeabilization. All flow cytometry data were acquired on a BD LSRII (BD Biosciences) or Cytoflex LX (Beckman Coulter) and analyzed with FlowJo (FlowJo, llc). All procedures were performed according to the manufacturer’s instructions.
Transfection of overexpression vectors
Gls1 overexpression vector was made by Genescript and was constructed by using the pIRES2-DsRed-Express vector. The construct was verified by DNA sequencing. For Gls1 overexpression experiments in murine primary T cells, cells were harvested one day after starting culture and empty vector, or Gls1-overexpression plasmid were transfected using the Amaxa Mouse T Cell Nucleofector Kit with the X-001 program (Amaxa) as previously described (5). The efficacy of the transfection in living cells was tested by flowcytometry and always exceeded 10%.
RNA isolation and quantitative PCR
TRIzol Reagent was used for RNA preparation. Following TaqMan probes (Thermo Fisher Scientific) were used to detect target genes (Murine; Gls1 Mm01257297_m1, TATA box-binding protein (Tbp) Mm00446973_m1, and Gusb (β-glucuronidase) Mm01197698_m1. Gene expression was assessed by the comparative CT method and normalized to the reference gene Tbp and Gusb (14).
Generation of lentiviral particles containing shRNAs
MISSION® pLKO.1-puro empty vector control plasmid DNA (Sigma Aldrich) was used for this cloning. We designed two gls1-shRNAs as followings and cloned them into the empty vector following the manufacturer’s protocols. Following oligonucleotide sequences were used for this cloning; 5’- CCGGGAGGGAAGGTTGCTGATTATACTCGAGTATAATCAGCAACCTTCCCTCTTTTTG −3’ and 5’- AATTCAAAAAGAGGGAAGGTTGCTGATTATACTCGAGTATAATCAGCAACCTTCCCTC −3’ for gls1-shRNA1, and 5’- CCGGATCTCGACGGGTTGCTATAATCTCGAGATTATAGCAACCCGTCGAGATTTTTTG −3’and 5’- AATTCAAAAAATCTCGACGGGTTGCTATAATCTCGAGATTATAGCAACCCGTCGAGAT −3’ for gls1-shRNA2. Sequences of cloned vectors were verified (Genewiz). MISSION® pLKO.1-puro non-mammalian shRNA control plasmid DNA control-shRNA (Sigma Aldrich) was used for control shRNA. Those vectors were transfected to 40% confluent HEK-293T cells by polyethyleneimine ‘Max’ (Polysciences, Inc.) according the manufacturer’s protocol. Culture media with shRNA contained-lentiviral particles was collected on day 4 (5).
EAE
On day 0, 8-week-old mice were immunized subcutaneously with 100 μg MOG35–55 peptide emulsified in complete Freund’s adjuvant (Sigma) containing 4 mg/ml Mycobacterium tuberculosis extract (H37Ra; Difco), distributed between the two hind flanks. On days 0 and 2, 150 ng/mouse pertussis toxin (List Biological Laboratories) was given by intraperitoneal injection. Mice were monitored and weighted daily until day 28. Following clinical scores were used: 1, limp tail; 2, hind-limb paresis; 3, hind-limb paralysis; 4, tetraplegia; 5, moribund.
Histological staining and analysis
Sections from 10% formalin fixed spinal cords and kidneys were stained with H&E or PAS, respectively. Spinal cord and kidney sections were scored by an investigator blinded to experimental group as previously described (5, 15).
Statistics
Statistical analyses were performed in GraphPad Prism version 6.0 software. Statistical significance was determined by t-tests (two-tailed) for two groups, one-way ANOVA with Bonfferoni’s multiple comparisons tests for three or more groups, or two-way ANOVA with Sidak’s multiple comparisons test for analysis with a quantitative outcome and two (or more) categorical explanatory variables. For the EAE experiments, clinical scores and body weight changes of each treatment group were compared using two-way ANOVA. P values of <0.05 were considered statistically significant (*P < 0.05; **P < 0.01).
RESULTS
BPTES treatment abrogates lupus disease in MRL/lpr mice.
Previously we had shown that Gls1 is requisite for Th17 differentiation and Gls1 inhibitor abrogates EAE disease activity (5). Because Th17 is also important for the pathogenesis of SLE (6–8), we thought that the Gls1 inhibitor can be used to treat lupus. To assess the importance of Gls1 and glutaminolysis in lupus, 8-week-old MRL/lpr mice were treated with DMSO or the Gls1 inhibitor BPTES. BPTES treatment significantly reduced double-negative T cells (CD3+CD4-CD8- cells) (Supplementary Figure 2A), urine albumin/creatinine ratio (Figure 1A) and glomerular renal pathology scores (Figures 1B–C, Supplementary Figure 2B and 2C). When we examined cell infiltration in the kidneys of BPTES-treated mice we found fewer IL-17A-producing T cells than in the kidneys of DMSO-treated mice while there was no significant difference in the numbers of IFNγ-producing T cells (Figure 1D).
Figure 1.

BPTES treatment ameliorates lupus disease. A-D, MRL/lpr mice were treated with DMSO or BPTES twice a week intraperitoneally. All mice were euthanized at 16 weeks of age. A, Ratio of urinary albumin (Alb) and creatinine (Cre) quantified by ELISA. Cumulative results of 12–13 mice per group were shown. B and C, PAS-stained kidney section and disease scores were shown. Representative histopathologic images (B) and quantitative cumulative data (C) were shown. Scale bars, 50 μm; n = 9. D, Kidney infiltrated CD45+ cells (ZA- CD45+), T cells (ZA- CD45+ Th1.2+), and IL-17A producing T cells (ZA- CD45+ Th1.2+ IL-17A+) were evaluated by flow cytometry. Cumulative results of 9 mice per group were shown. E, Naïve CD4+ T cells from patients with SLE (n = 6) and healthy donors (HD; n = 6) were cultured under Th17-polarizing conditions in the presence of DMSO or BPTES for 7 days. Percentage of IL-17A positive cells (ZA- IL-17A+) was measured by flow cytometry (ZA- IL-17A+). Cumulative data were shown. The data represents the mean ± SEM; *P < 0.05, **P < 0.01, ns, not significant.
BPTES treatment reduces in vitro Th17 differentiation in patients with SLE.
Furthermore, to assess whether Gls1 inhibition represents a new therapeutic strategy for patients with SLE, we isolated naïve CD4+ T cells from patients with SLE and healthy donor (HD), and cultured them in vitro under Th17 conditions with DMSO or BPTES. Th17 differentiation was significantly increased in T cells from the patients with SLE compared with HD (Figure 1E). BPTES suppressed Th17 differentiation of cells from patients with SLE but not from normal subjects compared to DMSO (Figure 1E).
Gls1 and glutaminolysis are requisite for Th17 differentiation in MRL/lpr mice.
To confirm the significance of Gls1 and glutaminolysis for Th17 differentiation in lupus-prone MRL/lpr mice and to clarify details of the involved mechanisms we performed in vitro cultures using naïve CD4+ T cells from MRL/lpr mice. First, naïve CD4+ T cells were cultured under Th17 conditions using various Gln concentrations in vitro. Th17 cell differentiation was significantly impaired following reduction of Gln concentrations in a dose-dependent manner (Figure 2A and B). To examine the importance of Gls1 in Th17 cell differentiation in MRL/lpr, naïve CD4+ T cells from those mice were cultured under Th17 conditions in the presence or absence of BPTES. BPTES treatment reduced glutaminolysis (ΔΔOCR, see supplementary Figure 1 and Figure 2C) and inhibited in vitro Th17 cell differentiation in MRL/lpr mice in a dose-dependent manner (Figure 2D and E). To confirm these observations, we transfected Th17-polarized cells from MRL/lpr mice with two variants of Gls1-shRNAs, which reduced effectively Gls1 expression, or with control-shRNA (Supplementary Figure 3). Both Gls1-shRNAs inhibited Th17 cell differentiation in MRL/lpr mice (Figure 2F).
Figure 2.

Gls1 is requisite for Th17 differentiation and promotes glycolysis in MRL/lpr mice. A-F, Naïve CD4+ T cells from MRL/lpr mice were cultured under Th17 polarizing condition. A, Cells were cultured in media containing the indicated doses of glutamine (Gln) (0–2.0 mM) for 3 days. Representative flow plots are shown. B, Cumulative data are shown; n = 4. C, Oxygen consumption rate (OCR) was measured by extracellular flux analyzer. Cumulative data of calculated glutaminolysis on day 2 were shown; n = 4. D and E, Cells were cultured in the presence of increasing concentration of BPTES (0–10 μΜ) for 3 days. Percentage of IL-17A positive cells (ZA- IL-17A+) was measured by flow cytometry. Representative data (D) are shown. Cumulative data (E) were shown; n = 3. F, Gls1-shRNA or control-shRNA containing lentiviral particles were infected on day 1. Percentage of IL-17A positive cells (ZA- IL-17A+) was measured by flow cytometry on day 4. Cumulative data were shown; n = 4. The data represents the mean ± SEM; *P < 0.05, **P < 0.01.
Gls1 promotes glycolysis in Th17-polarized cells in MRL/lpr mice.
A previous report has shown that treatment of lupus-prone B6.Sle1.Sle2.Sle3 mice with a combination of metformin, a mitochondrial metabolism inhibitor and 2DG, a glycolysis inhibitor normalized T cell metabolism and reduced disease activity (3), whereas metformin monotherapy did not change disease activity. Based on this report, we hypothesized that inhibition of Gls1 may also affect glycolysis. At first, naïve CD4+ T cells from MRL/lpr mice were cultured under Th17 conditions with DMSO or BPTES in vitro and ECAR was analyzed using an extracellular flux analyzer. On day 2, there is no significant difference between the two groups, whereas on day 3 and 5, BPTES-treated Th17 cells displayed less glycolysis and glycolytic capacity (Figure 3A and B). Previously we had shown that BPTES does not change ECAR in Th17-polarized T cells from B6 on day 2 (5). Because we noticed that BPTES decreases ECAR in MRL/lpr mice we repeated the experiment using B6 mice and found that although ECAR was not affected on days 2 and 3, it was decreased on day 5 (Figure 3C and D). The difference may be due to the different genetic background or the fact that the MRLlpr T cells display in inherently proinflammatory phenotype.
Figure 3.

Gls1 inhibition reduces glycolysis. A-D, Naïve CD4+ T cells from MRL/lpr (A and B) or B6 (C and D) mice were cultured under Th17 polarizing condition with DMSO or 10 mM BPTES. Glycolysis (A and C) and glycolytic capacity (B and D) were assessed by measuring extracellular acidification rate (ECAR) on day 2, 3, and 5. Cumulative data of extracellular acidification rate (ECAR) were shown; n = 3. The data represents the mean ± SEM; *P < 0.05, **P < 0.01.
Gls1 deficiency reduces Th17 cell differentiation and glycolysis.
To confirm the effect of Gls1 for glycolysis and reveal the mechanisms in IL-17 producing cells in a definitive manner, we generated a novel Gls1 conditional knockout mice in IL-17 producing cells. Naïve CD4+ T cells from Gls1+/+Il17Cre and Gls1fl/flIl17Cre mice were cultured under Th17 conditions in vitro and the OCR was analyzed in the presence or absence of 2 mM Gln (Supplementary Figure 1). Glutaminolysis (ΔΔOCR) was significantly higher in Th17 cells from Gls1+/+Il17Cre mice compared with those from Gls1fl/flIl17Cre mice (Figure 4A). Subsequently, naïve CD4+ T cells from these mice were isolated and cultured under the Th17-polrized conditions. Th17 cell differentiation was significantly impaired in Gls1fl/flIl17Cre mice compared with Gls+/+Il17Cre mice (Figure 4B and C). To confirm that Gls1 regulates Th17 cell differentiation, we overexpressed Gls1 in naïve CD4+ T cells from Gls1fl/flIl17Cre mice and polarized these to Th17 cells. Indeed, Gls1 overexpression restored Th17 cell differentiation (Figure 4D and E). Thus, we conclude that Gls1 is requisite for Th17 cell differentiation.
Figure 4.
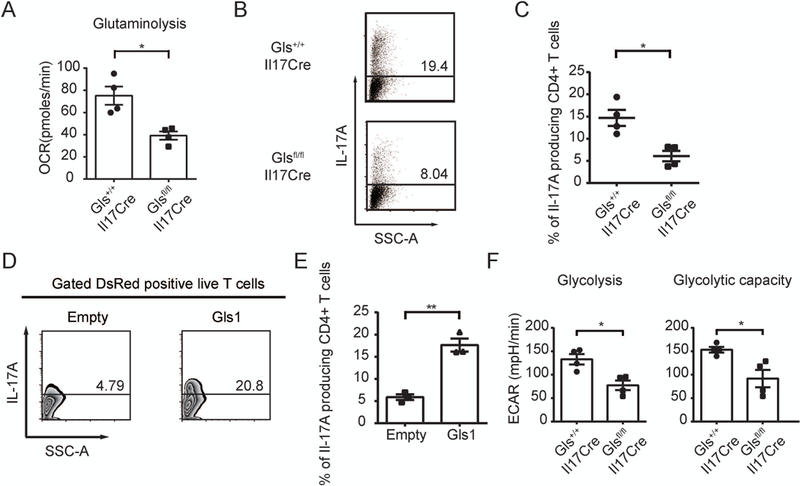
Gls1 deficiency reduces Th17 cell differentiation and glycolysis.
A-F, Naïve CD4 T cells from Gls1+/+Il17Cre mice and Gls1fl/flIl17Cre mice were cultured under Th17 polarizing conditions. A, Oxygen consumption rate (OCR) was measured by extracellular flux analyzer. Cumulative data of calculated glutaminolysis on day 2 are shown; n = 4. B, Percentage of IL-17A positive cells was measured by flow cytometry on day 5. Representative data are shown. C, Cumulative data were shown; n = 4. D and E, Empty vector (Empty), or Gls1 overexpression (Gls1) plasmids were transfected on day 1. Percentage of IL-17A positive cells was measured by flow cytometry on day 5. Representative data (D) and cumulative data (E) were shown; n = 3. F, Glycolysis and glycolytic capacity were assessed by measuring ECAR on day 5. Cumulative data were shown; n = 4. The data represents the mean ± SEM; *P < 0.05, **P < 0.01.
We also examined glycolysis in Th17-polarized cells from Gls+/+Il17Cre and Glsfl/flIl17Cre mice. Consistent with the results of MRL/lpr and B6 mice with BPTES, glycolysis and glycolytic capacity in Th17-polarized cells were decreased in Glsfl/flIl17Cre mice compared with Gls+/+Il17Cre mice (Figure 4F). From these data we confirmed that Gls1 is requisite for Th17 differentiation and promotes glycolysis.
Gls1 deficiency ameliorates EAE disease activity
To confirm that Gls1 is crucial for Th17 differentiation in vivo, EAE was induced in 8- to 10-week-old in Gls1+/+Il17Cre and Gls1fl/flIl17Cre mice by immunizing them with myelin oligodendrocyte glycoprotein (MOG35–55). As shown in Figure 5A and Supplementary Figure 4A, Gls1fl/flIl17Cre mice displayed significantly reduced clinical score and body weight loss compared with Gls1+/+Il17Cre mice. Histology scores of spinal cords from diseased animals were significantly decreased in the Gls1fl/flIl17Cre mice (Figure 5B and 5C). This observation was further confirmed by assessing the absolute numbers of spinal cord-infiltrating cells by flow cytometry. Gls1fl/flIl17Cre mice had reduced the numbers of CD4+ T cells, IL-17A and IFNγ-producing CD4+ T cells in the spinal cord compared with those of Gls1+/+Il17Cre mice (Figure 5D and Supplementary Figure 4B). These observations further strengthen the indispensable role of Gls1 for the production of IL-17 by CD4+ cells in vivo.
Figure 5.

Gls1 deficiency ameliorates EAE disease activity.
A-D, EAE was induced in Gls1+/+Il17Cre mice and Gls1fl/flIl17Cre mice. The clinical scores (A) are shown. Cumulative results of 10 mice per group are shown. B and C, Spinal cords were harvested at day 14 and stained with H&E to assess inflammation. Representative histopathologic images (B) and quantitative cumulative data (C) are shown. Scale bars, 500 μm or 100 μm (magnified panels); n = 9 (Gls1+/+Il17Cre mice). n = 11 (Gls1fl/flIl17Cre mice). D, Absolute cell numbers of spinal-cord infiltrated CD4+ T cells (ZA- Th1.2+ CD4+) and IL-17A producing CD4+ T cells (ZA- Th1.2+ CD4+IL-17A+) from recipient mice were evaluated by flow cytometry on day 14. Cumulative data are shown; n=5. The data represents the mean ± SEM; *P < 0.05, **P < 0.01.
Inhibition of Gls1 reduced glycolysis by reducing Hif1α protein
From previous results, we confirmed that Gls1 is requisite for Th17-related autoimmune pathology and promotes glycolysis. Then we focused on how Gls1 promotes glycolysis. HIF1α is requisite for glycolysis and Th17 cell differentiation (10). Therefore, we examined protein levels of HIF1α using two different Gls-shRNAs or control-shRNA transfected in cells from MRL/lpr mice undergoing Th17 polarization. HIF1α protein was decreased in cells in which the Gls1 expression was silenced (Figure 6A).
Figure 6.

Gls1 inhibition reduces Hif1α expression and Th17 differentiation.
A, Naïve CD4+ T cells from MRL/lpr mice were cultured under Th17-polarizing conditions. Gls1-shRNA or control-shRNA containing lentiviral particles were infected on day 1 and cells were harvested on day 4. Indicated protein expression was assessed by western blotting. Representative blots are shown. Data are representative of 3 experiments. B and C, Naïve CD4+ T cells from Gls1+/+Il17Cre mice and Gls1fl/flIl17Cre mice were cultured under Th17-polarizing conditions. Cells were cultured in the presence of VH298 (0, 30 and 100 μΜ) for 5 days. Percentage of IL-17A positive cells was measured by flow cytometry on day 5. Representative data (B) and cumulative data (C) were shown; n=4. D, Schematic representation of mechanism whereby Gls inhibition reduces glycolysis in Th17 cells. Gls inhibition reduces the expression of HIF1α, which is a canonical glycolysis master regulator. Reduction of Hif1α diminishes glycolysis and Th17 differentiation. The data represents the mean ± SEM; *P < 0.05, **P < 0.01.
To confirm the reduction of Th17 differentiation by Gls1 inhibition was due to protein levels of HIFα, we used IL-17 specific Gls1 deficient mice. Because VHL is the recognition component of the E3-ubiquitin ligase complex involved in the degradation of HIF1α, we tested whether pharmacological inhibition of VHL could restore Th17 differentiation of Gls1 deficient T cells. VH298 is a potent VHL inhibitor known to disrupt the interaction of VHL with HIF1α and to stabilize HIF1α (16). As expected, VHL inhibition partially restored Th17 cell differentiation in Gls1fl/flIl17Cre mice and increased Th17 differentiation in Gls1+/+Il17Cre mice in dose-dependent manner (Figure 6B and C). All this together, Gls1 inhibition reduces HIF1α protein, a canonical glycolysis and Th17 master regulator. Thus, we conclude that Gls1 inhibition reduces glycolysis and diminishes Th17 differentiation (Figure 6D).
DISCUSSION
In this study, we have shown that inhibition or deficiency of Gls1 reduced Th17 differentiation and glycolysis by diminishing Hif1α. Gls1 inhibition or deficiency ameliorates EAE and lupus in MRL/lpr mice. At the translational level, a Gls1 inhibitor reduced in vitro Th17 differentiation of CD4+ T cells from the patients with SLE.
SLE is a chronic autoimmune disease affecting multiple organs with unknown etiology (1) and causes life-threatening complications in spite of aggressive therapy (17). Because of its heterogeneity, many clinical trials were failed and new therapeutic strategies are highly desired (17). A previous paper had shown that the inhibitor of mitochondrial complex I, metformin, reduced OCR in CD4+ cells from lupus-prone B6.Sle1.Sle2.Sle3 mice, while ECAR was increased by metformin, most likely as an alternative pathway to generate ATP (3). Interestingly when glutaminolysis was inhibited by the Gls1 inhibitor BPTES, we found that not only glutaminolysis but also glycolysis was decreased in Th17-polarized cells. The time course of ECAR after Gls1 inhibition was different between strains of mice, suggesting that the importance of glutaminolysis may be different among strains.
Hif1α is a key transcription factor which orchestrates the expression of glycolytic enzymes and is promoted by mTORC1 signaling (18). Hif1α is expressed mainly in Th17 cells and to a lesser extent in Th1 cells. Hif1α-deficient CD4+ T cells have reduced Th17 cell differentiation and gene expression of glycolytic enzymes, thus considered as a key metabolic sensor in Th17 cells and enhances Th17 development (10). On the other hand, VHL is the recognition component of the E3-ubiquitin ligase complex and degrades Hif1α. A report has shown that VHL has an important role in Treg cells (11), whereas few reports have shown that the role of VHL in Th17 cells (19).
In SLE, global CpG-DNA hypo-methylation correlates with disease activity and many proinflammatory cytokine genes are overexpressed in CD4+ T lymphocytes from the patients with SLE in a chromatin-dependent manner including IL4, IL6, IL10, IL13 and IL17A (20). Interestingly the VHL promoter has been claimed to be hypermethylated in SLE (21), which suggests that VHL expression is decreased in patients with SLE compared with healthy subjects. In this communication we show that Gls1 inhibition reduced Hif1α in Th17 cells from MRL/lpr mice. Furthermore, the evidence that a pharmacologic inhibition of VHL in Gls1-deficent CD4+ T cells partially restored their ability to differentiate to Th17 cells confirms the indispensable role of Gls1 inhibition for affecting glycolysis by Hif1α expression. Since VHL inhibitor did not perfectly restore their ability to differentiate to Th17 cells in Gls1-deficent CD4+ T cells, besides glycolysis glutaminolysis is important for the differentiation for Th17 cells. Inhibition of glutaminolysis with the glutamine analog 6-Diazo-5-oxo-L-norleucine reduces follicular helper T (TFH) cells which are expanded in patients with SLE and are required to produce high affinity autoantibodies (22). It is possible that BPTES, in addition to Th17, suppress TFH cells in MRL/lpr mice.
Gls1 inhibitors have been considered for the treatment of various cancers in mice (23, 24) and some of them have entered clinical trials (25, 26). In this study we showed that deficiency of Gls1 resulted in decreased EAE and that treatment of BPTES decreased the disease activity of MRL/lpr mice. At the translational level, BPTES treatment reduced the in vitro Th17 differentiation of CD4+ T cells from the patients with SLE.
In summary, we have shown that Gls1 deficiency or inhibition reduces Th17 differentiation, disease activity in mice induced to develop EAE and lupus-prone mice via reduction of HIF1α and glycolysis. At the translational level we have found that a Gls1 inhibitor reduces in vitro Th17 differentiation of CD4+ T cells from patients with SLE. We propose that glutaminase is a possible target for the treatment of Th17-related autoimmune diseases including lupus.
Supplementary Material
ACKNOWLEDGMENT
The authors would like to thank all the members and laboratory assistants of the Department of Medicine in Beth Israel Deaconess Medical Center for their technical support and valuable discussion.
Supported by National Institutes of Health grant R37 AI49954, a SENSHIN Medical Research Foundation grant (to M.K.), and the Japan Society for the promotion of science postdoctoral fellowships for research abroad (to N.Y.).
Michihito Kono reports grants from GlaxoSmithKline plc (more than $ 10,000). George C. Tsokos reports consultancies, speaking fees, or honoraria from Janssen, Novartis, ABPRO, Silicon Therapeutics, A2 Thera (less than $10,000). Other authors have declared that no conflict of interest exists.
REFERENCES
- 1.Moulton VR, Tsokos GC. T cell signaling abnormalities contribute to aberrant immune cell function and autoimmunity. J Clin Invest 2015;125:2220–7. [DOI] [PMC free article] [PubMed] [Google Scholar]
- 2.Morel L Immunometabolism in systemic lupus erythematosus. Nat Rev Rheumatol 2017;13:280–90. [DOI] [PubMed] [Google Scholar]
- 3.Yin Y, Choi SC, Xu Z, Perry DJ, Seay H, Croker BP, et al. Normalization of CD4+ T cell metabolism reverses lupus. Sci Transl Med 2015;7:274ra18. [DOI] [PMC free article] [PubMed] [Google Scholar]
- 4.Xu T, Stewart KM, Wang X, Liu K, Xie M, Kyu Ryu J, et al. Metabolic control of TH17 and induced Treg cell balance by an epigenetic mechanism. Nature 2017;548:228–33. [DOI] [PMC free article] [PubMed] [Google Scholar]
- 5.Kono M, Yoshida N, Maeda K, Tsokos GC. Transcriptional factor ICER promotes glutaminolysis and the generation of Th17 cells. Proc Natl Acad Sci U S A 2018;115:2478–83. [DOI] [PMC free article] [PubMed] [Google Scholar]
- 6.Crispin JC, Oukka M, Bayliss G, Cohen RA, Van Beek CA, Stillman IE, et al. Expanded double negative T cells in patients with systemic lupus erythematosus produce IL-17 and infiltrate the kidneys. J Immunol 2008;181:8761–6. [DOI] [PMC free article] [PubMed] [Google Scholar]
- 7.Kyttaris VC, Zhang Z, Kuchroo VK, Oukka M, Tsokos GC. Cutting edge: IL-23 receptor deficiency prevents the development of lupus nephritis in C57BL/6-lpr/lpr mice. J Immunol 2010;184:4605–9. [DOI] [PMC free article] [PubMed] [Google Scholar]
- 8.Pisitkun P, Ha HL, Wang H, Claudio E, Tivy CC, Zhou H, et al. Interleukin-17 cytokines are critical in development of fatal lupus glomerulonephritis. Immunity 2012;37:1104–15. [DOI] [PMC free article] [PubMed] [Google Scholar]
- 9.Dang EV, Barbi J, Yang HY, Jinasena D, Yu H, Zheng Y, et al. Control of T(H)17/T(reg) balance by hypoxia-inducible factor 1. Cell 2011;146:772–84. [DOI] [PMC free article] [PubMed] [Google Scholar]
- 10.Shi LZ, Wang R, Huang G, Vogel P, Neale G, Green DR, et al. HIF1alpha-dependent glycolytic pathway orchestrates a metabolic checkpoint for the differentiation of TH17 and Treg cells. J Exp Med 2011;208:1367–76. [DOI] [PMC free article] [PubMed] [Google Scholar]
- 11.Lee JH, Elly C, Park Y, Liu YC. E3 Ubiquitin Ligase VHL Regulates Hypoxia-Inducible Factor-1alpha to Maintain Regulatory T Cell Stability and Suppressive Capacity. Immunity 2015;42:1062–74. [DOI] [PMC free article] [PubMed] [Google Scholar]
- 12.Hochberg MC. Updating the American College of Rheumatology revised criteria for the classification of systemic lupus erythematosus. Arthritis Rheum 1997;40:1725. [DOI] [PubMed] [Google Scholar]
- 13.Kono M, Yoshida N, Maeda K, Skinner NE, Pan W, Kyttaris VC, et al. Pyruvate dehydrogenase phosphatase catalytic subunit 2 limits Th17 differentiation. Proc Natl Acad Sci U S A 2018;115:9288–93. [DOI] [PMC free article] [PubMed] [Google Scholar]
- 14.Kono M, Maeda K, Stockton I, Pan W, Umeda M, Katsuyama E, et al. Pyruvate kinase M2 is requisite for Th1 and Th17 differentiation. JCI Insight, in press. [DOI] [PMC free article] [PubMed] [Google Scholar]
- 15.Ichinose K, Juang YT, Crispin JC, Kis-Toth K, Tsokos GC. Suppression of autoimmunity and organ pathology in lupus-prone mice upon inhibition of calcium/calmodulin-dependent protein kinase type IV. Arthritis Rheum 2011;63:523–9. [DOI] [PMC free article] [PubMed] [Google Scholar]
- 16.Frost J, Galdeano C, Soares P, Gadd MS, Grzes KM, Ellis L, et al. Potent and selective chemical probe of hypoxic signalling downstream of HIF-alpha hydroxylation via VHL inhibition. Nat Commun 2016;7:13312. [DOI] [PMC free article] [PubMed] [Google Scholar]
- 17.Tsokos GC. Systemic lupus erythematosus. N Engl J Med 2011;365:2110–21. [DOI] [PubMed] [Google Scholar]
- 18.Nizet V, Johnson RS. Interdependence of hypoxic and innate immune responses. Nat Rev Immunol 2009;9:609–17. [DOI] [PMC free article] [PubMed] [Google Scholar]
- 19.Ikejiri A, Nagai S, Goda N, Kurebayashi Y, Osada-Oka M, Takubo K, et al. Dynamic regulation of Th17 differentiation by oxygen concentrations. Int Immunol 2012;24:137–46. [DOI] [PubMed] [Google Scholar]
- 20.Hedrich CM, Crispin JC, Tsokos GC. Epigenetic regulation of cytokine expression in systemic lupus erythematosus with special focus on T cells. Autoimmunity 2014;47:234–41. [DOI] [PubMed] [Google Scholar]
- 21.Hong KM, Kim HK, Park SY, Poojan S, Kim MK, Sung J, et al. CD3Z hypermethylation is associated with severe clinical manifestations in systemic lupus erythematosus and reduces CD3zeta-chain expression in T cells. Rheumatology (Oxford) 2017;56:467–76. [DOI] [PMC free article] [PubMed] [Google Scholar]
- 22.Choi SC, Titov AA, Abboud G, Seay HR, Brusko TM, Roopenian DC, et al. Inhibition of glucose metabolism selectively targets autoreactive follicular helper T cells. Nat Commun 2018;9:4369. [DOI] [PMC free article] [PubMed] [Google Scholar]
- 23.Okazaki A, Gameiro PA, Christodoulou D, Laviollette L, Schneider M, Chaves F, et al. Glutaminase and poly(ADP-ribose) polymerase inhibitors suppress pyrimidine synthesis and VHL-deficient renal cancers. J Clin Invest 2017;127:1631–45. [DOI] [PMC free article] [PubMed] [Google Scholar]
- 24.Elgogary A, Xu Q, Poore B, Alt J, Zimmermann SC, Zhao L, et al. Combination therapy with BPTES nanoparticles and metformin targets the metabolic heterogeneity of pancreatic cancer. Proc Natl Acad Sci U S A 2016;113:E5328–36. [DOI] [PMC free article] [PubMed] [Google Scholar]
- 25.DeLaBarre B, Hurov J, Cianchetta G, Murray S, Dang L. Action at a distance: allostery and the development of drugs to target cancer cell metabolism. Chem Biol 2014;21:1143–61. [DOI] [PubMed] [Google Scholar]
- 26.Shukla K, Ferraris DV, Thomas AG, Stathis M, Duvall B, Delahanty G, et al. Design, synthesis, and pharmacological evaluation of bis-2-(5-phenylacetamido-1,2,4-thiadiazol-2-yl)ethyl sulfide 3 (BPTES) analogs as glutaminase inhibitors. J Med Chem 2012;55:10551–63. [DOI] [PMC free article] [PubMed] [Google Scholar]
Associated Data
This section collects any data citations, data availability statements, or supplementary materials included in this article.