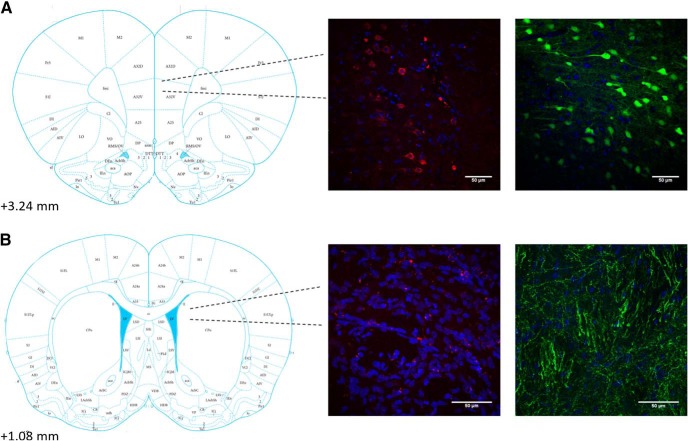
Figure 2.
A, Location (left panel) and representative images (right panels) of cell bodies expressing DREADDs-mCherry construct (left) or GFP control construct (right) in the PL (area 32) at 40×. Blue is DAPI nuclear stain. B, Location (left panel) and representative images (right panels) of axon terminals in aDMS expressing DREADDs-mCherry (left) or GFP (right) at 60×. Scale bars = 50 μm.

