

Brain insulin resistance is a key pathological feature contributing to obesity, diabetes, and neurodegenerative disorders, including Alzheimer’s disease (AD). Besides the classic transcriptional mechanism mediated by hormones, posttranscriptional regulation has recently been shown to regulate a number of signaling pathways that could lead to metabolic diseases.
KEYWORDS: brain insulin resistance, posttranscriptional RNA binding proteins
ABSTRACT
Brain insulin resistance is a key pathological feature contributing to obesity, diabetes, and neurodegenerative disorders, including Alzheimer’s disease (AD). Besides the classic transcriptional mechanism mediated by hormones, posttranscriptional regulation has recently been shown to regulate a number of signaling pathways that could lead to metabolic diseases. Here, we show that microRNA 7 (miR-7), an abundant microRNA in the brain, targets insulin receptor (INSR), insulin receptor substrate 2 (IRS-2), and insulin-degrading enzyme (IDE), key regulators of insulin homeostatic functions in the central nervous system (CNS) and the pathology of AD. In this study, we found that insulin and liver X receptor (LXR) activators promote the expression of the intronic miR-7-1 in vitro and in vivo, along with its host heterogeneous nuclear ribonucleoprotein K (HNRNPK) gene, encoding an RNA binding protein (RBP) that is involved in insulin action at the posttranscriptional level. Our data show that miR-7 expression is altered in the brains of diet-induced obese mice. Moreover, we found that the levels of miR-7 are also elevated in brains of AD patients; this inversely correlates with the expression of its target genes IRS-2 and IDE. Furthermore, overexpression of miR-7 increased the levels of extracellular Aβ in neuronal cells and impaired the clearance of extracellular Aβ by microglial cells. Taken together, these results represent a novel branch of insulin action through the HNRNPK–miR-7 axis and highlight the possible implication of these posttranscriptional regulators in a range of diseases underlying metabolic dysregulation in the brain, from diabetes to Alzheimer’s disease.
INTRODUCTION
Although the brain was once considered an insulin-insensitive organ, it is now established that insulin actions regulate important functions in the central nervous system (CNS), including synaptic plasticity, learning and memory, and neuroprotection. Insulin receptor (INSR), insulin-like growth factor receptor (IGFR), and their signaling partners, such as insulin receptor substrate 1 (IRS-1) and IRS-2, are distributed throughout the brain and regulate processes such as neurogenesis, cell growth, and synaptic maintenance, as well as amyloid-β peptide (Aβ) degradation. Importantly, impairment of insulin signaling in the brain is associated with the development of a number of pathologies, including diabetes and Alzheimer’s disease (AD). The development of diabetes and AD has been found to share many pathophysiological features, including insulin resistance (IR), impaired glucose metabolism, and cognitive decline. Individuals with diabetes have a 1.5- to 2.0-fold-higher risk of developing AD than individuals without diabetes (1). Insulin can exert neuroprotective effects by preventing Tau hyperphosphorylation and promoting the extracellular degradation of Aβ through the regulation of insulin-degrading enzyme (IDE), which represents a key molecular link between AD and diabetes (2). Furthermore, intranasal administration of insulin has been shown to improve cognitive decline in AD patients (3). As such, understanding the biological mechanisms that link the development of diabetes with AD is essential for the development of future intervention and/or prevention strategies.
MicroRNAs (miRNAs) are small (18 to 25 nucleotides [nt]), evolutionarily conserved, noncoding RNAs that have an important function in gene regulation, acting predominantly at the posttranscriptional level. By binding to the 3′ untranslated regions (UTRs) of target mRNAs, miRNAs repress translation or induce mRNA degradation (4, 5). A growing number of studies from our group and others have demonstrated a critical role for miRNAs in regulating lipid and glucose homeostasis, including miRNA 33 (miR-33), miR-758, miR-144, and let-7, etc., and their impact on metabolic diseases (6–9). Of note, the expression of many of these miRNAs is altered in aberrant metabolic states such as diabetes as well as in AD, important pathologies where dysregulation of lipid and glucose metabolism represents a common feature (10, 11). However, the role of miRNAs in regulating insulin sensitivity in the brain in the context of AD remains unexplored. Therefore, miRNAs may represent novel candidates to link AD and insulin resistance in the CNS at the molecular level.
miR-7 is an evolutionarily highly conserved miRNA that is considered a prototypical neuroendocrine miRNA, being highly expressed in neuroendocrine organs such as the pancreas and brain (12). In humans, the miR-7 family consists of three members (miR-7-1, miR-7-2, and miR-7-3) localized on human chromosomes 9, 15, and 19, respectively. miR-7 has been shown to regulate important aspects of pancreatic biology and functions, including cell differentiation and insulin production (12, 13), whereas its role in the brain remains incomplete. Nevertheless, miR-7 expression seems to be highly regulated in the brain by several other posttranscriptional regulators, such as RNA binding proteins (RBPs) (14) and miRNA sponges (15), suggesting its important role in the CNS. We have identified miR-7 as a potential candidate involved in the regulation of brain insulin resistance and AD pathology. Using bioinformatic prediction algorithms and gene ontology (GO) enrichment analysis, we found that potential miR-7 targets are enriched in gene clusters involved in insulin signaling and related pathways (INSR, IRS-1, phosphatidylinositol 3-kinase [PI3K], and IGF1R) and AD (most notably IDE). miR-7-1 is an intronic miRNA located in HNRNPK, an RBP that was recently shown to be involved in insulin actions at the posttranscriptional level (16). Furthermore, our results show that miR-7 represses the expression of INSR, IRS-2, and IDE, among other important members of the insulin signaling pathway, in mouse and human neuronal cells. Moreover, we have also found that miR-7 is regulated by insulin and liver X receptor (LXR) both in vitro and in vivo, effects that are likely mediated through SREBP1c. Also, we found that miR-7 levels are aberrant in the brains of obese mice and in susceptible brain areas of AD patients, which inversely correlate with the expression of insulin-signaling genes and genes involved in Aβ metabolism. Finally, our data show that miR-7 can regulate Aβ levels in vitro in neuronal cells. Overall, these data suggest that miR-7 may regulate insulin signaling and Aβ levels in the brain during the progression of AD.
RESULTS
miR-7 is highly abundant in the brain and targets key elements of the insulin signaling pathway and Alzheimer’s disease.
The miR-7 family is a highly conserved family of miRNAs consisting of three members, miR-7-1, miR-7-2, and miR-7-3, in humans, corresponding to miR-7a-1, miR-7a-2, and miR-7b in mice (Fig. 1A). Both human and mouse miR-7 precursors give rise to identical mature forms (Fig. 1B), indicating their conservation (Fig. 1C). However, their distinct genomic locations suggest possible differential functions and/or regulation. Intriguingly, miR-7-1 and its mouse counterpart miR-7a-1 are encoded within introns 16 and 17 of the human and mouse HNRNPK genes, respectively (Fig. 1A). Analysis of precursors by quantitative real-time PCR (qRT-PCR) in mouse tissues shows that miR-7a-1 is abundantly expressed in the brain and in the liver, while precursors of miR-7a-2 and miR-7b are highly expressed in the brain compared with other organs (Fig. 1D). Analysis of the mature form indicates that the miR-7 expression level is relatively higher in brain than in other organs (Fig. 1D). Further analysis by Northern blotting of different mouse brain tissues revealed that miR-7 is highly abundant in the hypothalamus (Fig. 1E). To determine which molecular pathways would be affected by miR-7 in the brain, we performed predicted target gene analysis using a combination of bioinformatic tools for miRNA target predictions (TargetScan [http://www.targetscan.org], gene ontology [Panther {http://www.pantherdb.org/}], and protein-protein interactions [String {http://string-db.org/}]). We found that miR-7 is a strong candidate to regulate genes involved in metabolism, where insulin and insulin/IGF pathways markedly showed a significant enrichment among them (Fig. 2A and B). Common predicted targets within these two overrepresented pathways, including the INSR, IGF1R, AKT, IRS-1, and IRS-2 genes, were subjected to protein-protein interaction analysis, showing that miR-7 might play an important role in controlling insulin signaling (Fig. 2C). The number, type, and conservation of predicted sites for the common target genes from both pathways are shown in Fig. 2D. Given the role of insulin in maintaining brain homeostasis and the correlation between brain insulin resistance and AD, we further explored whether other potential target genes involved in this pathology might be predicted targets for miR-7. Our bioinformatic analysis indicated that miR-7 potentially targets a number of genes involved in different aspects of Aβ metabolism, including the IDE, ABCA1, APP, PSEN1, and BACE1 genes (Fig. 3). To confirm the impact of miR-7 on the expression of the above-mentioned targets, we transfected miR-7-5p oligonucleotides in mouse N2a neuronal cells. As shown in Fig. 4A, the overexpression of miR-7 significantly decreased IRS-2, AKT, IGF1R, and IDE mRNA levels. Conversely, inhibition of endogenous levels of miR-7 using anti-miR-7 oligonucleotides increased INSR, IRS-1, IRS-2, AKT, IGF1R, and IDE mRNA levels (Fig. 4B). Similar results were found at the protein level when we assessed their expression by Western blotting (Fig. 4C). Similar effects were observed with INSR, IRS-2, and IDE when we overexpressed miR-7 in human SHSY5Y neuronal cells (data not shown). Next, we analyzed the direct effect of miR-7 on the 3′ UTRs of the key targets of insulin signaling and AD. To do this, we cloned the 3′ UTRs of the INSR, IRS-2, and IDE genes into a luciferase reporter plasmid and assessed their activity after miR-7-5p overexpression (Fig. 4D to F). The conservation and type of predicted miR-7 binding sites are shown in the right panels and point mutations are indicated in the top panels of Fig. 4D and E. Our data show that miR-7 significantly repressed INSR, IRS-2, and IDE 3′-UTR activities, and the mutation of the miR-7 target sites relieved the repression of the INSR, IRS-2, and IDE 3′ UTRs, which is consistent with its direct interaction with the mRNAs studied.
FIG 1.

miR-7 genomic locations, mouse tissue expression, and conservation of precursor and mature miR-7 among species. (A) Schematic representation of the genomic locations of miR-7 family members in human and mouse. Human miR-7-1 and murine miR-7a-1 are located in introns 16 and 17 of the HNRNPK gene, respectively. miR-7-2 and miR-7-3 are located in intergenic regions of human chromosomes 15 and 19. Murine miR-7 genes and their chromosome locations are shown in gray. (B) Sequence alignment between human miR-7 family members. Seed sequences are indicated in boxes. Blue indicates the mature 5p and 3p sequences. (C) Gene expression analyses (qRT-PCR) of precursors and mature miR-7-1-5p in different mouse tissues normalized to snoRD68. Data are expressed relative to the amount of miR-7-5p transcripts expressed in the heart. Results are means ± SEM from three independent experiments. (D) Representative Northern blot analysis of miR-7-5p in different brain tissues showing an enrichment in mouse hypothalamus. 5S rRNA was used as a loading control. (E) Sequence alignment of the stem-loop and mature miR-7 among species. WAT, white adipose tissue; hsa, Homo sapiens (human); ptr, Pan troglodytes (chimpanzee); mml, Macaca mulatta (rhesus macaque); str, Stronglyloide ratti; mmu, Mus musculus (mouse); rno, Rattus norvegicus (rat); ocu, Oryctolagus cuniculus (rabbit); ssa, Salmo salar (Atlantic salmon); gga, Gallus gallus (chicken); xtr, Xenopus tropicalis (western clawed frog).
FIG 2.

Bioinformatic analysis of predicted miR-7 target genes. (A) Gene ontology analysis using Panther software showing enriched pathways for predicted miR-7 target genes. VEGF, vascular endothelial growth factor; PDGF, platelet-derived growth factor; MAPK, mitogen-activated protein kinase. (B) Panther overrepresentation test showing fractional-difference analysis to determine statistically significant pathways. *, P < 0.01; **, P < 0.001 (observed versus expected). Pathways with a P value of <0.001 are highlighted in red. (C) Protein-protein interaction analysis scheme of common predicted miR-7-5p selected target genes from highlighted pathways using String 9.1 software. (D) Predicted human target genes of miR-7 involved in insulin signaling, showing the number and type of binding sites and their conservation in mouse.
FIG 3.

Analysis of miR-7 targets involved in Alzheimer’s disease and the SREBP1 pathway. (A) Bioinformatic analysis of prominent miR-7 target genes involved in Alzheimer’s disease using GeneMania. Blue lines indicate pathway correlation, green lines indicate genetic interaction, and purple lines indicate coexpression. (B) Predicted human target genes of miR-7 involved in Alzheimer’s disease, showing the number of putative binding sites and conservation in mouse. (C) Human target genes of miR-7 involved in the SREBP1 pathway, showing the number of predicted binding sites and conservation in mouse. Analyses in panels B and C were performed using TargetScan 6.2.
FIG 4.

miR-7 regulates multiple genes involved in the insulin signaling pathway in neuronal cells. (A and B) qRT-PCR analysis of INSR, AKT, IRS-1, IRS-2, IGF1R, and IDE mRNA expression levels in N2a cells transfected with a control mimic (CM) or an miR-7-5p mimic (miR-7) (A) or a control inhibitor (CI) or an miR-7-5p inhibitor (Inh-miR-7) (B). Data are expressed as relative expression levels and correspond to the means ± SEM from three independent experiments performed in triplicate *, P < 0.05 (significantly different from cells transfected with a CM [normalized to a value of 1]). (C) Representative Western blots of predicted insulin pathway-related genes in N2a cells transfected with a CM or miR-7 (left) or a CI or Inh-miR-7 (right). Heat shock protein 90 (HSP90) was used as a loading control. (D to F, top) Human INSR, IRS-2, and IDE 3′-UTR sequences containing target sites for miR-7-5p. Underlined sequences indicate the miR-7 binding sites. Nucleotides highlighted in red indicate the point mutations in the miR-7 binding sites. (Bottom) Luciferase reporter activity in COS-7 cells transfected with the CM or miR-7 mimic and the INSR, IRS-2, and IDE 3′ UTRs (wild type [WT]) or the constructs containing the indicated point mutations (PM). Data are expressed as relative luciferase activities compared to the activity in control samples cotransfected with an equal concentration of the CM and correspond to the means ± SEM from three experiments performed in triplicate. *, P < 0.05 (significantly different from cells cotransfected with CM and the WT or PM 3′ UTR).
miR-7 impairs insulin signaling in neuronal cells.
Given that miR-7 regulates the expression of key elements in the insulin signaling cascade at the posttranscriptional level, we investigated the effects of miR-7 on downstream signaling upon insulin stimulation in neuronal cells. To this end, we transfected N2a cells with a control mimic (CM) and miR-7, and 48 h later, we treated them with insulin (100 nM) at different time points. As expected, AKT and glycogen synthase kinase 3β (GSK3β) were phosphorylated upon insulin treatment (Fig. 5A). Overexpression of miR-7 markedly reduced the phosphorylation of these proteins at each time point (Fig. 5A). Quantification analysis of the Western blots showed significant reductions in phosphorylated AKT (p-AKT) levels at all time points after insulin stimulation as well as in p-GSK3β levels except at time zero and 30 min after treatment (Fig. 5B). As expected, IDE and IRS-2 levels, used as positive controls for miR-7 overexpression, were also significantly reduced. These results suggest a possible role for miR-7 in promoting insulin resistance in neuronal cells.
FIG 5.

miR-7 regulates insulin signaling in N2a cells. (A) Representative Western blot analysis of IRS-2, IDE, p-AKT, AKT, p-GSK3β, and GSK3β in N2a cells transfected with the CM or miR-7 and treated with 100 nM insulin (Ins) at the indicated time points. IRS-2 and IDE were used as positive controls for the effect of miR-7 overexpression. HSP90 was used as a loading control. (B) Relative protein levels compared to HSP90 (IRS-2 and IDE) and p-AKT/total AKT ratio and p-GSK3β/total GSK3β ratio compared to HSP90. *, P < 0.05 (significantly different from cells transfected with the CM at each time point of insulin treatment). Data correspond to results from a representative experiment among three that gave similar results. A.U., arbitrary units.
miR-7-1 is synchronously induced with its host HNRNPK gene upon insulin stimulation and in vitro and in vivo.
A number of examples in the literature indicate that miRNAs are very often involved in either positive or negative regulatory feedback loops to fine-tune biological processes or specific signaling pathways. MicroRNAs can be regulated transcriptionally or at the posttranscriptional level, and intronic miRNAs are often cotranscribed with their host gene. Interestingly, recent studies have shown that the HRNRPK gene, where miR-7-1 is encoded, mediates insulin actions in mice (16). Therefore, we decided to explore whether insulin could influence HNRNPK and miR-7 expression in neuronal cells. To do this, we treated N2a cells with 100 nM insulin for 1, 3, 6, 12, and 24 h and then analyzed the expression of HNRNPK and miR-7. Our results showed that insulin increased HNRNPK mRNA and protein levels (Fig. 6A), and this induction correlated with significant increases in the precursor and mature forms of miR-7a-1 (Fig. 6B and C). These data suggest that both miR-7 and its host gene are cotranscribed in response to insulin stimulation in mouse neuronal cells. To further explore these results in an in vivo setting, we focused on the mouse hypothalamus, as it represents a key neuroendocrine tissue responsive to insulin and metabolic changes under fasting and feeding conditions and also expresses miR-7 abundantly. Next, we performed a series of experiments where we compared the hypothalamic expression levels of HNRNPK in mice starved for 16 h (low circulating insulin levels) and starved mice that were further intraperitoneally (i.p.) injected with glucose (to promote insulin secretion). Using this approach, we found that HNRNPK mRNA and protein levels of HNRNPK were induced after 1 h of glucose injection, compared with those in the hypothalamus of starved mice, consistent with its transcriptional regulation in response to insulin in the brain (Fig. 6D). Our Northern blot analysis showed that miR-7 levels are also upregulated in the hypothalamus under the same conditions (Fig. 6E). We next assessed the hypothalamic expression of miR-7 in streptozotocin (STZ)-treated mice, which mimics type 1 diabetes. Under these conditions, hypothalamic miR-7 levels were no longer induced after glucose injection in the absence of circulating insulin in STZ-treated mouse hypothalamus (Fig. 6F). Overall, these results indicate that both HNRNPK and miR-7 are cotranscribed in vivo upon insulin stimulation in the brain.
FIG 6.

Expression of miR-7/HNRNPK is regulated by insulin in vitro and in vivo. (A) qRT-PCR and Western blot analysis of HNRPK in N2a cells stimulated with 100 nM insulin at the indicated time points. (B and C) qRT-PCR analysis of precursor miR-7a-1 and mature miR-7 in N2a cells showing significant induction upon insulin stimulation. Data represent the means ± SEM of results from three experiments performed in triplicate. *, P < 0.05 (significantly different from cells treated with insulin at time zero). (D) qRT-PCR and Western blot analysis of HNRNPK in hypothalamus from fasted mice after 1 (F/G 1h) and 3 h (F/G 3h) of i.p. injection with 20 g/kg of body weight of glucose (n = 4 per group). (E) Northern blot analysis of miR-7 in hypothalamus from mice treated as described above for panel D (n = 4 per group). 5S rRNA was used as a loading control. Relative expression of miR-7/5S is expressed as a fold change compared to hypothalamus from fasted mice. (F, left) Northern blot analysis of miR-7 in hypothalamus from STZ-diabetic mice under fasting conditions after 0 and 1 h of i.p. injection with 20 g/kg of body weight of glucose. 5S rRNA was used as a loading control. Relative expression of miR-7/5S is expressed as a fold change compared to that in control hypothalamus (Fast). (Right) Initial glycemic levels before and at the end of the STZ treatment (n = 4 per group). *, P < 0.05 compared with initial glycemia.
miR-7-1 transcription is induced by SREBP1 in vitro and in vivo.
Based on our previous findings, we sought to explore the potential transcriptional signatures in the promoter region of miR-7’s host gene that may explain its regulation by insulin. Previous computational methods have identified several transcriptional start sites (TSSs) in the promoter site of HNRNPK. These correlate with epigenetic signatures, including CpG islands and H3K4Me3 histone marks, consistent with an open chromatin state and an active region of transcription. Using a combination of bioinformatics tools (Consite, Genomatix, and EDP), we identified several conserved SREBP1 binding sites (E-box elements) as well as a number of binding motifs for transcription factors involved in SREBP1 activation (Sp1 and Nfy) within the promoter region of human and mouse HNRNPK (Fig. 7). Notably, using chromatin immunoprecipitation combined with massively parallel sequencing (ChIP-seq), an SREBP1 binding site as well as two Sp1 sites and one Nfy site were previously identified in the adjacent active promoter region of human HNRNPK (17). As it has been reported that SREBP1c is the predominant isoform of SREBP1 upregulated in response to insulin, we hypothesized that it probably acts as a transcriptional regulator of HNRNPK and miR-7-1 expression. To analyze whether SREBP1 modulates HNRNPK expression and, consequently, miR-7 levels at the transcriptional level, we transfected N2a cells with a vector expressing FLAG-tagged nuclear SREBP1c (nSREBP1c) and measured HNRNPK and miR-7a-1 expression. The overexpression of nSREBP1c significantly increased the expression of HNRNPK (Fig. 8A), the precursor and mature forms of miR-7 (Fig. 8B), as well as SREBP1 and its target gene encoding fatty acid synthase (FASN) (Fig. 8C and D).
FIG 7.

HNRNPK promoter analysis shows conserved SREBP1 binding sites. (A) Schematic diagram of human HNRNPK gene loci showing the localization of miR-7. The active promoter of the HNRNPK region correlates with CpG islands (green) and enriched H3K4Me3 histone marks. ChIP-assayed transcription factors shown include SP1, SREBP1, and SREBP2 (highlighted in red). Data were compiled using the UCSC Genome Browser (NCBI36/hg18; http://genome.ucsc.edu). (B) Sequence alignment of the human and mouse HNRNPK promoters (minus strand) showing the localization of predicted Sp1 (orange, 85% confidence; purple, 90% confidence), E-box (green), and NFY (blue) binding sites found using Consite (http://consite.genereg.net/cgi-bin/consite) and Genomatix (http://www.genomatix.de). Transcription start sites (TSS) are highlighted in red. Genomic locations for human (NCBI36/hg18) and mouse (NCBI37/mm9) are provided at the top. scaRNA, small cajal RNAs; snoRNA, small nucleolar RNAs.
FIG 8.

SREBP1c regulates HNRNPK/miR-7 expression. (A) qRT-PCR analysis of HNRNPK in N2a cells transfected with a vector expressing nuclear SREBP1c or an empty vector. (B) qRT-PCR analysis of precursor miR-7a-1 and mature miR-7 in N2a cells treated as described above for panel A. (C) qRT-PCR analysis of fatty acid synthase (FAS) and SREBP1 in N2a cells treated as described above for panel A. Data represent relative expression and correspond to the means ± SEM from three independent experiments performed in triplicate. *, P < 0.05 compared with the empty vector. (D) Representative Western blot analysis of HNRNPK and FASN in cells treated as described above for panel A. HSP90 was used as a loading control. (E) qRT-PCR analysis of HNRNPK in N2a cells treated with the vehicle or T0901317 (3 μM) for 24 h. (F) qRT-PCR analysis of precursor miR-7a-1 and mature miR-7 in N2a cells treated as described above for panel E. (G) qRT-PCR analysis of ABCA1 and SREBP1c in N2a cells treated as described above for panel E. Data are expressed as relative expression levels and correspond to the means ± SEM from three independent experiments performed in triplicate. *, P < 0.05 (significantly different from cells treated with the vehicle [control] and normalized to a value of 1). (H) Representative Western blot analysis of HNRNPK and ABCA1 in N2a cells treated with the vehicle or T0901317 (3 μM) for 24 h. HSP90 was used as a loading control. (I) qRT-PCR analysis of HNRNPK in brains of mice fed the control diet or the LXR diet for 1 week. (J) qRT-PCR analysis of precursor miR-7a-1 and mature miR-7 as described above for panel I. (K) qRT-PCR analysis of ABCA1 and SREBP1c as described above for panel I. Data represent relative expression levels and correspond to the means ± SEM. *, P < 0.05 (significantly different compared with the control diet) (n = 3 per group). (L) Representative Western blot of HNRNPK and ABCA1 in brains from mice treated as described above for panel I.
In addition to insulin, liver X receptor (LXR), a master regulator of cholesterol and lipid homeostasis, is a well-known regulator of SREBP1c expression and its transcriptional activation. To determine the ability of LXR to mimic the effect of insulin and SREBP1c overexpression on miR-7 and HNRNPK, we treated mouse N2a cells with the synthetic LXR ligand T0901317 (T090) for 24 h and assessed their expression by qRT-PCR and Western blotting. LXR activation led to a significant induction of HNRNPK mRNA (Fig. 8E) and protein (Fig. 8H) and the precursor and mature forms of miR-7 (Fig. 8F) as well as the upregulation of its classic transcriptional targets, including ABCA1 and SREBP1 (Fig. 8G and H). To evaluate this hypothesis in vivo, we treated mice with an LXR diet or a control diet for seven consecutive days to further analyze the expression of miR-7 and HNRNPK in the brain. qRT-PCR experiments showed a significant induction of the LXR target genes encoding ABCA1 and SREBP1c in the brains of mice fed an LXR diet compared to a control diet (Fig. 8K). More importantly, the miR-7a-1 precursor and mature miR-7 (Fig. 8J), together with HNRNPK mRNA and protein (Fig. 8I and L), were also induced in the brain in response to LXR activation and SREBP1c induction in vivo, corroborating previous results obtained in mouse neuronal cells. Overall, these results suggest that SREBP1c could act as a potential transcriptional regulator of HNRNPK and its intronic miR-7 upon insulin stimulation and LXR activation in the brain.
miR-7 controls the expression of its host gene in an autoregulatory feedback loop.
Prediction analysis algorithms show that miR-7 could potentially regulate important members of the LXR pathway, including RXRβ and ABCA1 (Fig. 3B). In addition, a recent report demonstrated that miR-7 targets LXRβ (18). Therefore, we tested this in our mouse neuronal cell line by overexpressing miR-7 and assessing mRNA and protein levels. miR-7 significantly decreased the levels of ABCA1 and LXRβ mRNAs in N2a cells (Fig. 9A). Moreover, overexpression of miR-7 led to a decrease in the ABCA1 protein level both under basal conditions and during LXR activation with the synthetic agonist T090 (Fig. 9B). Based on our results, miR-7 blocks insulin and LXR signaling, two pathways that induce its expression through SREBP1c transcriptional regulation of HNRNPK. This led us to investigate whether miR-7 could work in a regulatory negative-feedback-loop manner to control its own levels by affecting HNRNPK expression. To test this hypothesis, we transfected N2a cells with a CM and miR-7 and analyzed HNRNPK mRNA and protein levels. Indeed, miR-7 transfection significantly reduced HNRNPK mRNA levels compared with those in CM-transfected cells. In another set of experiments, we transfected N2a cells with CM and miR-7, and 48 h before harvesting the cells, we treated them with T090 for 12 or 24 h. As shown in Fig. 9C, HNRNPK mRNA levels were reduced after miR-7 overexpression. Treatment with T090 induced HNRNPK protein expression (Fig. 9D). Notably, overexpression of miR-7 significantly impaired the induction of HNRNPK at each time point of T090 treatment (Fig. 9D). Overall, these results indicate that miR-7 plays a role in the LXR signaling pathway and that it works in a regulatory negative-feedback loop by controlling the levels of its host gene.
FIG 9.

miR-7 targets the LXR pathway and controls the expression of its host gene encoding HNRNPK. (A) qRT-PCR analysis of ABCA1 and LXRβ mRNA expression levels in N2a cells transfected with a control mimic (CM) or an miR-7-5p mimic (miR-7). Data are expressed as relative expression levels and correspond to the means ± SEM from three independent experiments performed in triplicate. *, P < 0.05 (significantly different from cells transfected with the CM [normalized to a value of 1]). (B) Representative Western blot analysis of ABCA1 in N2a cells transfected with the CM or miR-7 and treated with the vehicle or with T0901317 for 24 h. (C) qRT-PCR analysis of HNRNPK mRNA expression levels in N2a cells transfected with a CM or an miR-7-5p mimic (miR-7). Data are expressed as relative expression levels and correspond to the means ± SEM from 3 independent experiments performed in triplicate. *, P < 0.05 (significantly different from cells transfected with CM [normalized to a value of 1]). (D, left) Representative Western blot of HNRNPK in N2a cells transfected with the CM or miR-7-5p for 48 h and treated with the vehicle or T0901317 (3 μM) for 12 and 24 h. HSP90 was used as a loading control. (Right) Relative HNRNPK/HSP90 levels from three independent experiments. *, P < 0.05 (significantly different from cells transfected with CM at each time point of T090 treatment); #, P < 0.01 (significantly different from cells transfected with the CM at time zero of T090 treatment).
Brain miR-7-1 expression is altered during obesity and Alzheimer’s disease.
Given the regulation of miR-7 expression by insulin and LXR, as well as its ability to block these two neuroprotective pathways, we could anticipate that overstimulation of miR-7 during hyperinsulinemic or hypercholesterolemic states associated with obesity or diabetes could have deleterious effects on the brain. Therefore, we decided to analyze the levels of miR-7 in the brains of obese mice and mice fed a high-cholesterol diet. Our results showed that miR-7 expression is significantly elevated in the brain of diet-induced obese (DIO) mice compared to those in mice fed a control diet (Fig. 10A). Similar results were observed in mice fed a high cholesterol diet (Fig. 10B). In addition to insulin resistance, dysregulation of cholesterol metabolism and the LXR signaling pathway are associated with an increased risk of AD. Specifically, the expression and function of ABCA1 and ApoE lipidation are strongly linked to amyloidosis, a key pathological hallmark leading to the progression AD. As indicated above, miR-7 targets key genes involved in AD, including the IDE, APP, BACE1, PSEN1, ABCA1, and LXRβ genes (Fig. 3). Notably, our results show that overexpression of miR-7 not only downregulates LXRβ and ABCA1 expression (Fig. 9A and B) but also increases the levels of extracellular Aβ in neuronal cells and impairs the clearance of extracellular Aβ by microglial cells (Fig. 10C and D). Based on these results, we next decided to compare miR-7 levels in brain samples from healthy subjects to those in brain samples from AD patients. We found that the expression of miR-7 is significantly elevated in the cortex of AD patients compared with that in control healthy human subjects, while the expression of its target genes encoding IRS-2 and IDE is downregulated in AD brains (Fig. 10E and F). These data, together with our above-described in vitro results, support the hypothesis that miR-7 acts as a dual negative regulator of insulin and LXR actions in the brain and, potentially, Aβ metabolism during the progression of AD. Therefore, miR-7 could represent a potential therapeutic target for the treatment of insulin resistance and neurodegeneration-associated diseases such as AD.
FIG 10.

miR-7 levels are elevated in brains of obese mice (hypothalamus) and in Alzheimer’s disease patients. (A) qRT-PCR analysis of pre-miR-7a-1 and mature miR-7-5p in the hypothalamus of mice fed a chow diet (CD) or DIO mice (n = 5 per group). *, P < 0.05 compared with CD mice. (B) qRT-PCR analysis of pre-miR-7a-1 and mature miR-7-5p in the hypothalamus of mice fed a chow diet (CD) or a HFD (n = 5 per group). (C and D, top) Representative Western blot analysis measuring levels of Aβ in the media of N2a-APPsw (C) and BV-2 (D) cells after transfection with a CM or miR-7. (Bottom) Relative Aβ levels corresponding to the means ± SEM from two independent experiments performed in triplicate. *, P < 0.05 (significantly different from cells transfected with the CM [normalized to a value of 1]). (E) qRT-PCR analysis of mature miR-7-5p in human cortex and cerebellum from human AD patients and matching healthy human subjects (n = 5 per group). *, P < 0.05 compared with control healthy subjects. (F) qRT-PCR analysis of IRS-2 and IDE in cortex from human AD patients and matching healthy human subjects (n = 5 per group). *, P < 0.05 compared with control healthy subjects.
DISCUSSION
Extensive preclinical and clinical evidence supports a pathophysiological connection between Alzheimer’s disease (AD) and diabetes (1, 19, 20). Due to the strong correlation between brain insulin resistance (IR) and the pathogenesis of AD, AD has been proposed as “type 3” diabetes (21, 22). Yet the molecular mechanism underlying this relation is still elusive. MicroRNAs have been shown to play a major role in the regulation of metabolism, primarily in peripheral tissues (23). The brain expresses more distinct and the largest number of miRNAs than any other tissue in vertebrates (24), and they are involved in a plethora of physiological functions, in neuronal differentiation, and in pathological states, such as the development of brain tumors and neurodegeneration. Here, we describe a novel role of miR-7, a microRNA enriched in the brain, in regulating important insulin and LXR signaling components, two main neuroprotective pathways that can influence IR as well as Aβ metabolism, thus representing a novel common regulator linking brain insulin resistance and AD at the posttranscriptional level. Among the possible mechanisms underlying the connection between both diseases, IR and amyloidosis are prominent and closely related (25). Our data show that miR-7 regulates the expression of not only INSR and IRS-2, inhibiting the downstream insulin signaling cascade in neuronal cells, but also IDE, LXRβ, and ABCA1, involved in Aβ metabolism. The LXR signaling pathway plays an important role in Aβ plaque biogenesis. Loss of LXRs increases Aβ plaque burden in the APP/PS1 mouse (26–29). ABCA1, one of the most studied transcriptional targets of LXR, affects the lipidation status of ApoE in the brain, which in turn may facilitate the proteolytic degradation of Aβ (30). Indeed, we and others have shown that microRNAs that affect ABCA1, such as miR-33 and miR-106, play a key role in AD pathology (11, 31). Therefore, it is possible that increased Aβ levels in neuronal cells and impairment of uptake by microglial cells after miR-7 overexpression could be mediated through the posttranscriptional regulation of this pathway. Nevertheless, several remarkable characteristics distinguish miR-7 as a unique miRNA in the context of the possible underlying molecular coregulation of brain IR and AD. miR-7 is a highly abundant microRNA in the brain, and intriguingly, it targets key genes involved in IR and AD. In this regard, it is generally accepted that miRNAs with biological significance usually target entire pathways rather than a single mRNA involved in a biological function. Another important miR-7 target is IDE, a strong candidate for involvement in late-onset AD (32) which represents a common molecular link between IR and AD. Indeed, IDE expression, which has been shown to influence Aβ levels in vitro and in vivo (33), is also impaired in brains from AD patients and in Tg2576 transgenic mice and correlates with the accumulation of Aβ during the progression of the disease. In this line, it is possible that our findings of elevated miR-7 levels in the brains of AD patients compared with those in healthy subjects could account for this effect as well as for the reduced levels of its target IRS-2 mRNA during the progression of AD (22). Moreover, we also found that levels of miR-7 are altered in brains of obese mice fed a high-cholesterol diet and of DIO mice; this correlates with increased brain insulin signaling previously described in this animal model as well as in ob/ob mice and in monkeys with long-standing diet-induced type 2 diabetes mellitus (T2DM) (34). Several studies suggest that the brain is initially hyperinsulinized in insulin-resistant states of obesity, metabolic syndrome, and T2DM and that with the development and progression of AD pathology, the brain may secondarily become insulin resistant. In this context, we found that miR-7 is induced by insulin and LXR, both in vitro and in vivo, and this effect is abolished when systemic insulin levels are compromised in an STZ-induced model of type 1 diabetes mellitus (T1DM).
Our data indicate that miR-7-1a, encoded in intron 17 of the mouse HNRNPK gene, is cotranscribed with the host gene, which is a common mechanism for intronic miRNAs (9, 35, 36). Although we cannot exclude additional regulation, the HNRNPK promoter contains several conserved E-box sequence motifs and consensus sequences for the well-known SREBP1 coregulator NFY and the insulin transducer transcription factor SP1. These results, together with the data showing an increase in miR-7 with the host gene upon overexpression of an active SREBP1c form in neuronal cells, suggest a possible SREBP1c-mediated transcriptional mechanism of HNRNPK/miR-7 through insulin/LXR pathways. Further analyses are necessary to explore the potential direct transcriptional activation of HNRNPK/miR-7 by LXR. In this regard, activation of LXR drives cholesterol efflux through ABCA1/ABCG1 transcriptional regulation. This effect could lead to cellular cholesterol depletion and indirect activation of SREBP2. Indeed, data compiled using the UCSC Genome Browser shows ChIP-assayed binding for this transcription factor, which suggests a possibly more complex scenario for the regulation of HNRNPK/miR-7. After LXR agonist or insulin stimulation, the levels of miR-7-1 are increased, and it inhibits a number of insulin and LXR pathway components, including INSR, IRS-2, AKT, LXRβ, RXRβ, and possibly other potential downstream targets, such as the SREBP1 coregulators NFY and SP1 (Fig. 11). This negative autoregulatory feedback loop was later corroborated when LXR-dependent stimulation of HNRNPK, which lacks miR-7’s binding sites in its 3′ UTR, was inhibited by miR-7 overexpression in N2a cells. Multiple examples in the literature have shown that intronic miRNAs involved in autoregulatory mechanisms fine-tune metabolic pathways by directly or indirectly regulating their host gene. Negative-feedback regulation by direct targeting of host genes has been described for miR-126 (37) and miR-128b (38), among others. On the other hand, studies indicate that miR-33a and -b, encoded by Srebp2 and Srebp1, respectively, are cotranscribed with their host genes and regulate cellular cholesterol levels and insulin signaling, which in turn dictate Srebp2 and Srebp1 expression and activity, thus controlling their own expression (23). In the context of our study, it is conceivable that overproduction of miR-7 during states of metabolic dysregulation, as in hyperinsulinized brains during obesity, metabolic syndrome, and T2DM (34), could ameliorate the neuroprotective actions of insulin and LXR in the brain, promoting later IR and amyloidosis, thus representing a molecular link between insulin resistance and AD at the posttranscriptional level. Therefore, our work depicts miR-7 as a potential therapeutic target for the treatment of insulin resistance and associated neurodegenerative diseases such as AD.
FIG 11.
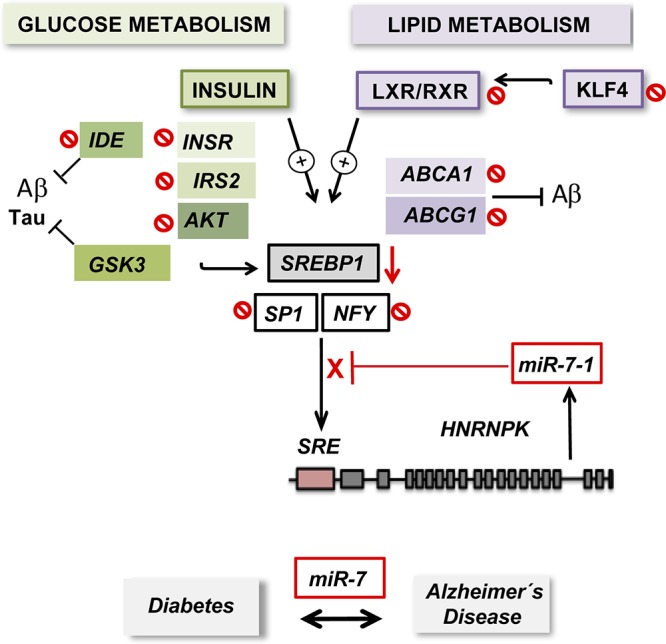
Schematic showing the proposed mechanism of action and regulation of HNRNPK/miR-7. Upon insulin signaling or LXR activation, induced SREBP1c can form a transcriptional complex with Sp1 and NFY and binds to sterol regulatory elements (SREs) in the promoter region of HNRNPK, leading to its transcriptional activation. miR-7-1, encoded in intron 16 of the human HNRNPK gene, is cotranscribed with the host gene and targets a number of insulin signaling and LXR pathway components, regulating its own expression in a negative-feedback loop. By affecting both LXR and insulin signaling genes, altered levels of miR-7 during states of metabolic dysregulation could ameliorate neuroprotective actions of insulin and LXR in the brain, thus representing a possible molecular link between insulin resistance and AD at the posttranscriptional level.
MATERIALS AND METHODS
All chemicals were obtained from Sigma unless otherwise noted. The pcDNA3.1-2×FLAG-SREBP1c vector and the empty control vector were obtained from Addgene.
Cell culture and treatments.
The mouse neuroblastoma N2a cell line and BV-2 microglial cells, obtained from the American Type Culture Collection, were maintained in Dulbecco’s modified Eagle medium (DMEM) supplemented with 10% fetal bovine serum (FBS), 2% penicillin-streptomycin, and l-glutamine in 10-cm2 dishes at 37°C with 5% CO2. N2a cells are a fast-growing neuroblastoma cell line from mouse that has been widely used to study neurotoxicity, metabolism, miRNAs, and Alzheimer’s disease (11). For some experiments, cells were treated with 100 nM insulin at different time points or T0901317 at 3 μM for 12 and 24 h.
Bioinformatic analysis of miRNA target genes.
Predicted target genes for miR-7 were identified using TargetScan 6.2. Putative targets were uploaded into the Panther v8.0 gene classification system (http://www.pantherdb.org) to analyze pathway enrichment. Genes within the significantly enriched pathway were uploaded to String v9.05 (http://string-db.org), and String interactions and GeneMania software were used to represent networks of predicted targets involved in Alzheimer’s disease (https://genemania.org).
Transfection of miRNA mimics and miRNA inhibitors.
Cells (∼70% confluence) were transfected with 40 nM the miRIDIAN miRNA mimic (miR-7-5p) or with 60 nM the miRIDIAN miRNA inhibitor (Inh-miR-7-5p) (Dharmacon) by utilizing Lipofectamine RNAiMax (Invitrogen) and studied 48 h later. In all experiments, an equal concentration of a nontargeting control mimic (CM) sequence or an inhibitor negative control sequence was used as a control for non-sequence-specific effects in miRNA experiments. Verification of miR-7 overexpression and knockdown was performed using quantitative PCR (qPCR) as described below.
3′-UTR luciferase reporter assays.
cDNA fragments corresponding to the 3′ UTRs of the human INSR, IRS-2, and IDE genes were amplified by reverse transcription-PCR from genomic DNA with XhoI and NotI linkers. The PCR products were directionally cloned downstream of the Renilla luciferase open reading frame in the psiCHECK2 vector (Promega), which also contains a constitutively expressed firefly luciferase gene, which is used to normalize transfections. Site-directed mutations in the seed region of predicted miR-7 sites within the 3′ UTRs were generated using a QuikChange multisite-directed mutagenesis kit (Agilent) according to the manufacturer’s protocol. All constructs were confirmed by sequencing. COS-7 cells were plated into 12-well plates and cotransfected with 1 μg of the indicated 3′-UTR luciferase reporter vectors and the miR-7-5p mimic or negative-control mimic (Dharmacon), using Lipofectamine RNAiMax (Invitrogen). Luciferase activity was measured using the Dual-Glo luciferase assay system (Promega). Renilla luciferase activity was normalized to the corresponding firefly luciferase activity and plotted as a percentage of the control (CM). Experiments were performed in triplicate at least three times.
RNA isolation and quantitative real-time PCR.
Total RNA from cells and mouse tissues was isolated using TRIzol reagent (Invitrogen) according to the manufacturer’s protocol. For mRNA quantification, 1 μg of total RNA was reverse transcribed to cDNA using iScript RT supermix (Bio-Rad), according to the manufacturer’s protocol. Quantitative real-time PCR was performed in triplicate using iQ SYBR green supermix (Bio-Rad) on a real-time detection system (Eppendorf). The mRNA level was normalized to the level of 18S rRNA as a housekeeping gene. Primer sequences are available upon request. For miRNA quantification, total RNA was reverse transcribed using the miScript II RT kit (Qiagen). Primers specific for mouse precursor miRNAs (pre-miR-7) and mature miR-7-5p (Qiagen) were used, and values were normalized to the levels of SNORD68 mRNA, as a housekeeping gene.
Western blot analysis.
Cells were lysed in ice-cold buffer containing 50 mM Tris-HCl (pH 7.4), 0.1 mM EDTA, 0.1 mM EGTA, 1% NP-40, 0.1% sodium deoxycholate, 0.1% SDS, 100 mM NaCl, 10 mM NaF, 1 mM sodium pyrophosphate, 1 mM sodium orthovanadate, 1 mM Pefabloc, and 2 mg/ml protease inhibitor cocktail (Roche Diagnostics Corp.). Protein concentrations were determined using the DC protein assay kit (Bio-Rad Laboratories). Cell lysates containing 12.5 to 25 μg of protein were analyzed by SDS-PAGE and immunoblotting. Primary antibodies used included antibodies to HNRNPK (catalog number 4675; Cell Signaling), INSR (catalog number NBP1-19192), IDE (catalog number ab32216; Cell Signaling), IRS-1 (catalog number NB-10082001; Novus Biologicals), IRS-2 (catalog number A301-433A; Bethyl), IGF1R (catalog number 3027S; Cell Signaling), GSK3β (catalog number 9315S; Cell Signaling), p-GSK3β (catalog number 9322S; Cell Signaling), AKT (catalog number 9272; Cell Signaling), p-AKT (catalog number 9277; Cell Signaling), ABCA1 (catalog number ab18180; Abcam), anti-Aβ antibody (catalog number 82E1; IBL International), FASN (catalog number ab22759; Abcam), and heat shock protein 90 (HSP90) (catalog number 610419; BD Bioscience). Secondary antibodies were fluorescence-labeled antibodies, and bands were visualized using the Odyssey infrared imaging system (Li-Cor Biotechnology). Densitometry analysis of the Western blots was carried out by using ImageJ software from the NIH (http://rsbweb.nih.gov/ij/).
Northern blot analysis.
Total RNA (10 μg) of mouse tissues was resolved in a 15% polyacrylamide gel and blotted onto a Hybond-N+ nylon membrane (Amersham Biosciences). miRCURY LNA detection probe DNA oligonucleotides for hsa-miR-7-5p were purchased from Exiqon. The oligonucleotide sequence 5′-ACAACAAAATCACTAGTCTTCC-3′, which is complementary to the mature miRNA, was end labeled with [α-32P]ATP and T4 polynucleotide kinase (New England Biolabs) to generate high-specific-activity probes. The oligonucleotide sequence for 5S rRNA was 5′-CAGGCCCGACCCTGCTTAGCTTCCGAGATCAGACGAGAT-3′. Hybridization was carried out according to the Express Hyb (Bio-Rad) protocol. Probes were washed twice for 10 min at 25°C in 4× SSC (1× SSC is 0.15 M NaCl plus 0.015 M sodium citrate)–0.5% SDS.
Mouse studies.
Eight-week-old male C57BL/6 mice were purchased from Jackson Laboratories (Bar Harbor, ME) and kept under constant temperature and humidity in a 12-h controlled dark/light cycle. All animal experiments were approved by the Institutional Animal Care and Use Committee of the Yale University School of Medicine. For high-fat diet (HFD) studies, 8-week-old male mice (n = 5 per group) were placed on a chow diet or a HFD (Western diet, 1.25% cholesterol, catalog number D12103C; Research Diets) for 12 weeks. For DIO studies, 8-week-old male wild-type (WT) mice (n = 5 per group) were fed a chow diet or a 60% fat diet (catalog number D12492; Research Diets) for 10 weeks. For the type 1 diabetes model, 8-week-old male WT mice (n = 4 per group) were treated with a daily intraperitoneal (i.p.) injection (200 μg/g of body weight) of STZ for seven consecutive days. Glucose levels were monitored using a OneTouch Ultra glucometer (LifeScan Canada Ltd.). For some experiments, 8-week-old male WT mice (n = 4 per group) were fasted for 16 h and injected i.p. with glucose (2 g/kg of body weight). Brain tissues were dissected 0, 1, and 3 h after the injection. For LXR activation in vivo, 8-week-old male WT mice (n = 3 per group) were fed a control standard diet (15 kcal% fat, catalog number D11112201; Research Diets) or an LXR-enriched diet (standard diet plus 3,212.5 mg of T0901317/kg diet, catalog number D16113001; Research Diets) for seven consecutive days. After the treatments or diet periods, mice were sacrificed, and brain tissue samples were dissected and stored at −80°C until processing for protein or gene expression analysis.
Aβ secretion assay.
N2a-APPsw cells were plated at a density of 2.5 × 10⁵ cells/well in a 12-well plate 1 day before transfection. N2a-APPsw cells were transfected with synthetic miR-7 or the negative control (Insight Genomics) using Lipofectamine RNAiMax (Invitrogen). Forty-eight hours after transfection, media were changed to Opti-MEM-I (Invitrogen). Six hours after the medium change, the cells and media were collected for Western blot analysis. For Aβ detection, the same volumes of media were run on a 16.5% Tris-Tricine gel (Bio-Rad) as previously described (39). All experiments were performed in triplicate and repeated independently twice.
Aβ clearance assay.
BV2 cells were plated at a density of 5 × 10⁵ cells/well in a 12-well plate. BV2 cells were transfected with miR-7 or a negative control (Insight Genomics) using Lipofectamine RNAiMax (Invitrogen). Twenty-four hours after transfection, cells were incubated in fresh DMEM–N2–1 mM sodium pyruvate medium containing 40 nM synthetic Aβ40 for 24 h, and the remaining Aβ levels were then analyzed by Western blotting using culture medium. Aβ levels were normalized by total protein levels. All experiments were performed in triplicate and repeated independently twice.
Human brain samples.
Postmortem human brains (area 9) without any severe neurological and psychological disorders and brains with severe dementia of the Alzheimer type were obtained from autopsies performed at the University of Kentucky (Peter T. Nelson). The postmortem interval (PMI) range was between 1 and 4 h. The different cases are described in Table 1. The experiments were undertaken with the approval of the Ethics Committee of the University of Kentucky.
TABLE 1.
Characteristics of postmortem human brain samplesa
| Sample ID | Age of patient (yr) | Sex of patient | Braak stage | PMI (h) |
|---|---|---|---|---|
| Ctl1 | 92 | Female | 1 | 1.33 |
| Ctl2 | 81 | Male | 2 | 2.83 |
| Ctl3 | 78 | Male | 2 | 1.17 |
| Ctl4 | 79 | Female | 1 | 1.75 |
| Ctl5 | 85 | Female | 0 | 2.5 |
| Ctl6 | 87 | Female | 0 | 2.5 |
| AD1 | 79 | Female | 6 | 3 |
| AD2 | 93 | Female | 5 | 2 |
| AD3 | 85 | Male | 6 | 2.75 |
| AD4 | 79 | Male | 6 | 3.5 |
| AD5 | 83 | Female | 6 | 3.5 |
| AD6 | 77 | Female | 5 | 3 |
| AD7 | 80 | Female | 6 | 4 |
Brain samples were obtained from area 9.
Statistical analysis.
In vitro experiments were routinely repeated at least three times unless otherwise noted. Data are expressed as means ± standard errors of the means (SEM) unless otherwise indicated. Statistical differences were measured using unpaired two-sided Student’s t test, one-way analysis of variance (ANOVA) with Bonferroni correction for multiple comparisons, or a log rank test when appropriate. Normality was checked using the Kolmogorov-Smirnov test. A nonparametric test (Mann-Whitney) was used when data did not pass the normality test. A P value of ≤0.05 was considered statistically significant. Data analysis was performed using Prism software version 7 (GraphPad, San Diego, CA).
ACKNOWLEDGMENTS
This work was supported by grants from the National Institutes of Health (R35HL135820 to C.F.-H.) and the American Heart Association (James and Donna Dickenson-Sublett Award for the Advancement of Cardiovascular Research, SDG23000025, to C.M.R.), the Convocatoria de Atracción de Talento (Modalidad 1) from the Comunidad de Madrid, Spain (reference number 2017T1/BMD5333 to C.M.R.), the Foundation Leducq Transatlantic Network of Excellence in Cardiovascular Research MIRVAD (to C.F.-H.), and NIH awards R01AG054102, R01AG053500, R01AG053242, and R21AG050804 (to J.K.), AG028383 (Peter T. Nelson), and NS085830 (Peter T. Nelson).
We thank Peter T. Nelson, who contributed the brain tissues. We thank Santiago Lamas for his help in providing mice and reagents.
REFERENCES
- 1.Biessels GJ, Staekenborg S, Brunner E, Brayne C, Scheltens P. 2006. Risk of dementia in diabetes mellitus: a systematic review. Lancet Neurol 5:64–74. doi: 10.1016/S1474-4422(05)70284-2. [DOI] [PubMed] [Google Scholar]
- 2.Talbot K, Wang HY, Kazi H, Han LY, Bakshi KP, Stucky A, Fuino RL, Kawaguchi KR, Samoyedny AJ, Wilson RS, Arvanitakis Z, Schneider JA, Wolf BA, Bennett DA, Trojanowski JQ, Arnold SE. 2012. Demonstrated brain insulin resistance in Alzheimer’s disease patients is associated with IGF-1 resistance, IRS-1 dysregulation, and cognitive decline. J Clin Invest 122:1316–1338. doi: 10.1172/JCI59903. [DOI] [PMC free article] [PubMed] [Google Scholar]
- 3.Craft S, Baker LD, Montine TJ, Minoshima S, Watson GS, Claxton A, Arbuckle M, Callaghan M, Tsai E, Plymate SR, Green PS, Leverenz J, Cross D, Gerton B. 2012. Intranasal insulin therapy for Alzheimer disease and amnestic mild cognitive impairment: a pilot clinical trial. Arch Neurol 69:29–38. doi: 10.1001/archneurol.2011.233. [DOI] [PMC free article] [PubMed] [Google Scholar]
- 4.Ambros V. 2004. The functions of animal microRNAs. Nature 431:350–355. doi: 10.1038/nature02871. [DOI] [PubMed] [Google Scholar]
- 5.Bartel DP. 2009. MicroRNAs: target recognition and regulatory functions. Cell 136:215–233. doi: 10.1016/j.cell.2009.01.002. [DOI] [PMC free article] [PubMed] [Google Scholar]
- 6.Price NL, Ramirez CM, Fernandez-Hernando C. 2014. Relevance of microRNA in metabolic diseases. Crit Rev Clin Lab Sci 51:305–320. doi: 10.3109/10408363.2014.937522. [DOI] [PubMed] [Google Scholar]
- 7.Ramirez CM, Dávalos A, Goedeke L, Salerno AG, Warrier N, Cirera-Salinas D, Suárez Y, Fernández-Hernando C. 2011. MicroRNA-758 regulates cholesterol efflux through posttranscriptional repression of ATP-binding cassette transporter A1. Arterioscler Thromb Vasc Biol 31:2707–2714. doi: 10.1161/ATVBAHA.111.232066. [DOI] [PMC free article] [PubMed] [Google Scholar]
- 8.Ramírez CM, Goedeke L, Rotllan N, Yoon J-H, Cirera-Salinas D, Mattison JA, Suárez Y, de Cabo R, Gorospe M, Fernández-Hernando C. 2013. MicroRNA 33 regulates glucose metabolism. Mol Cell Biol 33:2891–2902. doi: 10.1128/MCB.00016-13. [DOI] [PMC free article] [PubMed] [Google Scholar]
- 9.Rayner KJ, Suarez Y, Davalos A, Parathath S, Fitzgerald ML, Tamehiro N, Fisher EA, Moore KJ, Fernandez-Hernando C. 2010. miR-33 contributes to the regulation of cholesterol homeostasis. Science 328:1570–1573. doi: 10.1126/science.1189862. [DOI] [PMC free article] [PubMed] [Google Scholar]
- 10.Bedse G, Di Domenico F, Serviddio G, Cassano T. 2015. Aberrant insulin signaling in Alzheimer’s disease: current knowledge. Front Neurosci 9:204. doi: 10.3389/fnins.2015.00204. [DOI] [PMC free article] [PubMed] [Google Scholar]
- 11.Kim J, Yoon H, Ramirez CM, Lee SM, Hoe HS, Fernandez-Hernando C, Kim J. 2012. miR-106b impairs cholesterol efflux and increases Abeta levels by repressing ABCA1 expression. Exp Neurol 235:476–483. doi: 10.1016/j.expneurol.2011.11.010. [DOI] [PMC free article] [PubMed] [Google Scholar]
- 12.Latreille M, Hausser J, Stutzer I, Zhang Q, Hastoy B, Gargani S, Kerr-Conte J, Pattou F, Zavolan M, Esguerra JL, Eliasson L, Rulicke T, Rorsman P, Stoffel M. 2014. MicroRNA-7a regulates pancreatic beta cell function. J Clin Invest 124:2722–2735. doi: 10.1172/JCI73066. [DOI] [PMC free article] [PubMed] [Google Scholar]
- 13.López-Beas J, Capilla-González V, Aguilera Y, Mellado N, Lachaud CC, Martín F, Smani T, Soria B, Hmadcha A. 2018. miR-7 modulates hESC differentiation into insulin-producing beta-like cells and contributes to cell maturation. Mol Ther Nucleic Acids 12:463–477. doi: 10.1016/j.omtn.2018.06.002. [DOI] [PMC free article] [PubMed] [Google Scholar]
- 14.Choudhury NR, de Lima Alves F, de Andrés-Aguayo L, Graf T, Cáceres JF, Rappsilber J, Michlewski G. 2013. Tissue-specific control of brain-enriched miR-7 biogenesis. Genes Dev 27:24–38. doi: 10.1101/gad.199190.112. [DOI] [PMC free article] [PubMed] [Google Scholar]
- 15.Memczak S, Jens M, Elefsinioti A, Torti F, Krueger J, Rybak A, Maier L, Mackowiak SD, Gregersen LH, Munschauer M, Loewer A, Ziebold U, Landthaler M, Kocks C, le Noble F, Rajewsky N. 2013. Circular RNAs are a large class of animal RNAs with regulatory potency. Nature 495:333–338. doi: 10.1038/nature11928. [DOI] [PubMed] [Google Scholar]
- 16.Ghosh A, Abdo S, Zhao S, Wu C-H, Shi Y, Lo C-S, Chenier I, Alquier T, Filep JG, Ingelfinger JR, Zhang S-L, Chan JSD. 2017. Insulin inhibits Nrf2 gene expression via heterogeneous nuclear ribonucleoprotein F/K in diabetic mice. Endocrinology 158:903–919. doi: 10.1210/en.2016-1576. [DOI] [PMC free article] [PubMed] [Google Scholar]
- 17.Kent WJ, Sugnet CW, Furey TS, Roskin KM, Pringle TH, Zahler AM, Haussler D. 2002. The human genome browser at UCSC. Genome Res 12:996–1006. doi: 10.1101/gr.229102. [DOI] [PMC free article] [PubMed] [Google Scholar]
- 18.Singaravelu R, Quan C, Powdrill MH, Shaw TA, Srinivasan P, Lyn RK, Alonzi RC, Jones DM, Filip R, Russell RS, Pezacki JP. 2018. MicroRNA-7 mediates cross-talk between metabolic signaling pathways in the liver. Sci Rep 8:361. doi: 10.1038/s41598-017-18529-x. [DOI] [PMC free article] [PubMed] [Google Scholar]
- 19.Janson J, Laedtke T, Parisi JE, O’Brien P, Petersen RC, Butler PC. 2004. Increased risk of type 2 diabetes in Alzheimer disease. Diabetes 53:474–481. doi: 10.2337/diabetes.53.2.474. [DOI] [PubMed] [Google Scholar]
- 20.Sims-Robinson C, Kim B, Rosko A, Feldman EL. 2010. How does diabetes accelerate Alzheimer disease pathology? Nat Rev Neurol 6:551–559. doi: 10.1038/nrneurol.2010.130. [DOI] [PMC free article] [PubMed] [Google Scholar]
- 21.de la Monte SM. 2014. Type 3 diabetes is sporadic Alzheimers disease: mini-review. Eur Neuropsychopharmacol 24:1954–1960. doi: 10.1016/j.euroneuro.2014.06.008. [DOI] [PMC free article] [PubMed] [Google Scholar]
- 22.Steen E, Terry BM, Rivera EJ, Cannon JL, Neely TR, Tavares R, Xu XJ, Wands JR, de la Monte SM. 2005. Impaired insulin and insulin-like growth factor expression and signaling mechanisms in Alzheimer’s disease—is this type 3 diabetes? J Alzheimers Dis 7:63–80. doi: 10.3233/JAD-2005-7107. [DOI] [PubMed] [Google Scholar]
- 23.Fernández-Hernando C, Ramírez CM, Goedeke L, Suárez Y. 2013. MicroRNAs in metabolic disease. Arterioscler Thromb Vasc Biol 33:178–185. doi: 10.1161/ATVBAHA.112.300144. [DOI] [PMC free article] [PubMed] [Google Scholar]
- 24.Fineberg SK, Kosik KS, Davidson BL. 2009. MicroRNAs potentiate neural development. Neuron 64:303–309. doi: 10.1016/j.neuron.2009.10.020. [DOI] [PubMed] [Google Scholar]
- 25.Devi L, Alldred MJ, Ginsberg SD, Ohno M. 2012. Mechanisms underlying insulin deficiency-induced acceleration of beta-amyloidosis in a mouse model of Alzheimer’s disease. PLoS One 7:e32792. doi: 10.1371/journal.pone.0032792. [DOI] [PMC free article] [PubMed] [Google Scholar]
- 26.Burns MP, Vardanian L, Pajoohesh-Ganji A, Wang L, Cooper M, Harris DC, Duff K, Rebeck GW. 2006. The effects of ABCA1 on cholesterol efflux and Abeta levels in vitro and in vivo. J Neurochem 98:792–800. doi: 10.1111/j.1471-4159.2006.03925.x. [DOI] [PubMed] [Google Scholar]
- 27.Riddell DR, Zhou H, Comery TA, Kouranova E, Lo CF, Warwick HK, Ring RH, Kirksey Y, Aschmies S, Xu J, Kubek K, Hirst WD, Gonzales C, Chen Y, Murphy E, Leonard S, Vasylyev D, Oganesian A, Martone RL, Pangalos MN, Reinhart PH, Jacobsen JS. 2007. The LXR agonist TO901317 selectively lowers hippocampal Abeta42 and improves memory in the Tg2576 mouse model of Alzheimer’s disease. Mol Cell Neurosci 34:621–628. doi: 10.1016/j.mcn.2007.01.011. [DOI] [PubMed] [Google Scholar]
- 28.Vanmierlo T, Rutten K, Dederen J, Bloks VW, van Vark-van der Zee LC, Kuipers F, Kiliaan A, Blokland A, Sijbrands EJG, Steinbusch H, Prickaerts J, Lütjohann D, Mulder M. 2011. Liver X receptor activation restores memory in aged AD mice without reducing amyloid. Neurobiol Aging 32:1262–1272. doi: 10.1016/j.neurobiolaging.2009.07.005. [DOI] [PubMed] [Google Scholar]
- 29.Zelcer N, Tontonoz P. 2006. Liver X receptors as integrators of metabolic and inflammatory signaling. J Clin Invest 116:607–614. doi: 10.1172/JCI27883. [DOI] [PMC free article] [PubMed] [Google Scholar]
- 30.Wahrle SE, Jiang H, Parsadanian M, Kim J, Li A, Knoten A, Jain S, Hirsch-Reinshagen V, Wellington CL, Bales KR, Paul SM, Holtzman DM. 2008. Overexpression of ABCA1 reduces amyloid deposition in the PDAPP mouse model of Alzheimer disease. J Clin Invest 118:671–682. doi: 10.1172/JCI33622. [DOI] [PMC free article] [PubMed] [Google Scholar]
- 31.Kim J, Yoon H, Horie T, Burchett JM, Restivo JL, Rotllan N, Ramirez CM, Verghese PB, Ihara M, Hoe HS, Esau C, Fernandez-Hernando C, Holtzman DM, Cirrito JR, Ono K, Kim J. 2015. MicroRNA-33 regulates ApoE lipidation and amyloid-beta metabolism in the brain. J Neurosci 35:14717–14726. doi: 10.1523/JNEUROSCI.2053-15.2015. [DOI] [PMC free article] [PubMed] [Google Scholar]
- 32.Ray K. 2010. IDE and late-onset AD. Nat Rev Neurol 6:185. doi: 10.1038/nrneurol.2010.24. [DOI] [Google Scholar]
- 33.Leissring MA, Farris W, Chang AY, Walsh DM, Wu X, Sun X, Frosch MP, Selkoe DJ. 2003. Enhanced proteolysis of beta-amyloid in APP transgenic mice prevents plaque formation, secondary pathology, and premature death. Neuron 40:1087–1093. doi: 10.1016/s0896-6273(03)00787-6. [DOI] [PubMed] [Google Scholar]
- 34.Sajan M, Hansen B, Ivey R III, Sajan J, Ari C, Song S, Braun U, Leitges M, Farese-Higgs M, Farese RV. 2016. Brain insulin signaling is increased in insulin-resistant states and decreases in FOXOs and PGC-1alpha and increases in Abeta1-40/42 and phospho-Tau may abet Alzheimer development. Diabetes 65:1892–1903. doi: 10.2337/db15-1428. [DOI] [PMC free article] [PubMed] [Google Scholar]
- 35.Chamorro-Jorganes A, Araldi E, Rotllan N, Cirera-Salinas D, Suárez Y. 2014. Autoregulation of glypican-1 by intronic microRNA-149 fine tunes the angiogenic response to FGF2 in human endothelial cells. J Cell Sci 127:1169–1178. doi: 10.1242/jcs.130518. [DOI] [PMC free article] [PubMed] [Google Scholar]
- 36.van Rooij E, Sutherland LB, Qi X, Richardson JA, Hill J, Olson EN. 2007. Control of stress-dependent cardiac growth and gene expression by a microRNA. Science 316:575–579. doi: 10.1126/science.1139089. [DOI] [PubMed] [Google Scholar]
- 37.Nikolic I, Plate KH, Schmidt MHH. 2010. EGFL7 meets miRNA-126: an angiogenesis alliance. J Angiogenesis Res 2:9. doi: 10.1186/2040-2384-2-9. [DOI] [PMC free article] [PubMed] [Google Scholar]
- 38.Megraw M, Cumbie JS, Ivanchenko MG, Filichkin SA. 2016. Small genetic circuits and microRNAs: big players in polymerase II transcriptional control in plants. Plant Cell 28:286–303. doi: 10.1105/tpc.15.00852. [DOI] [PMC free article] [PubMed] [Google Scholar]
- 39.Kim J, Yoon H, Chung DE, Brown JL, Belmonte KC, Kim J. 2016. miR-186 is decreased in aged brain and suppresses BACE1 expression. J Neurochem 137:436–445. doi: 10.1111/jnc.13507. [DOI] [PMC free article] [PubMed] [Google Scholar]