Abstract
A novel, highly sensitive and selective safrole sensor has been developed using quartz crystal microbalance (QCM) coated with polyvinyl acetate (PVAc) nanofibers. The nanofibers were collected on the QCM sensing surface using an electrospinning method with an average diameter ranging from 612 nm to 698 nm and relatively high Q–factors (rigid coating). Scanning electron microscopy (SEM) and atomic force microscopy (AFM) were used to analyze the PVAc nanofiber surface morphology, confirming its high surface area and roughness, which are beneficial in improving the sensor sensitivity compared to its thin-film counterpart. The as-spun PVAc nanofiber sensor could demonstrate a safrole limit of detection (LOD) of down to 0.7 ppm with a response time of 171 s and a sensitivity of 1.866 Hz/ppm. It also showed good reproducibility, rapid response time, and excellent recovery. Moreover, cross-interference of the QCM sensor response to non-target gases was investigated, yielding very low cross-sensitivity and high selectivity of the safrole sensor. Owing to its high robustness and low fabrication cost, this proposed sensing device is expected to be a promising alternative to classical instrumental analytical methods for monitoring safrole-based drug precursors.
Subject terms: Sensors, Analytical chemistry
Introduction
Electrospinning is a simple and versatile technique that can create a micron–thick film containing sub-micron scale nanofibers. This technique is used to fabricate nanofibers for various applications ranging from membrane filtration to tissue engineering, and more recently, electrochemical applications1–6. The development of nanostructured materials, especially nanofiber as a sensing material, has been accelerated over the past decades7. Electrospun nanofiber film offers fibers with very small diameters and large surface areas per unit mass, which are advantageous for gas sensing8. The high specific surface area and porosity of electrospun nanofibers have sparked an increasing interest in their use as ultrasensitive gas sensors9–12. Thus, they have recently been used as active sensing layers and integrated onto various gas sensor platforms including resistive13, photoelectric14, amperometric15, optical16, and acoustic wave17,18. Among these devices, gravimetric sensors based on quartz crystal microbalance (QCM) have been preferred to be used for vapor detection because of their high sensitivity, fast response, inexpensive production, real-time measurement capability, and simple integration with other electronic components19–24. The QCM is basically a piezoelectric sensor platform employing acoustic-electric effects that can measure mass resolution down to the picogram level25. By modifying the QCM chip sensing area with appropriate sensing layers (e.g., polymers26–29, metal oxides30,31, and some functional materials32,33), specific analytes that are additionally deposited on its surface can induce a frequency shift, which can subsequently be translated into detected analyte mass according to the Sauerbrey equations34.
Safrole is a pale–yellow oil that is normally used as a precursor in the production of the amphetamine-type stimulus drug 3,4–methylenedioxyamphetamine (MDMA, “ecstasy”). Several studies have highlighted the need for the development of a better technique for the detection of drug–synthesis reactants (i.e., benzodioxol, benzyl methyl ketone (BMK), and safrole)35–38. Conventional analytical methods (e.g., liquid chromatography (LC), gas chromatography (GC), and gas chromatography coupled with mass spectrometry (GC-MS)39,40) are often employed for forensic safrole testing. However, these techniques are costly, not portable, and challenging to be operated in real-time. Therefore, the development of a rapid, reliable, low-cost, and real-time safrole sensor is needed. In our previously reported studies37,38, although nanofiber-based QCM safrole sensors had been developed and tested, their performance was still unsatisfactory in terms of sensitivity and selectivity, due to poor intermolecular interaction between safrole molecules and sensing layers (i.e., polyacrylonitrile (PAN) nanofiber). Therefore, polyvinyl acetate (PVAc)-based nanofiber membrane was developed and employed in this work to overcome this issue. This hydrophobic polymer could be easily electrospun on the active layer of QCM. The hydrophobicity of PVAc is essential since the response of the QCM vapor sensor is heavily interfered by water vapor. For the sensing mechanism, the oxygen molecules in PVAc structure will act as a Lewis base that can interact with safrole (Lewis acid). A Lewis base is an electron pair donor, while a Lewis acid is an electron pair acceptor41. They can react with each other forming a covalent bond, where both electrons are provided by the Lewis base. In case of their molecular orbitals, Lewis acids and bases have an unoccupied low-energy atomic states and occupied relatively high energy atomic states, respectively. A lone electron pair (i.e., a pair of valence electrons that are not shared with another atom in a covalent bond) in oxygen sites from each PVAc unit may interact strongly with two protons located between two oxygen atoms of safrole. Furthermore, to demonstrate its feasibility as a practical sensor in a real field, cross-sensitivity measurements toward other non-target gases were also conducted and evaluated.
Results and Discussion
PVAc membrane analysis
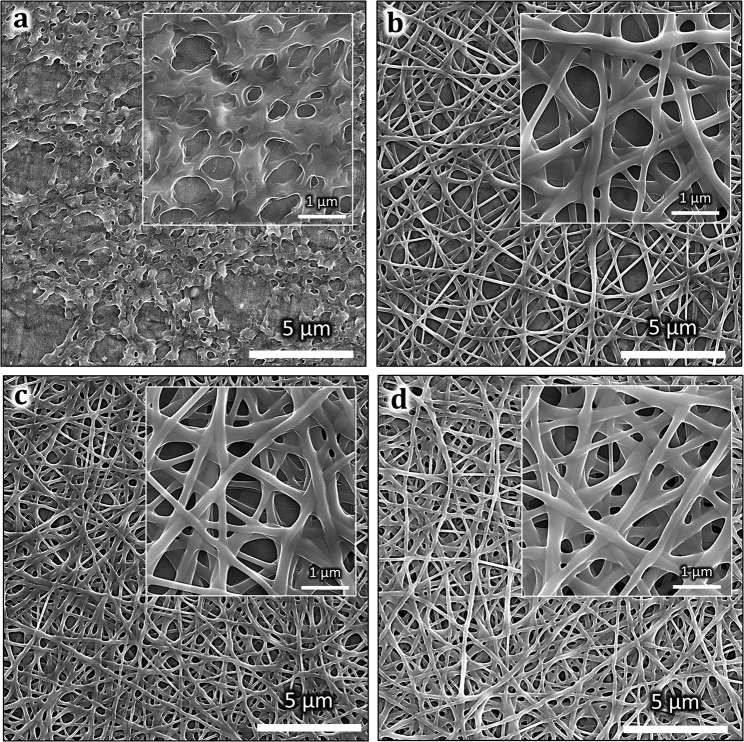
Figure 3 displays the SEM images of both PVAc thin-film (NF 0) and PVAc nanofibers (NF 1, NF 2, and NF 3). Continuous nanofiber structures with a smooth surface are clearly seen from the inset images of Fig. 3(b–d). The mean diameters of the nanofiber samples are listed in Table 1, revealing similar average diameters ranging from 612 nm to 698 nm. Meanwhile, the morphology of PVAc thin-film produced by a spin coating process revealed a smooth surface with several pores (see Fig. 3(a)). Both types of structures presented relatively homogenous features in their physical morphology. Furthermore, they also possessed 3D pore architectures that led to easy accessibility and fast exposure to the gases, rendering the PVAc nanostructured membrane a potential candidate for application in routine vapor detection. The 3D porous structure increased the sensor surface area and enhanced the contact area between safrole molecules and sensing sites. Thus, it could improve the sensing performances. Table 1 also shows the sensing layer thickness hsensor, which is calculated using Eq. (1)
| 1 |
where , , and are the deposited sensor mass (see Table 1), the density of PVAc (1.19 g/cm3), and the surface area of QCM electrodes (0.283 cm2), respectively.
Figure 3.
SEM images of (a) PVAc thin-film (NF 0), (b) PVAc nanofiber (NF 1), (c) NF 2, (d) NF 3 (inset figure is the magnified view of the structures).
Table 1.
Parameters of developed PVAc sensors (i.e., NF 0, NF 1, NF 2, and NF 3) based on different membrane structures (i.e., thin-film and nanofibers).
| Sample | NF 0 | NF 1 | NF 2 | NF 3 |
|---|---|---|---|---|
| Membrane form | Thin-film | Nanofiber | Nanofiber | Nanofiber |
| Deposition time (s) | 30 | 5 | 15 | 25 |
| Diameter (nm) | — | 631 ± 85 | 612 ± 98 | 698 ± 70 |
| Frequency shift (kHz) | 16.3 | 2.0 | 16.2 | 21.0 |
| Deposited mass (µg) | 20.4 | 2.5 | 20.2 | 26.2 |
| Calculated thickness (nm) | 606 | 74 | 599 | 778 |
The density of PVAc and the surface area of QCM electrode are 1.19 g/cm3 and 0.283 cm2, respectively.
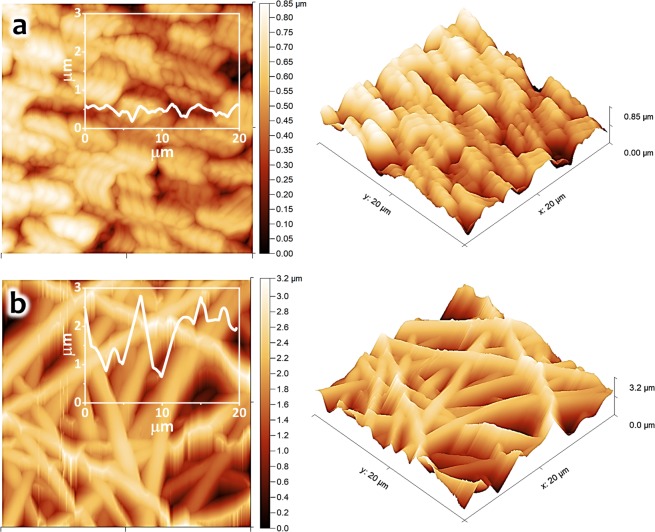
Figure 4(a,b) show the AFM analyses of deposited PVAc thin film and nanofibers. In the case of the PVAc thin-film (NF 0), a relatively homogeneous surface with several porous structures was obtained. The root mean square roughness (RRMS) of the PVAc thin-film sample was found at about 140 nm, with a 415 nm2 surface area (Fig. 4(a)). To the contrary, the PVAc nanofiber sample (NF 2) was clearly found to be rougher than its thin-film surface, which was confirmed by its RRMS of about 520 nm, with a 572 nm2 surface area (Fig. 4(b)). It should be mentioned that both RRMS values obtained for thin-film and nanofiber samples were determined on the basis of the 20 × 20 μm2 of the AFM images. Besides, because of their similar morphologies shown in Fig. 3(b–d), other two nanofiber samples (NF 1 and NF 3) are expected to have similar roughness and porosity characteristics to sample NF 2.
Figure 4.
Top-view and cross-sectional AFM images of the PVAc nanostructures: (a) NF 0 and (b) NF 2.
The conductance and susceptance spectra were measured to analyze the resonant characteristics of the QCM-based PVAc sensor prior to safrole exposure as shown in Fig. 5(a,b). Accordingly, quality factor (Q–factor) of the resonator could be extracted as the ratio of the peak frequency to the half bandwidth in the conductance spectrum. It is well-known from micro-/nanoelectromechanical systems (MEMS/NEMS), that higher Q-factor is preferable for sensors to have better stability, smaller frequency noise, and less energy loss31,42. The measured Q–factors of the QCM-based PVAc sensors in normal ambient air were 47818, 32951, 48059, and 33093 for NF 0, NF 1, NF 2, and NF 3, respectively. In comparison with other typical MEMS/NEMS-based resonators made of piezoresistive silicon cantilevers43–45, electrothermal silicon cantilevers46–48, and vertical silicon nanowires49–51, the piezoelectricity QCM sensors (quartz) exhibited superiority in terms of Q–factor, even after being functionalized with PVAc thin-films or nanofibers. This demonstrated that both polymer deposition techniques used in this work (i.e., spin coating and electrospinning) could offer a solution for creating stable hybrid polymer/semiconductor MEMS-based devices with low-frequency noise. It should be noted that for such silicon microcantilever structures coated with photoresist in a drop-casting method, their Q–factors may deteriorate by one order of magnitude52.
Figure 5.
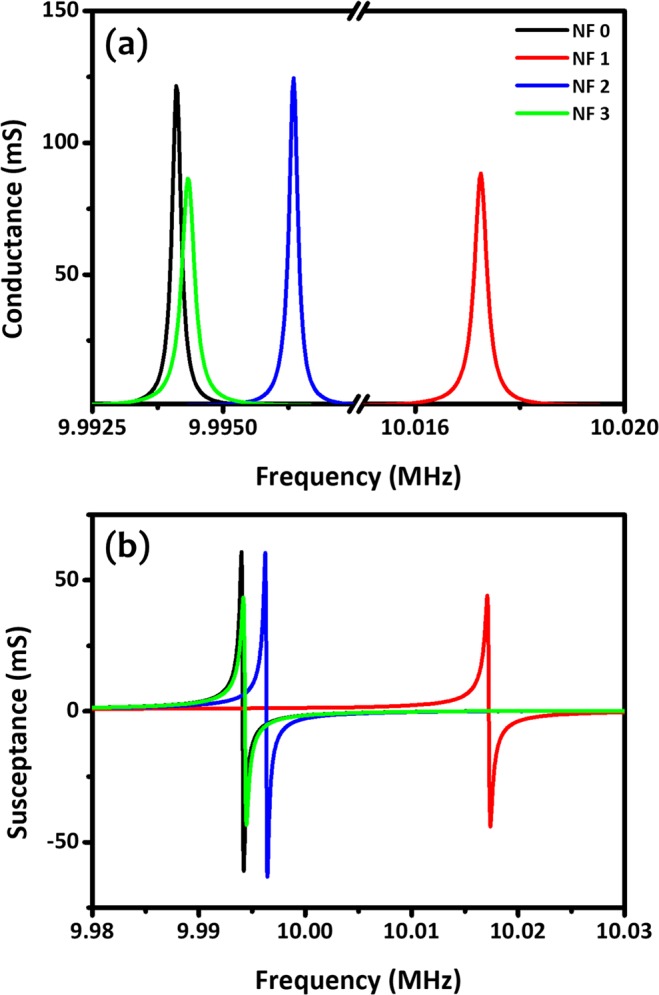
Frequency characteristics of all sensors (NF 0–NF 3) measured in (a) conductance and (b) susceptance modes.
Safrole exposure assessment
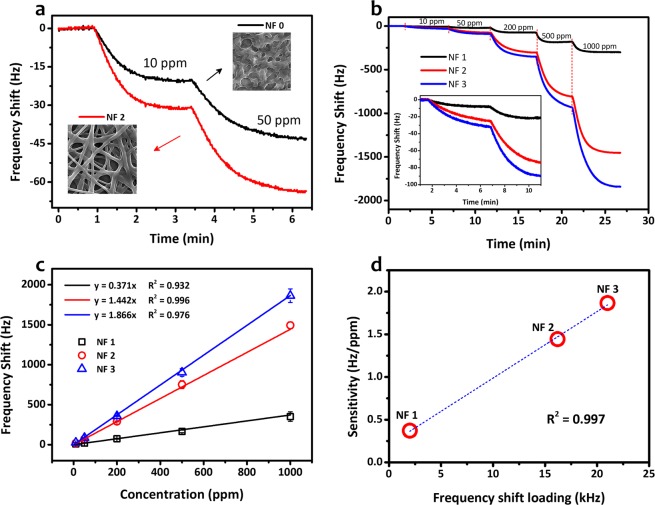
Figure 6(a) shows the measured dynamic responses of QCM sensors coated with PVAc thin-film (NF 0) and PVAc nanofiber (NF 2) under exposure to safrole vapors. To directly investigate the influence of surface-to-volume enhancement of the nanofibers, both samples were previously treated with similar loading depositions (i.e., ~16 kHz). During the gas sensing test, the safrole concentration was initially set at 10 ppm and subsequently increased to 50 ppm. As expected, both sensors (NF 0 and NF 2) experienced frequency shifts toward lower values. However, from the sensor responses, it was clearly shown that the nanofiber structure (NF 2) exhibits larger frequency shifts (i.e., around 1.5 times) compared to its thin-film counterpart (NF 0), even though PVAc deposition masses for both devices were kept at a similar level. At 50 ppm safrole concentration, the frequencies of NF 0 and NF 2 samples dropped by 42 Hz and 65 Hz, respectively, from their initial value, where the gas had not been injected into the sealed chamber. This result has confirmed the importance of having larger surface area and porous surface structures made as nanofibers compared with ordinary thin film53. This argument for the response difference between these two sensors has been supported by the SEM (Fig. 3(a,c)) and AFM images (Fig. 4(a,b)). The SEM images indicate that the thin-film sample had a relatively smooth surface with a few pores, while the nanofiber sample possessed more membrane pores (space between the nanofibers). Moreover, the AFM images show that the nanofiber structure had a rougher surface and higher surface area compared to the thin film.
Figure 6.
QCM-based PVAc safrole sensor characteristics. (a) Frequency responses of PVAc thin-film (NF 0) and PVAc nanofiber (NF 2). (b) Dynamic responses of PVAc nanofiber sensor for increasing safrole concentration (inset: zoom at low concentration). (c) Frequency shift of QCM PVAc safrole sensor in different safrole concentrations. (d) Sensitivity of QCM PVAc nanofiber sensor for increasing loading depositions.
To investigate the influence of loading deposition on QCM-based PVAc nanofiber sensor performance, the electrospinning parameters were varied as listed in Table 1. The loading deposition was increased from NF 1 to NF 3. Figure 6(b) depicts the dynamic responses of three sensors with different nanofiber structures under exposure to increasing safrole concentrations from 10 to 1000 ppm. It shows that the response of the PVAc nanofiber sensors could be enhanced by increasing the loading depositions. For instance, at 50 ppm safrole concentration, the responses (changes of resonance frequency) of the sensors were measured to be 18 Hz, 71 Hz, and 85 Hz for NF 1, NF 2, and NF 3 sensors, respectively. Moreover, by increasing the safrole concentration up to 1000 ppm, a larger frequency change in the QCM sensors was obtained, reaching up to almost 2 kHz (Fig. 6(c)). The sensitivity, which is defined as the slope of the linear correlation between the safrole concentration and its frequency change, also increased from NF 1 to NF 3 (i.e., SNF1 = 0.37 Hz/ppm, SNF2 = 1.44 Hz/ppm, and SNF3 = 1.86 Hz/ppm). A good linear correlation between loading deposition (frequency shift after coating) and sensor sensitivity is shown in Fig. 6(d) with a correlation coefficient (R2) of 0.997. The increase in loading depositions indicates that more PVAc molecules were successfully deposited on the QCM chips. The feasibility of intermolecular interaction between the active layer and the analyte was therefore enhanced, resulting in higher frequency shifts.
Proposed sensing mechanism
Physisorption or physical adsorption between safrole gas and PVAc can be an important adsorption mechanism toward an understanding of the sensing behavior of this developed hybrid PVAc/QCM device. From FTIR characterization, we could confirm that there was no chemical interaction between PVAc nanofiber and safrole molecules. Figure 7(a–c) show the IR spectra of PVAc, safrole, and PVAc exposed to safrole, respectively. PVAc nanofiber (Fig. 7(a)) had an absorbance at the peak of 1731–1733 cm−1, which was attributed to an acetate ester carbonyl group (C=O; C–O). The other peaks could be found at 1433–1435 cm−1 (C–H), 1371–1372 cm−1 (C–H), 1227–1235 cm−1 (C–O), and 1019–1021 cm−1 (C–O)54. IR spectrum of safrole is shown in Fig. 7(b), with peaks at 1501 cm−1, 1490 cm−1, and 1441 cm−1, that are related to stretching of the carbon double bond (C=C), while an additional peak at 3077 cm−1 can be attributed to stretching of the hydrocarbon (C–H), which is an aromatic group. Furthermore, safrole has an aldehyde group that is depicted by peaks at 2775 cm−1, 2838 cm−1, 2895 cm−1, and 2978 cm−1. Figure 7(c) shows the peak characteristics of both PVAc nanofiber and safrole. The peaks observed in the PVAc nanofiber exposed to safrole FTIR spectra were close to those in the spectrum of PVAc. The peaks detected at 1504 cm−1 dan 1490 cm−1 (C=C) were attributed to the aromatic ring, whereas peaks at 2955 cm−1 and 2854 cm−1 (C–H) corresponded to the aldehyde group of the safrole. These results confirmed that no chemical reaction occurred when PVAc nanofiber was exposed to safrole. The only possible interaction was intermolecular interaction, which cannot be detected using the FTIR method.
Figure 7.
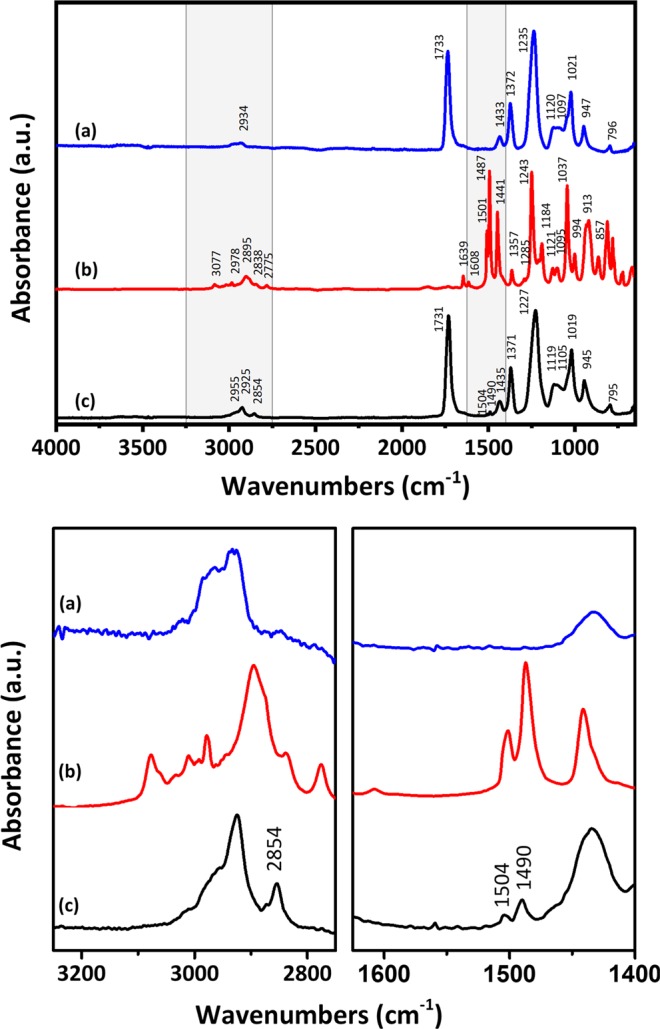
FTIR spectra of (a) PVAc nanofiber, (b) safrole, and (c) PVAc exposed to safrole vapor.
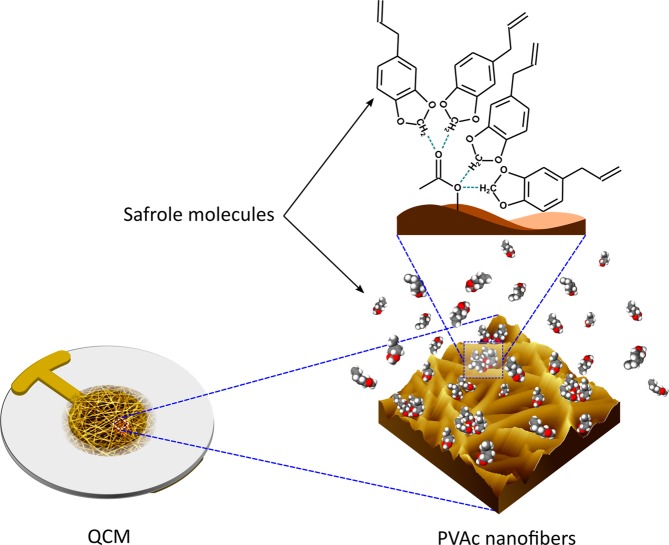
There may be two scenarios by which safrole is received by the sensor as illustrated in Fig. 8. First, the carbonyl group, an ester of PVAc, has an O atom with a higher electronegativity than the C atom of safrole. In this situation, the O atom has a partial negative charge (δ−) and the C atom has a partial positive charge (δ+). Consequently, dipole-dipole interactions can occur. Furthermore, one O atom of PVAc monomer can interact with the carbon atoms of two safrole molecules, so that one monomer of PVAc can interact with four safrole molecules. Because of these phenomena, PVAc can interact more readily than PAN, used in former works37. Secondly, the molecular structure may influence the interaction and cause different sensor sensitivities to the analyte. PVAc is a polymer that has a polar structure, so that interactions will be stronger with analyte molecules that also have a polar structure55. Each analyte has a unique molecular structure affecting its polarity.
Figure 8.
Schematic representation of the proposed interaction mechanism between the PVAc nanofiber and safrole molecules.
Other sensor characteristics
The LOD and the limit of quantification (LOQ) are determined based on the standard deviation and the slope of the plot in Fig. 6(c)56. The LOD and LOQ are expressed as 3.3 σ/S and 10 σ/S, respectively, where σ is the standard deviation of the blank air measurement (i.e., 0.37 Hz for NF 3) and S is the sensor sensitivity (i.e., 1.866 Hz/ppm for NF 3). Thus, the LOD and LOQ of QCM modified with PVAc nanofiber (NF 3) could be calculated to be 0.7 ppm and 2 ppm, respectively.
Compared to other materials, the PVAc nanofiber sensors produced by electrospinning exhibited the highest sensitivity. While integrating PAN nanofiber on QCM devices only resulted in sensor sensitivities of 0.035 Hz/ppm37, using PVAc nanofiber (NF 3) could deliver a sensitivity of up to 1.86 Hz/ppm, which demonstrated a remarkable increase of ~53 times. The explanation of this phenomenon has been discussed previously in the proposed sensing mechanism section.
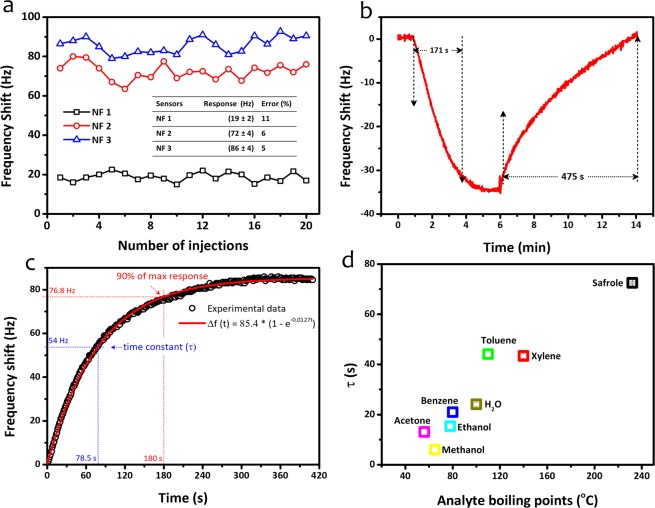
To investigate their sensing reproducibility, the PVAc nanofiber sensors were exposed to safrole vapors at a fixed concentration of 50 ppm and multiple gas injections (up to 20 times). Figure 9(a) shows the measured signals of three different QCM-based PVAc sensors during the reproducibility test. The standard deviations were found to be 11, 6, and 5% for the response values of NF 1, NF 2, and NF 3, respectively. The slight fluctuation in frequency shift suggests that all QCM chips exhibited high sensing reproducibility.
Figure 9.
(a) Reproducibility, (b) response–recovery, (c) response time of NF 2 samples exposed to 50 ppm of safrole, and (d) time constant of the NF 2 sensor exposed to various analytes corresponding to its boiling points.
The full sensor response and recovery characteristics are important parameters in the performance of gas sensors. Thus, to investigate them in the PVAc sensors, we modified the gas sensing configuration. The response-recovery investigation was performed by modifying the sensor chamber in accordance with previously reported setup9,24. The safrole concentration was predetermined at 50 ppm. The response and recovery behaviors of the NF 2 sensor are depicted in Fig. 9(b), where full recovery could be obtained by the sensor after being exposed to safrole. Moreover, the response and recovery times for the NF 2 sensor were measured to be 171 and 475 s, respectively. It should be noted that the sensor response or recovery time is defined as the time required for the sensor to reach 90% of its maximum value (t90) during response or recovery activity. In comparison to typical conductometric metal oxide gas sensors57,58, which need longer response/recovery times (10–120 min), our PVAc-coated QCM sensors could, apparently, react faster to exposing gas.
Figure 9(c) shows the response of the NF 3 sensor to safrole vapor at 50 ppm, which fits the first-order instrument response. The time constant (τ) was found to be 78 s for this device toward safrole. For other analytes, the sensor time constant also differed, depending on the interaction between sensor and measured gas molecules. Regarding sensing, we believe that the properties of the analyte (i.e., boiling points) influenced the response times of the sensor. Figure 9(d) shows the correlation graph between the analyte boiling points and the relaxation time of the QCM-based PVAc sensor. The results indicate that the relaxation time increases linearly with the rise of the analyte boiling point for most of the analytes. The anomaly appears for the methanol analyte, for which factors other than analyte boiling point may have influenced the relaxation time. Thus, in-depth investigation into this matter will be necessary for our next study. Moreover, the results presented here only apply when the sensor responses were measured using static batch method.
Apart from sensitivity and response/recovery time, reaction selectivity of the sensors plays an important role to examine the device practicability in the field. Therefore, cross-sensitivity experiments were conducted with various volatile organic compound (VOC) gases at 50 ppm concentration, which are usually present in ambient air (US EPA). As the sensor under test, we used the NF 2 sensor, whose results are shown in Fig. 10(a). Extremely high selectivity was observed for safrole gas, whose measured sensitivity is 1.44 Hz/ppm. Meanwhile, the PVAc nanofiber sensor showed a very low response toward other gases (e.g., xylene, formaldehyde, toluene, benzene, ethanol, acetone, methanol, and water), for which a sensitivity of below 0.065 Hz/ppm was normally obtained. Thus, it can be concluded that the PVAc nanofiber sensor (NF 2) showed an excellent selectivity to safrole vapor.
Figure 10.
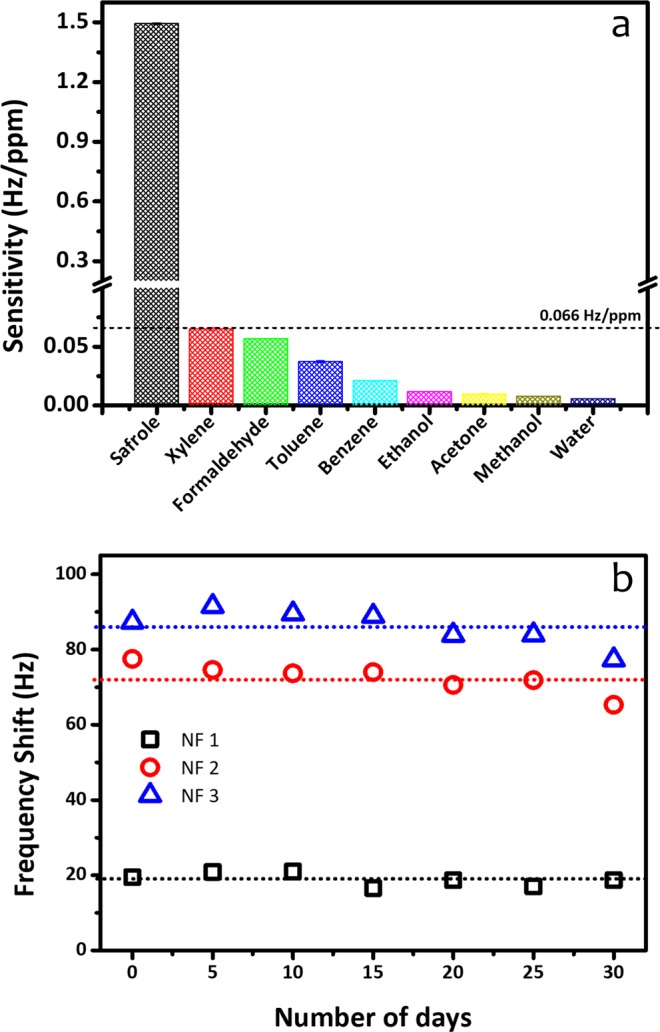
(a) Sensitivity comparison (NF 2 at 50 ppm safrole), and (b) long-term stability measurement of QCM PVAc nanofiber safrole sensor.
As sensor robustness is very important for real device applications, the PVAc safrole sensors were regularly tested with 50 ppm safrole vapor every 5 days over a 30 day period to evaluate their long-term stability. Figure 10(b) displays the responses (frequency shifts) as a function of time over 30 days. The average responses of the PVAc sensors (NF 1, NF 2, and NF 3) were measured to be 19, 72, and 86 Hz, with relative errors of 9, 4, and 5%, respectively. The sensor still displayed a good response with an almost constant value of resonance frequency after 30 days of gas sensing measurement, indicating that the employed QCM system is highly stable for long-term use.
Conclusions
PVAc nanofibers have been successfully fabricated through a simple and facile electrospinning technique, in which their sensing characteristics toward safrole vapor have been investigated. The high surface area and porous structure of the nanofibers clearly influence the safrole sensor performance. Compared to the device coated with PVAc thin-film, the sensors functionalized with PVAc nanofibers exhibited an excellent enhancement of safrole detection. The response sensitivity of the PVAc nanofiber sensor is 1.5 times higher than that of PVAc thin-film sensor. The detection limit of the sensor could reach as low as 0.7 ppm, with up to 1.866 Hz/ppm sensitivity toward safrole. As–prepared sensors have shown good reproducibility, long-term stability, and high selectivity toward others analytes. All in all, the QCM sensing chip modified with electrospun polymers may offer a new strategy in real-time sensing of drug precursors.
Materials and Method
Materials
Polyvinyl acetate (PVAc) with a molecular weight of 500,000 g/mol was supplied by Sigma–Aldrich. N,N–dimethylformamide (DMF) for dissolving PVAc was purchased from Merck (Germany). Safrole analyte with 96% purity, was supplied by the Indonesian National Police, Jakarta, Indonesia. All chemicals were used as received without further purification. The AT–Cut QCM sensors with gold electrodes and 10 MHz base resonant frequency were purchased from OpenQCM, Novaetech. R&D, Napoli, Italy.
Preparations of QCM PVAc nanofiber and thin-film
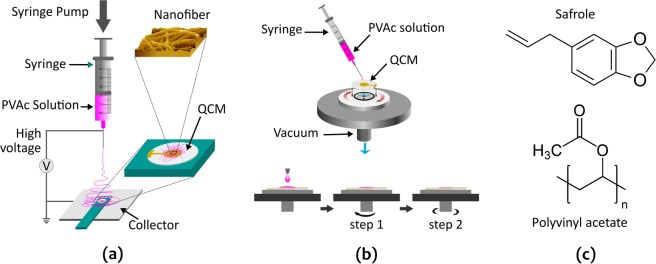
The PVAc solution was prepared using dimethylformamide (DMF) at a concentration of 15% (w/w) and subsequently electrospun on a QCM substrate at an applied voltage of 15 kV and a needle–to–collector distance of 15 cm. The electrospinning process (Fig. 1(a)) was carried out for 5, 15, and 25 seconds and denoted as NF 1, NF 2, and NF 3, respectively. After being collected on the chip, the as-spun nanofibers were then dried overnight prior to their use in sensor assessments.
Figure 1.
Schematic illustration of (a) electrospinning setup, (b) a spin-coating process, and (c) chemical structure of polyvinyl acetate (PVAc) and safrole.
To investigate the effect of enhanced surface area by nanofibers on QCM sensor performance, besides the electrospinning technique, a spin coating method was also utilized for producing a PVAc membrane with a different structure (i.e., thin-film) using Compact Spin Coater VTC–100 (see Fig. 1(b)). The PVAc thin-film sensor was fabricated using the same parameters as previously reported24. The two-step spin coating process was employed during the thin-film membrane fabrication to obtain a deposited film mass similar to that of the PVAc nanofiber sample created by electrospinning. Spinning speeds of 500 rpm and 5000 rpm were set during the first and second spin processes for 5 s and 30 s, respectively. The resulting PVAc thin-film membrane was then denoted as NF 0. The chemical structures of polyvinyl acetate (PVAc) and safrole are shown in Fig. 1(c).
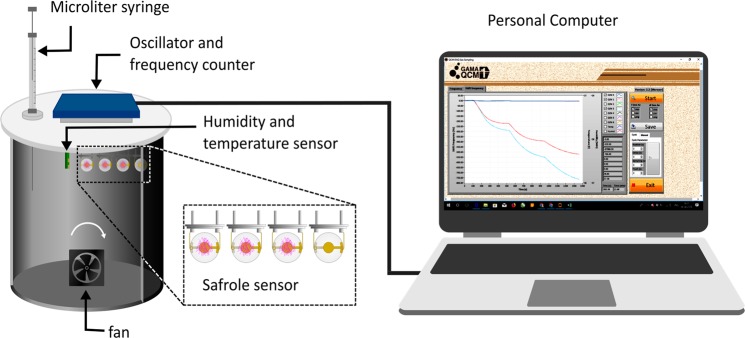
Sensor apparatus for safrole detection
A schematic diagram of the PVAc QCM testing system is shown in Fig. 2. The PVAc QCM sensor was installed inside a testing chamber (2 L) using similar environmental conditions as described in literature24,28. A ten microliter Hamilton syringe (Model 701 RN SYR) was used for analyte injection. The concentration of an injected analyte in the testing chamber was calculated according to Eq. (2)53,59:
| 2 |
where C is the analyte concentration in ppm, is the density of liquid analyte in g/mL, is the volume of the analyte in µL, is the Kelvin temperature in the testing chamber, is the molecular weight of analyte in g/mol, and is the chamber volume in L. This equation assumes that the safrole is fully evaporated in the chamber after injection. The responses of the QCM sensors were tested by monitoring the change in the resonance frequency, as measured by a frequency counter. The change in the resonant frequency of the QCM sensor is related to the change in mass loading on the QCM sensor chip. The frequency change data were recorded with a PC equipped with the LabVIEW graphical programing language. To desorb the analyte vapor from the QCM sensing chips, dry ambient air was used during purging.
Figure 2.
Measurement setup of the quartz crystal microbalance system for gas or vapor sensing.
Sample characterization
The nanofiber morphology of the samples was analyzed using scanning electron microscopy (SEM, JEOL JSM–6510). Their roughness was characterized using atomic force microscopy (AFM, XE–70, Park System Corp., South Korea). The conductance and susceptance of the QCM were measured using a vector network analyzer (Omicron–Lab Bode 100), while Fourier-transform infrared spectroscopy (FTIR, Thermo Nicolet iS10) was utilized to understand the chemical reactions between safrole gas and PVAc. The amount of mass deposited on the QCM chip can be calculated according to the Sauerbrey equation34, as expressed in Eq. (3):
| 3 |
where is the resonant frequency shift of QCM (Hz), is the base resonant frequency (10 MHz), is the mass change (g), is the electrode surface area (0.283 cm2), and are the shear modulus and density of quartz crystal (2.947 × 10¹¹ g·cm−1·s−2 and 2.648 g·cm−3), respectively. The developed PVAc membranes (i.e., NF 0, NF 1, NF 2, and NF 3) with different fabrication parameters and masses on the surface of the QCM substrates are listed in Table 1. For cases of created nanofibers, regardless of their similar diameters, it is obvious that the NF 1 and NF 3 samples have the smallest and largest deposited masses, respectively, which differ by one order of magnitude, affecting the performance of the QCM sensors.
Acknowledgements
We acknowledge the financial support provided by the Ministry of Research, Technology and Higher Education of the Republic of Indonesia (RISTEKDIKTI) under “Penelitian Terapan” (PT) schemes (Contract No. 2833/ UN1.DITLIT/DIT-LIT/LT/2019). We also thank Mr. Budiarto (Indonesian National Police, Headquarters, Jakarta) for supplying the safrole samples. A. Rianjanu acknowledges a Ph.D. scholarship issued by the Ministry of Research, Technology and Higher Education of the Republic of Indonesia trough PMDSU program. We thank Dr. Setyawan P. Sakti for characterizing the conductance and susceptance of the QCM using a vector network analyzer (Omicron-Lab Bode 100). H.S. Wasisto acknowledges the financial support from Lower Saxony Ministry for Science and Culture (N-MWK) for LENA-OptoSense group and RISTEKDIKTI for Indonesian-German Center for Nano and Quantum Technologies (IG-Nano). H.S. Wasisto and K. Triyana thank the Directorate General of Higher Education, Science, and Technology Resources (Ditjen SDID), RISTEKDIKTI for providing them an opportunity to be involved in an excellent Indonesian diaspora platform of World-Class Scholar Symposium (Simposium Cendekia Kelas Dunia (SCKD)), which has led to establishment of continuous collaboration between domestic and diaspora scientists for accelerating transfer of science and technology and advancing research and development in Indonesia, especially in the fields of nanotechnology and sensors.
Author contributions
K.T. conceived and designed the experiments, revised the paper, and led the project. A.R. performed experiments, analyzed the data, and wrote the initial paper. D.B.N. and A.H.A. performed the experiments, analyzed the data. A.K. and R.R. designed the experiments, contributed reagents and materials, analyzed the data, and revised the paper. R.S. performed AFM measurement and analyzed the data. H.S.W. analyzed the data and revised the paper. All authors confirmed the final manuscript
Competing interests
The authors declare no competing interests.
Footnotes
Publisher’s note Springer Nature remains neutral with regard to jurisdictional claims in published maps and institutional affiliations.
References
- 1.Moon S, Gil M, Lee KJ. Syringeless Electrospinning toward Versatile Fabrication of Nanofiber Web. Sci. Rep. 2017;7:41424. doi: 10.1038/srep41424. [DOI] [PMC free article] [PubMed] [Google Scholar]
- 2.Gnanasekar S, Kollu P, Jeong SK, Grace AN. Pt-free, low-cost and efficient counter electrode with carbon wrapped VO2(M) nanofiber for dye-sensitized solar cells. Sci. Rep. 2019;9:5177. doi: 10.1038/s41598-019-41693-1. [DOI] [PMC free article] [PubMed] [Google Scholar]
- 3.Miguel SP, et al. Electrospun polymeric nanofibres as wound dressings: A review. Colloids Surfaces B Biointerfaces. 2018;169:60–71. doi: 10.1016/j.colsurfb.2018.05.011. [DOI] [PubMed] [Google Scholar]
- 4.Li F, et al. Synthesis and characterization of Cr-doped WO3nanofibers for conductometric sensors with high xylene sensitivity. Sensors Actuators, B Chem. 2018;265:355–364. doi: 10.1016/j.snb.2018.03.054. [DOI] [Google Scholar]
- 5.Chotimah, et al. Electrical Conductivity Improvement of Polyvinyl Alcohol Nanofiber by Solvent Vapour Treatment. Int. J. Adv. Sci. Eng. Inf. Technol. 2016;6:675. doi: 10.18517/ijaseit.6.5.1055. [DOI] [Google Scholar]
- 6.Rianjanu A, Kusumaatmaja A, Suyono EA, Triyana K. Solvent vapor treatment improves mechanical strength of electrospun polyvinyl alcohol nanofibers. Heliyon. 2018;4:e00592. doi: 10.1016/j.heliyon.2018.e00592. [DOI] [PMC free article] [PubMed] [Google Scholar]
- 7.Ding B, Wang M, Wang X, Yu J, Sun G. Electrospun nanomaterials for ultrasensitive sensors. Mater. Today. 2010;13:16–27. doi: 10.1016/S1369-7021(10)70200-5. [DOI] [PMC free article] [PubMed] [Google Scholar]
- 8.Ding B, Wang M, Yu J, Sun G. Gas sensors based on electrospun nanofibers. Sensors. 2009;9:1609–1624. doi: 10.3390/s90301609. [DOI] [PMC free article] [PubMed] [Google Scholar]
- 9.Nugroho, D. B., Rianjanu, A., Triyana, K., Kusumaatmaja, A. & Roto, R. Quartz crystal microbalance-coated cellulose acetate nanofibers overlaid with chitosan for detection of acetic anhydride vapor. Results Phys.15, 102680 (2019).
- 10.Rianjanu A, Nugroho DB, Kusumaatmaja A, Roto R, Triyana K. A study of quartz crystal microbalance modified with polyvinyl acetate nanofiber to differentiate short-chain alcohol isomers. Sens. Bio-Sensing Res. 2019;25:100294. doi: 10.1016/j.sbsr.2019.100294. [DOI] [Google Scholar]
- 11.Wang Y, et al. A novel ethanol gas sensor based on TiO2/Ag0.35V2O5 branched nanoheterostructures. Sci. Rep. 2016;6:33092. doi: 10.1038/srep33092. [DOI] [PMC free article] [PubMed] [Google Scholar]
- 12.Wu H, et al. One-step Synthesis of Ordered Pd@TiO2 Nanofibers Array Film as Outstanding NH3 Gas Sensor at Room Temperature. Sci. Rep. 2017;7:14688. doi: 10.1038/s41598-017-15319-3. [DOI] [PMC free article] [PubMed] [Google Scholar]
- 13.Wang J, et al. High performance hydrazine vapor sensor based on redox mechanism of twisted perylene diimide derivative with lower reduction potential. Sensors Actuators B Chem. 2017;239:898–905. doi: 10.1016/j.snb.2016.08.090. [DOI] [Google Scholar]
- 14.Aba L, et al. Sensitivity Improvement of Ammonia Gas Sensor Based on Poly(3,4-ethylenedioxythiophene):Poly(styrenesulfonate) by Employing Doping of Bromocresol Green. J. Nanotechnol. 2014;2014:1–5. doi: 10.1155/2014/864274. [DOI] [Google Scholar]
- 15.He K, Wang X, Meng X, Zheng H, Suye SI. Amperometric determination of hydroquinone and catechol on gold electrode modified by direct electrodeposition of poly(3,4-ethylenedioxythiophene) Sensors Actuators, B Chem. 2014;193:212–219. doi: 10.1016/j.snb.2013.11.055. [DOI] [Google Scholar]
- 16.Evyapan M, Kadem B, Basova TV, Yushina IV, Hassan AK. Study of the sensor response of spun metal phthalocyanine films to volatile organic vapors using surface plasmon resonance. Sensors Actuators B Chem. 2016;236:605–613. doi: 10.1016/j.snb.2016.05.070. [DOI] [Google Scholar]
- 17.Wang S-Y, et al. Surface acoustic wave ammonia sensor based on ZnO/SiO2 composite film. J. Hazard. Mater. 2015;285:368–374. doi: 10.1016/j.jhazmat.2014.12.014. [DOI] [PubMed] [Google Scholar]
- 18.Rianjanu A, et al. Polyacrylonitrile nanofiber as polar solvent N,N-dimethyl formamide sensor based on quartz crystal microbalance technique. J. Phys. Conf. Ser. 2018;1011:012067. doi: 10.1088/1742-6596/1011/1/012067. [DOI] [Google Scholar]
- 19.Sabri YM, et al. Gold nanospikes based microsensor as a highly accurate mercury emission monitoring system. Sci. Rep. 2014;4:6741. doi: 10.1038/srep06741. [DOI] [PMC free article] [PubMed] [Google Scholar]
- 20.Fulgione A, et al. QCM-based immunosensor for rapid detection of Salmonella Typhimurium in food. Sci. Rep. 2018;8:16137. doi: 10.1038/s41598-018-34285-y. [DOI] [PMC free article] [PubMed] [Google Scholar]
- 21.Su J, Charmchi M, Sun H. A Study of Drop-Microstructured Surface Interactions during Dropwise Condensation with Quartz Crystal Microbalance. Sci. Rep. 2016;6:35132. doi: 10.1038/srep35132. [DOI] [PMC free article] [PubMed] [Google Scholar]
- 22.Li J, et al. Adsorption–Desorption Control of Fibronectin in Real Time at the Liquid/Polymer Interface on a Quartz Crystal Microbalance by Thermoresponsivity. Biomacromolecules. 2019;20:1748–1755. doi: 10.1021/acs.biomac.9b00121. [DOI] [PubMed] [Google Scholar]
- 23.Tokura Y, et al. Ultrasensitive Detection of Methylmercaptan Gas Using Layered Manganese Oxide Nanosheets with a Quartz Crystal Microbalance Sensor. Anal. Chem. 2017;89:12123–12130. doi: 10.1021/acs.analchem.7b02738. [DOI] [PubMed] [Google Scholar]
- 24.Rianjanu A, et al. Polyvinyl Acetate Film-Based Quartz Crystal Microbalance for the Detection of Benzene, Toluene, and Xylene Vapors in Air. Chemosensors. 2019;7:20. doi: 10.3390/chemosensors7020020. [DOI] [Google Scholar]
- 25.Rodríguez-Pardo L, Rodríguez JF, Gabrielli C, Perrot H, Brendel R. Sensitivity, noise, and Resolution in QCM sensors in liquid media. IEEE Sens. J. 2005;5:1251–1256. doi: 10.1109/JSEN.2005.859257. [DOI] [Google Scholar]
- 26.Julian T, et al. Quartz crystal microbalance coated with PEDOT–PSS/PVA nanofiber for a high-performance humidity sensor. J. Sensors. Sens. Syst. 2019;8:243–250. doi: 10.5194/jsss-8-243-2019. [DOI] [Google Scholar]
- 27.Rianjanu, A. Quartz Crystal Microbalance Modified with Polymer Nanofiber Layer for the Detection of Organic Compounds. Ph.D. thesis, Universitas Gadjah Mada, Yogyakarta, Indonesia (2019).
- 28.Triyana K, et al. Chitosan-Based Quartz Crystal Microbalance for Alcohol Sensing. Electronics. 2018;7:181. doi: 10.3390/electronics7090181. [DOI] [Google Scholar]
- 29.Rianjanu A, et al. Swelling Behavior in Solvent Vapor Sensing based on Quartz Crystal Microbalance (QCM) Coated Polyacrylonitrile (PAN) Nanofiber. IOP Conf. Ser. Mater. Sci. Eng. 2018;367:012020. doi: 10.1088/1757-899X/367/1/012020. [DOI] [Google Scholar]
- 30.Zhang K, Fan G, Hu R, Li G. Enhanced Dibutyl Phthalate Sensing Performance of a Quartz Crystal Microbalance Coated with Au-Decorated ZnO Porous Microspheres. Sensors. 2015;15:21153–21168. doi: 10.3390/s150921153. [DOI] [PMC free article] [PubMed] [Google Scholar]
- 31.Zhang D, et al. Facile fabrication of high-performance QCM humidity sensor based on layer-by-layer self-assembled polyaniline/graphene oxide nanocomposite film. Sensors Actuators B Chem. 2018;255:1869–1877. doi: 10.1016/j.snb.2017.08.212. [DOI] [Google Scholar]
- 32.Lodge MS, et al. Lubricity of gold nanocrystals on graphene measured using quartz crystal microbalance. Sci. Rep. 2016;6:1–7. doi: 10.1038/srep31837. [DOI] [PMC free article] [PubMed] [Google Scholar]
- 33.Lu HL, Lu CJ, Tian WC, Sheen HJ. A vapor response mechanism study of surface-modified single-walled carbon nanotubes coated chemiresistors and quartz crystal microbalance sensor arrays. Talanta. 2015;131:467–474. doi: 10.1016/j.talanta.2014.08.027. [DOI] [PubMed] [Google Scholar]
- 34.Sauerbrey G. Verwendung von Schwingquarzen zur Wägung dünner Schichten und zur Mikrowägung. Zeitschrift für Phys. 1959;155:206–222. doi: 10.1007/BF01337937. [DOI] [Google Scholar]
- 35.Pinalli R, et al. Detection of amphetamine precursors with quinoxaline-bridged cavitands. Supramol. Chem. 2013;25:682–687. doi: 10.1080/10610278.2013.814778. [DOI] [Google Scholar]
- 36.Hackner A, et al. Surface ionization detection of amine containing drugs. Sensors Actuators, B Chem. 2013;185:771–776. doi: 10.1016/j.snb.2012.09.030. [DOI] [Google Scholar]
- 37.Rianjanu A, et al. Polyacrylonitrile Nanofiber-Based Quartz Crystal Microbalance for Sensitive Detection of Safrole. Sensors. 2018;18:1150. doi: 10.3390/s18041150. [DOI] [PMC free article] [PubMed] [Google Scholar]
- 38.Rianjanu, A. et al. An enhanced safrole sensing performance of a polyacrylonitrile nanofiber-based-QCM sensor by overlaying with chitosan. Sains Malaysiana48, (2019).
- 39.Honeychurch K. Review: The Application of Liquid Chromatography Electrochemical Detection for the Determination of Drugs of Abuse. Separations. 2016;3:28. doi: 10.3390/separations3040028. [DOI] [Google Scholar]
- 40.Saito K, et al. Analysis of drugs of abuse in biological specimens. J. Heal. Sci. 2011;57:472–487. doi: 10.1248/jhs.57.472. [DOI] [Google Scholar]
- 41.Liu LL, Stephan DW. Radicals derived from Lewis acid/base pairs. Chem. Soc. Rev. 2019;48:3454–3463. doi: 10.1039/C8CS00940F. [DOI] [PubMed] [Google Scholar]
- 42.Ding X, Chen X, Chen X, Zhao X, Li NA. QCM humidity sensor based on fullerene/graphene oxide nanocomposites with high quality factor. Sensors Actuators B Chem. 2018;266:534–542. doi: 10.1016/j.snb.2018.03.143. [DOI] [Google Scholar]
- 43.Wasisto HS, et al. Airborne engineered nanoparticle mass sensor based on a silicon resonant cantilever. Sensors Actuators B Chem. 2013;180:77–89. doi: 10.1016/j.snb.2012.04.003. [DOI] [Google Scholar]
- 44.Wasisto HS, Zhang Q, Merzsch S, Waag A, Peiner E. A phase-locked loop frequency tracking system for portable microelectromechanical piezoresistive cantilever mass sensors. Microsyst. Technol. 2014;20:559–569. doi: 10.1007/s00542-013-1991-9. [DOI] [Google Scholar]
- 45.Wasisto HS, et al. Portable cantilever-based airborne nanoparticle detector. Sensors Actuators B Chem. 2013;187:118–127. doi: 10.1016/j.snb.2012.09.074. [DOI] [Google Scholar]
- 46.Wasisto HS, Merzsch S, Uhde E, Waag A, Peiner E. Handheld personal airborne nanoparticle detector based on microelectromechanical silicon resonant cantilever. Microelectron. Eng. 2015;145:96–103. doi: 10.1016/j.mee.2015.03.037. [DOI] [Google Scholar]
- 47.Bertke M, et al. Analysis of asymmetric resonance response of thermally excited silicon micro-cantilevers for mass-sensitive nanoparticle detection. J. Micromechanics Microengineering. 2017;27:064001. doi: 10.1088/1361-6439/aa6b0d. [DOI] [Google Scholar]
- 48.Xu J, Bertke M, Wasisto HS, Peiner E. Piezoresistive microcantilevers for humidity sensing. J. Micromechanics Microengineering. 2019;29:053003. doi: 10.1088/1361-6439/ab0cf5. [DOI] [Google Scholar]
- 49.Stranz A, et al. Production of vertical nanowire resonators by cryogenic-ICP–DRIE. Microsyst. Technol. 2013;20:759–767. [Google Scholar]
- 50.Wasisto HS, et al. Femtogram aerosol nanoparticle mass sensing utilising vertical silicon nanowire resonators. Micro Nano Lett. 2013;8:554–558. doi: 10.1049/mnl.2013.0208. [DOI] [Google Scholar]
- 51.Wasisto HS, et al. Silicon resonant nanopillar sensors for airborne titanium dioxide engineered nanoparticle mass detection. Sensors Actuators, B Chem. 2013;189:146–156. doi: 10.1016/j.snb.2013.02.053. [DOI] [Google Scholar]
- 52.Wasisto HS, et al. Evaluation of photoresist-based nanoparticle removal method for recycling silicon cantilever mass sensors. Sensors Actuators, A Phys. 2013;202:90–99. doi: 10.1016/j.sna.2012.12.016. [DOI] [Google Scholar]
- 53.Huang W, et al. Highly sensitive formaldehyde sensors based on polyvinylamine modified polyacrylonitrile nanofibers. RSC Adv. 2013;3:22994. doi: 10.1039/c3ra44671a. [DOI] [Google Scholar]
- 54.D’Amelia, R. P., Gentile, S., Nirode, W. F. & Huang, L. Quantitative Analysis of Copolymers and Blends of Polyvinyl Acetate (PVAc) Using Fourier Transform Infrared Spectroscopy (FTIR) and Elemental Analysis (EA). World J. Chem. Educ. 4, 25–31 (2016).
- 55.Li, Y. & Ren, S. Adhesives. In Building Decorative Materials 325–341, 10.1533/9780857092588.325 (Elsevier, 2011).
- 56.Long GL, Winefordner JD. Limit of detection. A closer look at the IUPAC definition. Anal. Chem. 1983;55:712A–724A. doi: 10.1021/ac00259a060. [DOI] [Google Scholar]
- 57.Markiewicz N, et al. Micro light plates for low-power photoactivated (gas) sensors. Appl. Phys. Lett. 2019;114:053508. doi: 10.1063/1.5078497. [DOI] [Google Scholar]
- 58.Casals Olga, Markiewicz Nicolai, Fabrega Cristian, Gràcia Isabel, Cané Carles, Wasisto Hutomo Suryo, Waag Andreas, Prades Joan Daniel. A Parts Per Billion (ppb) Sensor for NO2 with Microwatt (μW) Power Requirements Based on Micro Light Plates. ACS Sensors. 2019;4(4):822–826. doi: 10.1021/acssensors.9b00150. [DOI] [PubMed] [Google Scholar]
- 59.Wang X, et al. Functionalized nanoporous TiO2fibers on quartz crystal microbalance platform for formaldehyde sensor. Sensors Actuators, B Chem. 2012;171–172:658–665. doi: 10.1016/j.snb.2012.05.050. [DOI] [Google Scholar]


