

SUMMARY
Mammals evolved in the face of fluctuating food availability. How the immune system adapts to transient nutritional stress remains poorly understood. Here, we show that memory T cells collapsed in secondary lymphoid organs in the context of dietary restriction (DR) but dramatically accumulated within the bone marrow (BM), where they adopted a state associated with energy conservation. This response was coordinated by glucocorticoids and associated with a profound remodeling of the BM compartment, which included an increase in T cell homing factors, erythropoiesis, and adipogenesis. Adipocytes, as well as CXCR4-CXCL12 and S1P-S1P1R interactions, contributed to enhanced T cell accumulation in BM during DR. Memory T cell homing to BM during DR was associated with enhanced protection against infections and tumors. Together, this work uncovers a fundamental host strategy to sustain and optimize immunological memory during nutritional challenges that involved a temporal and spatial reorganization of the memory pool within “safe haven” compartments.
In Brief
Calorie restriction triggers memory T cell homing to the bone marrow to promote survival and enhanced protective function.
Graphical Abstract

INTRODUCTION
Host survival depends on the ability to adapt to challenges in a way that sustains and protects fundamental physiological processes. Immunological memory is a cardinal feature of the adaptive immune system, which confers a survival advantage by allowing the host to rapidly and effectively control subsequent challenges. Such responses rely on the ability of memory T cells to persist long term, which can be divided into circulating and resident subsets. Circulating cells include central, effector, and peripheral memory T cells (TCM, TEM, and TPM) (Gerlach et al., 2016; Sallusto et al., 1999) that are required for bodywide immunosurveillance, whereas tissue resident memory cells (TRM) are essential for initiating and amplifying local responses (Jameson and Masopust, 2018; Mueller and Mackay, 2016). At steady state, memory T cell homeostasis is under the control of various cytokines, transcription factors, and metabolic fuels (Buck et al., 2016; Cui et al., 2015; Kaech and Cui, 2012; Pan et al., 2017; Surh and Sprent, 2008). However, these long-lived cells are faced with numerous challenges throughout the life of the host, including their persistence and maintenance of protective function during stress and reduced nutritional availability. Indeed, food accessibility was and can remain highly contingent on encounters with distinct environments and climatic conditions. Thus, mechanisms may have evolved to ensure that the host can adapt and thrive in situations where calories and nutrients are limited. Of interest, caloric restriction or dietary restriction (DR) has been shown to promote various aspects of host fitness, including the improvement of metabolic profiles, prevention of cellular aging, and reduced incidence of cancer (NikolichZugich and Messaoudi, 2005; Redman et al., 2018; Robertson and Mitchell, 2013; Speakman and Mitchell, 2011). However, the consequence of DR on the memory T cell compartment remains to be addressed.
Due to the importance of memory T cells for host survival, defined strategies or compensatory mechanisms may be in place to sustain these cells in the context of nutritional challenges. Of relevance, we and others have found that white adipose tissue (WAT) is a reservoir for memory T cells (Han et al., 2017; Masopust et al., 2001). While WAT is reduced during DR, the bone marrow (BM) paradoxically shows increased adipogenesis in this context (Cawthorn et al., 2014; Devlin et al., 2010). These observations raised the possibility that an alliance between defined tissue compartments may serve the purpose of preserving immunological memory in the face of nutritional challenges.
Here, we show that DR induces a whole-body response, resulting in the collapse of circulating memory T cell populations in secondary lymphoid organs (SLOs) and blood but enhanced accumulation in BM. Such a response was associated with profound remodeling of the BM compartment, with increases in adipocytes and T cell trophic factors. The ability of memory T cells to accumulate in BM not only protected the memory pool from inhospitable conditions during DR, but also optimized their function in the face of secondary challenges. Altogether, this work uncovers a fundamental host strategy to adapt to physiological nutritional challenges, which are associated with a temporal and spatial reorganization of the memory pool within “safe haven” tissue compartments.
RESULTS
Memory T Cells Accumulate in the Bone Marrow during Dietary Restriction
To assess the fate of memory T cells in the context of a transient reduction in nutrition, mice were placed on DR, which involved receiving 50% of their daily food intake. This resulted in approximately 10%–15% weight loss (Figure S1A) and a reduction in fat mass (Figure S1B) after 1 week, followed by a plateau (Figures S1A and S1B). DR caused a decrease in SLO cellularity (Figure S1C), resulting in a decrease in number of antigen-experienced CD8+ and CD4+ T cells (Figures 1A, S1D, and S1E), as well as regulatory T cells (Treg), natural killer (NK) cells, and mature B cells (Figures S1D and S1F–S1H). A similar decrease was observed in blood and WAT (Figures 1A and S1E–S1H). Thus, DR is associated with a rapid and profound collapse of antigen-experienced T cells in the periphery, raising the possibility that memory T cells may redistribute to a distinct niche under these conditions.
Figure 1. Memory T Cells Accumulate in BM during DR.

(A) Number of CD8+ CD44+ T cells in spleen (spl), cervical lymph node (cLN), blood, and gonadal adipose tissue (GAT) over time during 50% DR.
(B) Number of CD8+ CD44+ T cells in femur BM of mice on DR over time.
(C) Confocal microscopy of CD4+ (magenta) and CD8+ (yellow) T cells in BM after 3 weeks of DR.
(D) Number of CD8+ CD44+ T cells in BM from tibia, skull, thoracic vertebrate, humerus, and ilium of mice on DR for 3–6 weeks.
(E) Mice were infected and 4 weeks later put on DR for 4–6 weeks.
(F and G) (F) Number of memory CD8+ T cells in GAT, spl, and BM specific for the YopE antigen of Yersinia pseudotuberculolsis or (G) the nucleoprotein antigen of influenza A virus after 4–6 weeks of DR. (legend continued on next page)
(H) Number of CD8+ CD44+ T cells in BM and spl of mice fed the indicated diet ad libitum or at 50% restriction for 3 weeks.
(I) Number of CD8+ CD44+ T cells in BM and spl of mice on DR for 3 weeks or on DR for 3 weeks then refed ad libitum for a further 1 or 3 week(s). Each symbol represents an individual mouse. Data show the mean representative of four (C) or pooled from two to four experiments (A, B, D, and F–I) with two to five mice per group. *p < 0.05, **p < 0.01, ***p < 0.001, ****p < 0.0001; two-tailed unpaired Student’s t test. See also Figure S1.
In contrast to other compartments examined, antigen-experienced CD8+ and CD4+ T cells were significantly increased in BM during DR (Figures 1B, 1C, and S1E). Lymphocyte redistribution occurred by 1 week following the initiation of DR and was stable for at least 6 weeks (Figure 1B). Accumulation of antigen-experienced CD8+ T cells occurred across the entire BM compartment, with an increase of T cells observed in BM from the femur, tibia, skull, vertebrate, humerus, and ilium during DR (Figures 1B–1D). Such an increase was selective to memory T cells, as the number of Treg, NK cells, mature B cells, and plasma cells in BM was preserved during DR but not increased (Figures S1F–S1I).
To determine whether memory T cells induced following infection redistributed during DR, we tracked antigen-specific responses following an oral infection with Yersinia pseudotuberculosis ΔyopM (Yptb ΔyopM) (Han et al., 2017) or an intranasal infection with influenza A virus (A/PR/8/34). Following pathogen clearance and the establishment of memory (4 weeks), mice were placed on DR (Figure 1E), showing that these pathogen-specific memory CD8+ T cells were reduced in spleen and WAT but found at higher numbers in BM during DR (Figures 1F and 1G).
We next assessed whether a reduction in calories alone was responsible for memory T cell redistribution during DR or if defined nutrients played a role. To this end, we designed diets that when given at 50% restriction would contain normalized levels of vitamins and minerals (V&M), essential amino acids (EAA), or total protein. Normalizing V&M, EAA, or total protein still induced memory T cell redistribution to BM, while reducing calories alone was sufficient to drive the response (Figure 1H). Further, accumulation of memory T cells in BM during DR was reversible, with the steady-state number rapidly restored in BM and spleen upon refeeding (Figure 1I). Collectively, these results indicate that memory T cells collapse in SLO and blood but rapidly and reversibly accumulate in the BM compartment in response to a reduction in calories.
Circulating Memory T Cells Accumulate in Bone Marrow but Maintain the Ability to Recirculate during Dietary Restriction
Several memory T cell populations exist and are characterized by distinct migratory patterns and functional potential. DR induced a decrease in the memory T cell subsets found in SLO and WAT (Figure 2A). In contrast, the number of TCM and TEM was significantly increased in BM during DR, whereas T cells expressing a TRM or TPM phenotype were sustained (Figures 2B and S2A). The expression of the canonical memory markers CD127 (interleukin [IL]-7Rα), CD122 (IL-2Rβ/IL-15Rβ), CD25 (IL-2Rα), and CD62L (L-selectin), and transcription factors T-BET and EOMES, was similar between TCM and TEM from mice fed ad libitum or on DR (Figures S2B–S2G). Thus, DR preferentially promoted the accumulation of TCM and TEM in the BM.
Figure 2. Circulating Memory T Cells Accumulate in BM during DR.

(A) Number of CD8+ TCM (CD44+ CD62L+ CD69−), TEM (CD44+ CD62L− CD69−), and TRM (CD44+ CD62L− CD69+) in the indicated tissue of mice on DR for 3–4 weeks.
(B) Plot showing CD62L and CD69 expression by CD8+ CD44+ cells in BM. Number of the indicated subset in BM from mice on DR for 3–4 weeks.
(C) Purified CD8+ CD44+ T cells were transferred into hosts fed ad libitum or on DR. Number of transferred cells in BM and spl after 1 week is shown.
(D) Congenically distinct mice were put on DR for 1 week and joined to form parabiotic pairs then maintained on DR for 3 weeks. Control pairs were fed ad libitum throughout.
(E) Frequency of host-derived memory T cells in spl and BM from (D).
(F) In vitro activated OT-I mTomato+ T cells (pseudocolored green) were transferred into hosts fed ad libitum or on DR for 3 weeks and skull BM was imaged 1 week later. Images show representative frames. Bottom images show track displacement length from 0–25 or more μm. (legend continued on next page)
(G) Speed and track displacement length of OT-I cells in skull BM of mice on DR.
Each symbol represents an individual mouse except for (F), in which each symbol represents an individual cell. Data show the mean pooled from two (A, C, and E) or three experiments (B and G) or representative of three experiments (F). **p < 0.01, ***p < 0.001, ****p < 0.0001; ns, not significant. Two-tailed unpaired Student’s t test. ND, not detected. See also Figure S2 and Video S1.
CD8+ T cells (isolated ex vivo or pre-activated in vitro) intravenously transferred into recipient mice on DR were found at reduced numbers in the spleen but were increased in BM compared to mice fed ad libitum (Figures 2C and S2H), supporting the idea that BM accumulation was the result of cellular redistribution. In line with this, memory T cells in BM during DR did not show increased levels of homeostatic proliferation (Figure S2I). In fact, the rate of proliferation during DR was significantly lower as compared to mice fed ad libitum (Figure S2I). On the other hand, memory T cells vigorously proliferated when mice on DR were re-fed ad libitum, which was particularly pronounced in the TCM subset (Figure S2I). As such, TCM may be critical to restore the memory T cell compartment following the restoration of calories.
The major function of circulating memory T cells is immunosurveillance. To assess whether circulating memory T cells permanently accumulated in BM during DR or if they retained the capacity to migrate, we performed parabiotic surgery on mice that had been on DR for 1 week prior to surgery and for the remainder of the experiment or control mice that were fed ad libitum throughout (Figure 2D). By 3 weeks post surgery, circulating memory T cell populations in the spleen and BM were in migratory equilibrium, while TRM cells in BM maintained their tissue-residency status (Figure 2E). This was the case both in parabiotic pairs fed ad libitum and those on DR, indicating that circulating memory T cells retained the ability to migrate in the context of DR and that the increase in number of T cells within the BM was associated with transient, rather than permanent, accumulation.
We next assessed the motility of individual T cells in BM by intravital imaging. To this end, we transferred in vitro activated mTomato+ OT-I cells and performed two-photon imaging on skull BM. More T cells were observed within the BM of mice on DR compared to mice fed ad libitum (Figure 2F). The behavior of T cells was impacted by DR, evidenced by significantly reduced speed and track displacement length compared to T cells in BM of mice fed ad libitum (Figures 2F and 2G; Video S1). Collectively, these results support the idea that circulating memory T cells maintain their ability to migrate in the context of DR but display enhanced dwell time within the BM compartment.
Glucocorticoids Promote the Accumulation of Circulating Memory T cells in Bone Marrow during Dietary Restriction
The accumulation of memory T cells in BM suggested that this niche provided a survival advantage in the context of DR. DR is associated with responses aimed at restoring energy balance, a process dominantly coordinated by glucocorticoids (GCs) (Cain and Cidlowski, 2017). However, heightened levels of GC can promote T cell death (Fujita et al., 2002; Wing et al., 1988). We found that while GCs were elevated in the blood of mice on DR compared to those fed ad libitum, the concentration of GC in BM was significantly lower both at baseline and during DR (Figure 3A). In agreement, the frequency of dead (DAPI+) memory T cells was increased in the spleen of mice early post DR but was lower in BM both at steady state and during DR (Figure 3B). Circulating memory T cells in the BM also expressed higher levels of the anti-apoptotic factor BCL-2 during DR (Figures 3C and S3A), suggesting that this compartment can promote memory T cell survival in the context of nutritional stress.
Figure 3. GCs Drive Memory T Cells into BM during DR.

(A) Concentration of corticosterone in serum and theextracellular environment of BM in mice on DR for 3 weeks.
(B) Frequency of DAPI+ cells in spl and BM of mice on DR for 1 week.
(C) BCL-2 expression by BM TCM in mice fed ad libitum (blue) or on DR (red) for 3 weeks.
(D) Mice received sham surgery or an adrenalectomy (ADX) 1 week prior to being put on DR for 1 week. Graphs show number of TCM in spl and BM.
(E and F) (E) Number of TCM in spl and BM and (F) BCL-2 expression by these cells in mice fed ad libitum that were administered veh (blue) or dex (red) daily for 2 weeks.
(G) WT or Nr3c1fl/fl x Lck-Cre mice (Cre−; WT, Cre+; Nr3c1−/−) CD8+ CD44+ T cells were transferred into mice fed ad libitum or on DR for 3 weeks. Cells were enumerated 1 week post transfer.
Graphs show transferred cells recovered in spl and BM, expressed as the fold-change in DR mice over the average number found in mice fed ad libitum. Each symbol represents an individual mouse. Data show the mean, pooled from 3 (A) or 2 (B–G) experiments. **p < 0.01, ***p < 0.001, ****p < 0.0001, ns; not significant. Two-tailed unpaired Student’s t test. See also Figure S3.
To directly address a role for GC in orchestrating memory T cell redistribution during DR, we placed mice lacking adrenal glands (adrenalectomy or ADX) on DR (Fujita et al., 2002; Wing et al., 1988). Under this setting, memory T cells did not collapse in SLO, nor did they accumulate in BM (Figures 3D and S3B). Furthermore, administration of the synthetic GC dexamethasone (Dex) reproduced the phenotype seen during DR, with a reduction of TCM in the spleen and an increase in BM (Figure 3E). While Dex treatment resulted in increased expression of BCL-2 by both subsets in BM (Figures 3F and S3C), its impact in terms of redistribution was more pronounced on TCM than TEM (Figures 3E and S3D), suggesting that these cells may have different levels of sensitivity to GCs.
We next transferred CD8+ T cells from wild-type (WT) mice or those lacking the Nr3c1 gene that encodes the GC receptor (Mittelstadt et al., 2012) into mice fed ad libitum or on DR. Approximately half the number of WT cells could be recovered 1 week post transfer in the spleen of mice on DR when compared to the number of WT cells in the spleen of mice fed ad libitum (Figure 3G). In contrast, the number of Nr3c1−/− T cells was not reduced in the spleen of mice on DR compared to the number in the spleen of mice fed ad libitum (Figure 3G). On the other hand, WT and Nr3c1−/− T cells were both able to accumulate in the BM to a similar degree during DR (Figure 3G). Together, these results support the idea that a direct interaction between GCs and the GC receptor on T cells promoted their peripheral collapse during DR, while GCs induce T cell accumulation in the BM indirectly.
Bone Marrow Remodeling during Dietary Restriction Promotes Enhanced Recruitment and Retention of Memory T Cells
Our results supported the idea that the BM milieu was impacted in a way that promoted the accumulation and survival of memory T cells during DR. Whole-tissue RNA sequencing revealed that the BM was profoundly remodeled during DR, with 3,981 genes significantly upregulated and 4,173 genes downregulated compared to mice fed ad libitum (Figure 4A). The most prominent changes involved the upregulation of genes associated with adipogenesis, whereas those involved in B cell development were downregulated (Figure 4A). Of note, cytokines involved in memory T cell homeostasis (IL-7 and IL-15) were not differentially expressed (Figure S4A).
Figure 4. BM Remodeling during DR Promotes Memory T Cell Recruitment and Retention.
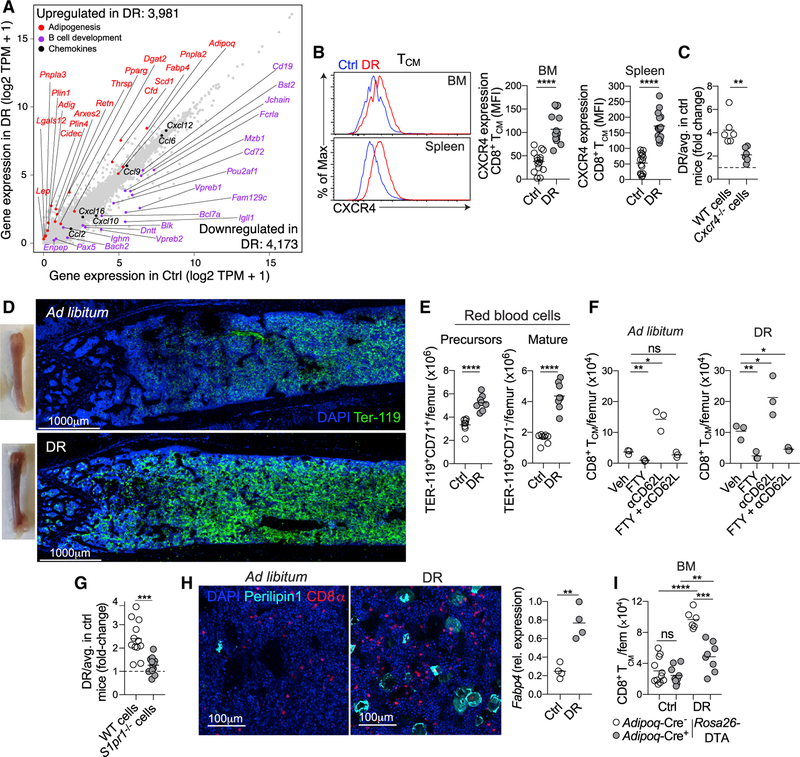
(A) Scatterplot showing gene expression of whole-BM samples from mice fed ad libitum or on DR for 3 weeks. TPR, transcripts per million.
(B) CXCR4 expression by TCM in BM and spl of mice fed ad libitum (blue) or on DR (red).
(C) CD8+ T cells from Cxcr4fl/fl 3 UBC-CreERT2 (Cre; WT, Cre+; Cxcr4−/−) mice treated with tamoxifen were in vitro activated and transferred into mice fed ad libitum or on DR for 3 weeks. Analysis was performed 1 week post transfer. Graphs expressed in the same way as 3G.
(D) Images of BM from mice on DR for 3 weeks, showing TEr-119 (green) and DAPI (blue).
(E) Number of RBC (CD71+ precursors and CD71− mature cells) in BM of mice on DR for 3 weeks.
(F) Number of CD8+ TCM in BM after 1 week of DR treated with FTY720 (FTY), an anti-CD62L antibody, or a combination of both. Treatment commenced at same time as initiation of DR.
(G) CD8+ T cells from S1pr1fl/fl x UBC-CreERT2 (Cre−; WT, Cre+; S1pr1−/−) mice that had been treated with tamoxifen were activated in vitro and transferred into mice fed ad libitum or on DR for 3 weeks. Graph expressed in same way as 3G.
(H) Image showing BM of mice on DR for 3 weeks, staining for adipocytes by PERILIPIN-1 (cyan), CD8+ T cells (red), and DAPI (blue). Graph shows Fabp4 gene expression in whole BM as determined by qPCR.
(I) Adipoq-CreERT2 3 Rosa26-DTA mice were put on DR for 2 weeks, treated with tamoxifen, and then maintained on DR for 3 weeks. Graph shows the number of CD8+ TCM in BM.
Each symbol represents an individual mouse except for (A), in which each symbol represents an individual gene. Data show the mean representative of at least two (D, F, and H) or pooled from two (C, E, and I) or three (A, B, and G) experiments with three to five mice per group. *p < 0.05, **p < 0.01, ***p < 0.001, ****p < 0.0001; two-tailed unpaired Student’s t test. ns, not significant. See also Figure S4.
In regard to T cell homing, several chemokines were differentially expressed in the BM during DR (Figure 4A). This included Cxcl12, previously shown to promote T cell migration to the BM (Mazo et al., 2005), which was abundantly expressed at baseline and modestly increased during DR (Figures 4A and S4B). Of interest, CXCR4, the receptor for CXCL12, was increased on the surface of TCM and TEM during DR (Figures 4B and S4C). To assess a role for this axis in promoting T cell migration to BM during DR, pre-activated WT CD8+ T cells or those lacking Cxcr4 were adoptively transferred into mice fed ad libitum or on DR. This showed that CD8+ T cells lacking Cxcr4 had a reduced ability to home to the BM compared to WT cells (Figure 4C). Furthermore, memory T cells were reduced in number in BM during DR following treatment with an inhibitor of CXCR4 (AMD3100) (Figure S4D). Thus, enhanced T cell accumulation within the BM (via recruitment and/or retention) during DR was controlled by a CXCR4-CXCL12 axis.
A striking component of the BM remodeling during DR was an increase in red blood cells (RBCs), which we observed macroscopically and by confocal imaging (Figure 4D). This was confirmed by flow cytometry, which revealed an increase in both precursor (TER-119+ CD71+) and mature (TER-119+ CD71−) RBCs (Figure 4E). In agreement with previous work (Flygare et al., 2011; Zhang et al., 2013), mice fed ad libitum that were treated with Dex showed enhanced erythropoiesis (Figure S4E). Mature RBCs are the major source of sphingosine-1phosphate (S1P) in the blood (Hänel et al., 2007; Pappu et al., 2007), a molecule that plays a critical role in controlling T cell migration (Cyster and Schwab, 2012). RBCs can also store and release chemokines and cytokines (Karsten et al., 2018a; Karsten et al., 2018b), suggesting that increased numbers of RBCs may contribute to T cell accumulation in the BM during DR.
To determine a role for S1P-S1P1R (S1P receptor 1) in retaining memory T cells in BM during DR, mice were treated with FTY720, which prevents migration toward S1P (Matloubian et al., 2004). This treatment resulted in reduced T cell numbers in BM of both control and DR mice (Figures 4F and S4F). As FTY720 promotes accumulation of T cells in lymph node (LN) (Mandala et al., 2002), we could not exclude that reduced accumulation in BM was due to impaired egress from LN. To circumvent this, mice were treated with both FTY720 and an anti-CD62L antibody, the latter restricting access to LN (Harp et al., 2010). Anti-CD62L treatment alone resulted in an increase in T cell numbers in BM (Figure 4F), presumably due to an inhibition of LN entry. In mice on DR (but not in mice fed ad libitum) treated with both FTY720 and the anti-CD62L antibody, the number of TCM in BM was significantly reduced compared to vehicle treated DR mice (Figure 4F). Further, transfer of pre-activated CD8+ T cells lacking the S1P1R showed reduced accumulation in BM of mice on DR (Figure 4G). Together, these results supported the idea that CXCR4-CXCL12 and S1P-S1P1R contributed to increased recruitment and/or retention of circulating memory T cells in BM during DR.
DR is associated with increased adipogenesis in the BM (Cawthorn et al., 2014; Devlin et al., 2010). This was confirmed by an increase in cells expressing PERILIPIN-1, a marker of lipid droplets, in BM of mice on DR, as well as increased expression of the adipocyte gene Fabp4 (Figures 4A and 4H). To determine if BM adipocytes contributed to memory T cell survival or accumulation, we generated mice in which adipocytes could be inducibly deleted (Adipoq-CreERT2 × Rosa26-DTA). These mice were placed on DR for 2 weeks before tamoxifen treatment then maintained on DR for an additional 3 weeks. A reduction in BM adipocytes was confirmed by reduced expression of Fabp4 in whole-BM samples (Figure S4G). In mice with reduced adipocytes, TCM were unable to efficiently persist in BM during DR, suggesting a direct role for BM adipocytes in promoting memory T cell retention or survival in this compartment (Figure 4I). Previous work suggested that memory T cell survival depends on long-chain fatty acids (LC-FAs) to fuel mitochondrial fatty-acid oxidation (FAO) (O’Sullivan et al., 2014; Pan et al., 2017; Pearce et al., 2009). However, memory T cells in the BM of mice on DR were comparable in their ability to take up and store lipids compared to cells in the BM of mice fed ad libitum (Figures S4H and S4I).
Collectively, these data show that DR is associated with a complex set of alterations within the BM, which is associated with an increase in chemokines, RBC, and adipocytes, all of which have the potential to promote circulating memory T cell accumulation within the BM niche.
Memory T Cells Are in a State of Energy Conservation during Dietary Restriction
We next assessed whether memory T cells had undergone intrinsic adaptations to maximize long-term survival during DR. Principal-component analysis (PCA) of mRNA expression by TCM from BM and spleen revealed that the majority of the variance could be explained by the nutritional status of the host (PC1, 24.29%), while effects of the tissue also had an effect on gene expression (PC2, 12.87%) (Figure S5A). Pathway analysis by gene ontogeny (GO) terms and gene set enrichment analysis (GSEA) revealed an enrichment for pathways associated with heat-shock protein chaperone binding and regulation of protein folding in TCM from both BM and spleen of mice on DR (Figures 5A and 5B). In agreement with unaltered fatty-acid metabolism in the context of DR (Figures S4H and S4I), we did not observe an enrichment in pathways associated with lipid metabolism (Figures 5A and 5B). Of interest, genes associated with amino-acid deprivation and the cellular response to rapamycin, a negative regulator of the mechanistic target of rapamycin (mTOR), fell within the protein folding module (Figures 5A and 5B), supporting the idea that TCM may have reduced levels of mTOR signaling during DR.
Figure 5. Memory T Cells Are in a State of Energy Conservation during DR.

(A and B) CD8+ TCM were sorted from spl and BM of mice fed ad libitum or on DR for 3 weeks for RNA sequencing. (A) GO terms and (B) GSEA from genes upregulated in TCM from BM (blue) or spl (green) of mice on DR.
(C and D) (C) OCR and (D) SRC in TCM from SLO and BM of mice on DR for 3 weeks.
(E) Expression of phosphorylated mTOR2448, S6240/244, and AKT473 in TCM from spl and BM of mice on DR for 3 weeks.
Each symbol represents an individual mouse except for (C), which is pooled from 10–15 mice. Data are expressed as mean, or mean ± SD, pooled from three biological replicates with five mice per group (A and B), representative of 3 (C), or pooled from three to four experiments (D and E). *p < 0.05, ***p < 0.001, ****p < 0.0001; ns, not significant. Two-tailed unpaired Student’s t test. See also Figure S5.
mTOR is a protein kinase that functions in larger multiprotein complexes known as mTOR complex 1 (mTORC1) and mTOR complex 2 (mTORC2) (Saxton and Sabatini, 2017). Reduced mTOR signaling promotes survival during nutrient deprivation by decreasing anabolic processes and promoting those that are catabolic (Aramburu et al., 2014). In agreement, TCM in both the BM and SLO of mice on DR showed reduced oxygen consumption rate (OCR) (Figure 5C) and spare respiratory capacity (SRC) (Figure 5D), suggesting that memory T cells were in a state of reduced metabolic activity or quiescence during DR. Examination of mTOR in TCM from BM of mice on DR showed reduced phosphorylation at serine 2448 (Figure 5E), indicating a reduction in mTOR activity. Further, TCM from the BM of mice on DR showed reduced phosphorylation of ribosomal protein S6 (pS6) at serine 240/244 and AKT at serine 473, downstream targets of mTORC1 and mTORC2, respectively (Figure 5E). Of note, mTOR downregulation was more pronounced in TCM from BM compared to those in the spleen in the context of DR (Figure 5E), supporting the idea that circulating memory T cells may integrate local cues when in BM to adopt a program compatible with energy conservation or quiescence.
Memory T Cells Mediate Enhanced Protection against Secondary Challenges during Dietary Restriction
The low metabolic activity of memory T cells during DR and their BM tropism begged the question of whether mice on DR could rapidly respond to secondary challenges. To address this, we first employed a model of acute oral infection with Yptb ΔyopM in which rapid clearance of the microbe is associated with the induction of a robust population of memory CD8+ T cells (Han et al., 2017). To investigate circulating memory T cells, naive or previously infected mice were first challenged intravenously (i.v.) with the virulent WT strain of Yptb. At 2 days post primary infection, no difference was observed in bacterial burden between naive mice fed ad libitum or on DR (Figure 6A, columns A versus B). As expected, previously infected mice fed ad libitum showed enhanced protection compared to naive mice 2 days post secondary challenge (Han et al., 2017) (Figure 6A, columns A versus C). Antibody depletion in mice fed ad libitum revealed that memory CD8+ T cells played a role in mediating protection (Figure 6A, columns C versus E), whereas mice depleted of CD4+ T cells trended toward having defective protection, although this did not reach statistical significance (Figure 6A, columns C versus G). Next, mice received a primary infection and developed memory while fed ad libitum before being placed on DR for 3–4 weeks and then were challenged i.v. with WT Yptb. Remarkably, these mice on DR during the secondary challenge had an enhanced ability to control the infection, with approximately 500-fold fewer colony-forming units (CFUs) of Yptb per gram of spleen compared to previously infected mice fed ad libitum throughout (Figure 6A, columns C versus D). Enhanced protection was also observed in mice on DR during an oral secondary challenge with WT Yptb (Figure 6B). Thus, DR initiated post the establishment of memory resulted in significantly enhanced protective responses. On the other hand, mice on DR throughout both the primary and secondary infections displayed a similar ability to control a secondary infection as mice fed ad libitum (Figure S6A). Thus, the timing of DR was critical for the enhancement of secondary responses.
Figure 6. Memory T Cells Mediate Enhanced Protection against Secondary Challenges during DR.

(A) Mice that were naive or previously infected with the Yptb ΔyopM orally were put on DR for 3 weeks and challenged i.v. with the more virulent WT strain of Yptb. Bacterial burden was assessed in spl 2 days after challenge. CD4+ or CD8+ T cells were depleted prior to challenge in the indicated groups.
(B) Mice were infected with Yptb ΔyopM orally then 4 weeks later put on DR for 3 weeks. During DR, mice were challenged orally with WT Yptb. Bacterial burden was assessed in mesenteric lymph nodes 3 days after challenge.
(C) IFNγ production following PMA/ionomycin stimulation by Yptb-specific splenic memory CD8+ T cells at day 2 after i.v. challenge with WT Yptb.
(D) Mice previously infected with Yptb ΔyopM orally were put on DR for approximately 5 weeks. Two weeks into DR, mice were treated with FTY720 four times every other day followed by a 2-week period before i.v. challenge with WT Yptb. Bacterial burden was assessed in spl 2 days after challenge.
(E) Mice received naive pmel cells followed by an i.v. infection with vaccinia-hgp100. 1 month later, mice were put on 50% DR for 3 weeks and inoculated with B16 cells subcutaneously (s.c.). Mice were euthanized when tumors reached 15 mm × 15 mm.
(F) Circulating GCs are increased during DR, inducing memory T cell recruitment and retention in BM, a site with low levels of GCs. The BM is drasticallyremodeled during DR to contain increased adipocytes, RBCs, and CXCL12, which have the potential to maintain memory T cells in this niche. Once in BM during DR, memory T cells express optimal levels of BCL-2 and mTOR to promote survival. Upon secondary challenges, memory T cells have an enhanced ability to mediate protection during DR.
Each symbol represents an individual mouse. Data show the mean pooled from at least two (A, B, and E), 4 (C), or 3 (D) experiments. *p < 0.05, **p < 0.01, ***p < 0.001, ****p < 0.0001; ns, not significant. Two-tailed unpaired Student’s t test except for (E), which was performed by a log-rank (Mantel-Cox) test. See also Figure S6.
Increased protection was associated with an enhanced breadth of effector responses. Indeed, depletion of CD8+ (Figure 6A, columns E versus F) or CD4+ (Figure 6A, columns G versus H) T cells alone did not revert the enhanced protection afforded by DR. We found that enhanced protection was only reverted by the simultaneous depletion of both T cell subsets (Figure 6A, columns I versus J). This indicates that both subsets contribute to enhanced secondary responses during DR and are able to effectively compensate for each other in this context. Further, Yptb-specific memory CD8+ T cells isolated from the spleen had a greater potential to produce interferon (IFN)γ during DR (Figure 6C). Altogether, this indicates that memory T cells have enhanced functional capacity and ability to control secondary infections during DR.
We next assessed whether appropriate homing during DR contributed to the optimization of immunological memory. We previously showed that short-term treatment with FTY720 reduced the accumulation of T cells in BM (Figures 4F and S4F). Mice that had developed memory to Yptb were placed on DR for 2 weeks then treated over the course of 1 week with FTY720 followed by a period of 2 weeks before challenge (Figure 6D). Mice fed ad libitum throughout and treated with FTY720 had a similar bacterial burden to mice treated with vehicle (Figure 6D). In contrast, mice on DR that were treated with FTY720 no longer displayed enhanced protection (Figure 6D), suggesting that enhanced protection to secondary infections was lost during DR if memory T cells were even transiently restricted from gaining access to the BM.
To determine if enhanced memory T cell function during DR extended to other settings, we employed a model in which virally induced T cells provide control of melanoma (Overwijk et al., 2003). Mice received naive transgenic CD8+ pmel-1 cells that are specific for an epitope derived from the melanoma-associated antigen gp100 before being infected with a recombinant vaccinia virus that expresses human gp100 (VV-hgp100) (Figure 6E). 1 month later, a time at which gp-100-specific memory CD8+ T cells had formed, DR was initiated for 3 weeks, and mice were inoculated with B16 melanoma cells. All mice fed ad libitum without pmel-1 cells reached the experimental endpoint (15 mm × 15 mm) 26 days post tumor inoculation (Figure 6E, black line), and consistent with previous reports (Kalaany and Sabatini, 2009), DR alone provided a survival benefit (Figure 6E, blue). As previously shown (Xiao et al., 2011), infection with VV-hgp100 alone, without pmel-1 cells, did not provide additional benefit compared to controls (Figure 6E, magenta and green), whereas mice fed ad libitum that received both pmel-1 cells and VV-hgp100 had a survival benefit (Figure 6E, red), although the endpoint was reached by day 35 (Figure 6E, red). Critically, mice on DR that received both pmel-1 cells and VVhgp100 had the greatest survival rate (Figure 6E, orange), with approximately 15% of mice from this group being completely tumor free after more than 2 months (Figure 6E). These results indicate that DR may enhance the protective function of memory T cells in the context of both anti-bacterial and tumor immunity.
DISCUSSION
Host fitness depends on the ability to survive and adapt to changing environments. In these contexts, the long-term persistence of memory T cells is of the utmost importance. How the host responds in a way that prioritizes and protects defined branches of the immune system during nutritional stress remains poorly understood. Previous work supported the idea that the anorexic response following acute primary infections could promote host survival in defined contexts (Hart, 1988; Wang et al., 2016) and that a reduction in vitamin A results in decreased adaptive immunity but a compensatory increase in innate responses aimed at protecting barrier sites (Spencer et al., 2014). Consistent with a recent report (Contreras et al., 2018), we found that a physiological decrease in calories was associated with a complex set of alterations that resulted in the strategic protection of memory T cells within the BM (Figure 6F).
Our results supported the idea that this response was dominantly coordinated by the steroid hormones GCs, which play a critical role in the regulation of energy balance (Cain and Cidlowski, 2017). Here, we show that one of the consequences of GC-mediated accumulation of T cells in BM was to protect these cells from the detrimental effects of GCs themselves. While circulating memory T cells were particularly enriched within the BM, other key subsets, such as Treg cells, NK cells, and plasma cells, were preserved at this site during DR, supporting the idea that our findings may broadly apply to many keystone populations. In addition to its fundamental role in hematopoiesis, the BM is a site that circulating memory T cells traffic through at steady state (Becker et al., 2005; Chaix et al., 2014; Di Rosa and Gebhardt, 2016; Klonowski et al., 2004; Mazo et al., 2005; Pabst et al., 1986; Parretta et al., 2005). Under resting conditions, CXCR4-CXCL12 interactions contribute to the homing of memory T cells to BM (Mazo et al., 2005). Of relevance, GCs can upregulate CXCR4 expression by T cells (Besedovsky et al., 2014a, 2014b; Ghosh et al., 2009; Shimba et al., 2018), while reduced mTORC2 signaling also results in increased CXCR4 expression and sequestration of naive T cells in BM (Arojo et al., 2018). As such, our results support the idea that the CXCR4-CXCL12 axis dominantly contributes to T cell retention and/or accumulation within the BM during DR.
Protection of memory T cells within the BM was not associated with permanent sequestration but rather increased dwell time in a privileged site, a response that may result from the dramatic increase in erythropoiesis observed during DR. RBCs are the major source of S1P in blood (Hänel et al., 2007; Pappu et al., 2007), a molecule critical in orchestrating T cell migration (Cyster and Schwab, 2012). As such, an increase of RBC in BM may impact the local concentration of S1P within the BM, delaying the ability of T cells to re-acquire S1P1R and re-enter the circulation (Maeda et al., 2010). Furthermore, S1P may play an important role in the survival of T cells within the BM compartment during DR (Mendoza et al., 2017).
The role of GCs in coordinating these responses also supports the idea that our observation may be relevant to numerous forms of stress, promoting cell survival in the privileged environment of the BM. Conversely, this adaptive response may have detrimental consequences. Notably, in the context of glioblastoma, T cells were severely depleted from the periphery and tumor site but found at high numbers in BM, and as in our settings, S1P-S1P1R interactions contributed to this response (Chongsathidkiet et al., 2018). Thus, what may have evolved as a means to adapt to physiological alterations in food intake or stress may also be co-opted in the setting of cancer, depriving the tumor microenvironment of the adaptive immune repertoire.
We and others have shown that WAT is a hub for memory T cells (Han et al., 2017; Masopust et al., 2001). However, this compartment rapidly declines during DR, whereas the BM paradoxically becomes enriched in adipocytes (Cawthorn et al., 2014; Devlin et al., 2010). Under these settings, the BM acts as an endocrine organ that is critical for compensating for the loss of WAT in the periphery (Cawthorn et al., 2014). Further in alignment with WAT being a privileged site for memory T cells, ablation of adipocytes during DR reduced the ability of memory T cells to accumulate in BM. Of note, increased adipogenesis in BM occurs in several settings, such as irradiation and chemotherapy (Zhou et al., 2017), suggesting that this response could represent a general response following stress aimed at preserving physiological processes, including immunological memory.
An intriguing question that remains to be addressed is the nature of the adipocytes and adipocyte-derived fuels that develop in BM during DR. BM adipocytes express a complex gene signature associated with both white and brown adipocytes (Scheller et al., 2015, 2016). Reports indicate that memory T cells critically require FAO to fuel their metabolism and longterm survival (O’Sullivan et al., 2014; Pearce et al., 2009; van der Windt et al., 2012), although whether this is the case in vivo is unclear (Raud et al., 2018a, 2018b). The import of extracellular glycerol has been shown to be critical for this process in circulating memory T cells (Buck et al., 2016; Cui et al., 2015; O’Sullivan et al., 2014; van der Windt et al., 2012), while the survival of skin TRM requires uptake of exogenous lipids (Pan et al., 2017). We found that memory T cells in BM during DR did not have an enhanced ability to uptake, store, or process fatty acids. Indeed, unlike white adipocytes that undergo high rates of lipolysis, BM adipocytes undergo only minimal amounts of lipolysis (Scheller et al., 2019). As such, a key question that remains to be addressed is how BM adipocytes contribute to T cell survival and/or persistence in the BM niche during DR.
Our work supports the idea that memory T cells from hosts on DR had entered a state of energy conservation or quiescence that was associated with reduced mTOR signaling. When nutrients are abundant, mTORC1 is activated to stimulate anabolic processes that supports cell growth, whereas when these factors are reduced, mTORC1 signaling is suppressed, stimulating catabolic processes (Saxton and Sabatini, 2017). This places mTOR as a key rheostat that balances the metabolic profile of cells to align with the level of nutrients or stress within the host (Aramburu et al., 2014). Restricting the downregulation of mTOR under conditions of nutrient deprivation in vitro is detrimental for cell survival and function (Choo et al., 2010). Of relevance to our observation, reduced mTOR activity enhances memory T cell development, maintenance, and function (Araki et al., 2009). Consistent with this, mTOR inhibitors show promise in the clinic by enhancing vaccine responses and antiviral immunity (Mannick et al., 2018). As such, this phenomenon may provide a mechanistic link for our observation of enhanced protective responses in the context of DR.
Together, our work raises intriguing questions regarding the optimal state for immunological memory preservation and function. Access to a constant level of calories and nutrients is only a recent occurrence in high-income countries, and all animals have evolved in settings of variable food availability. As such, fluctuations in nutrition or intermittent fasting may represent the ideal state for supporting the function of memory T cells. Furthermore, understanding the nature of the factors within the BM milieu that potentially optimizes immunological memory could be utilized to improve and protect fundamental arms of the immune system in the context of disease.
STAR★METHODS
Detailed methods are provided in the online version of this paper and include the following:
LEAD CONTACT AND MATERIALS AVAILABILITY
Further information and requests for resources and reagents should be directed to and will be fulfilled by the Lead Contact, Yasmine Belkaid (ybelkaid@niaid.nih.gov).
EXPERIMENTAL MODEL AND SUBJECT DETAILS
Mice
C57BL/6NTac mice were purchased from Taconic Farms. B6.SJL-Ptprca/BoyAiTac (CD45.1), OT-I CD45.1 RAG−/− (OT-I) were obtained through the NIAID Taconic exchange program. C57BL/6-Tg(TcraTcrb)1100Mjb/J (OT-I) and B6.129(Cg)-Gt(ROSA)26Sortm4(ACTB-tdTomato,-EGFP)Luo/J (mTomato) mice were purchased from the Jackson Laboratories and crossed to generate mTomato OT-I mice. C57BL/6-Tg(Adipoq-cre/ERT2)1Soff/J and B6.129P2-Gt(ROSA)26Sortm1(DTA)Lky/J were purchased from Jackson laboratories and crossed to generate Adipoq-CreERT2 x Rosa26-DTA mice. B6Cg.Thy1a/Cy Tg(TcraTcrb)8Rest/J (pmel) were from the laboratory of N.P.R. All experiments involved female mice 6–23 weeks of age. Mice were bred and maintained under specific pathogen-free conditions at an American Association for the Accreditation of Laboratory Animal Care (AAALAC)-accredited animal facility at the NIAID and housed in accordance with the procedures outlined in the Guide for the Care and Use of Laboratory Animals. Cxcr4fl/fl x UBC-CREERT2 and S1pr1fl/fl x UBC-CREERT2 mice were housed at the Skirball institute animal facility. Experiments were performed under an animal study proposal (LISB-18E, 19E and 20E) approved by the NIAID Animal Care and Use Committee.
Cell lines
B16 melanoma cells (National Cancer Institute tumor repository) were cultured at 37C, 5% CO2 in complete media DMEM (GIBCO) with 10% FBS, 1% glutamine and 1% penicillin-streptomycin.
Bacteria and virus strains
Wild-type or mutant Yersinia pseudotuberculosis (32777) strains were grown from bacterial culture in 2X YT media at 25 degrees overnight. Mice were infected with 1 3 107 colony forming units (CFU) of Yptb ΔyopM via oral gavage (mice were fasted for 12 h prior). For secondary infections, mice were injected intravenously with 2 × 10² CFU WT Yptb and bacterial burden was assessed in the spleen 48 h later, or for an oral challenge, mice were gavaged with 5 × 10⁹ CFU WT Yptb and bacterial burden was assessed in the mesenteric lymph node after 72 h. Bacterial burden was determined by serial plating on MacConkey plates and colonies were counted after incubation at room temperature (RT) for 48 h.
For influenza infections, A/Puerto Rico/8/1934 (PR8) (originally obtained from Mount Sinai School of Medicine, strain H1N1) was grown in allantoic cavities of 10-day-old specific pathogen free (SPF) embryonated chicken eggs. Allantoic fluid was collected 48 h post infection and purified by differential centrifugation. Viral titers were determined by 50% tissue culture infective dose (TCID50) on MDCK cells using the Reed-Muench method. Mice were anesthetized using isoflurane and intra-nasally infected with PR8 at 5 TCID50 in 25 μL sterile saline solution supplemented with 0.1% BSA.
For experiments involving recombinant vaccinia virus expressing human-gp100 followed by a B16 challenge, mice initially received 3 × 10⁵ naive enriched pmel cells then were vaccinated intravenously with 1 × 10⁷ plaque-forming units of this virus. After one month, mice were randomly assigned to undergo DR for the remainder of the experiment or to remain being fed ad libitum. Following 3 weeks of DR, mice were inoculated subcutaneously with 7.5 × 10⁵ B16 cells and tumor burden was monitored over time. Mice were euthanized when tumors reached a size of 15 mm x 15 mm.
METHOD DETAILS
Dietary restriction
The daily intake of regular chow (LabDiet Advanced Protocol PicoLab Verified – 75 IF; 20% protein, 5% fat) by individually caged mice was determined by giving a defined amount of food and weighing the remainder daily for 2 weeks. From this, we found that individual mice consumed approximately 2.75 g of food per day, consistent with previous reports (Acosta-Rodríguez et al., 2017). This equates to an intake of roughly 11.4 kcal per day. As such, we provided 1.375 g of food to mice daily (5.7 kcal per day) to ensure 50% DR. Mice on DR consumed all the food provided. Diets in which specific factors were normalized were designed in consultation with a nutritionist (Envigo). These included the CR diet (only calories at 50%), in which everything (macromolecules, V & M, EAA) except for calories was doubled. Thus, when given at 50% restriction everything is normalized except calories. Normalized V & M diet, in which V & M were doubled. Thus, vitamins and minerals are normalized when given at 50% restriction. Normalized EAA diet, in which EAA were doubled. Thus, EAA are normalized when given at 50% restriction. Normalized total protein diet, in which total protein was doubled. Thus, total protein levels are normalized when given at 50% restriction.
Surgery
For experiments involving parabiotic surgery, mice were put on DR 1 week prior to surgery and then maintained on it for a further 3 weeks while conjoined. For the surgery, mice were anaesthetized with ketamine and xylazine and longitudinal incisions were made from the elbow to the knee joint of each mouse, which were then connected at the joints. The skin of the two animals was then sutured together. Adrenalectomy surgery was performed by Jackson laboratories.
Tissue processing and flow cytometry
Mice were euthanized with CO2, perfused via the left ventricle of the heart with 10 mL PBS before tissues were harvested and placed in cold PBS. Bone marrow was flushed using cold PBS and processed through a 70 μM filter. Spleen and lymph nodes were processed through a 70 μM filter. Blood was collected in heparinized tubes. White adipose tissue was chopped in digestion media containing DMEM with 1% low fatty acid BSA, 50 mM HEPES, Liberase TL (0.05 mg/mL) (Roche) and DNase I (0.25 mg/mL) (Sigma) and incubated for 25 min at 37C with agitation. The tissue was then filtered through a 70 μm filter. Cells were stained for flow cytometry for 15–30 min in PBS on ice. Antibodies for flow cytometry were purchased from eBioscience, BD Pharmingen or Biolegend and were conjugated to Pacific Blue, BV605, BV785, BV510, BV650, eFluor 450, APC, AlexaFluor 647, Pe-Texas Red, PE-CF594, FITC, PE, PerCPCy5.5, PECy7, APCCy7, APCe780, PerCPe710, BV421 or Alexa Flour 700. DAPI or Live/Dead fixable stain (Life Technologies) was used to identify dead cells in all experiments. Intracellular staining for transcription factors and cytokine producing cells was performed using BD intracellular staining kit or the eBiosciences FOXp3 staining kit. To determine cytokine production, cells were stimulated with phorbol myristate acetate (PMA) (50 ng/mL), ionomycin (1 mM), and BD GolgiPlug (BFA) (1 μL/mL) for 2.5 h at 37C before staining for flow cytometry. The following antibodies were used for staining of murine cells: CD4 (RM4–5), CD8β (H35–17.2), CD25 (PC61.5) T-BET (4B10), FEXP3 (FJK-16S), EOMES (Dan11mag), CXCR4 (2B11), TER-119 (TER-119), CD71 (R17217), BCL-2 (10C4), IFN-γ (XMG1.2), CD45 (30-F11), CD45.1 (A20), CD45.2 (104), CD69 (H1.2F3), CD127 (A7R34), CD90.2 (30-H12), TCRβ (H57–597), CD62L (MEL-14), CD44 (IM7), NK1.1 (PK136), γδTCR (GL3), B220 (RA3–6B2), CD122 (TMb1). Phosphostaining was performed using either the eBiosciences kit (for AKT473 and mTOR2448 - eBiosciences) or by methanol fixation (for pS6240/244 - Cell signaling technologies). For the latter, cells were first stained with surface antibodies, washed then treated with 4% PFA at RT for 10 min in PBS. Cells were then incubated with methanol at −20°C for 1 h or at 4°C overnight, followed by phospho-staining for 1 h on ice in the dark. BrdU staining was performed according to the manufacturers protocol (FITC BrdU flow kit - BD Biosciences). Flow cytometric data were acquired on an LSR II or LSR Fortessa (BD Biosciences) and analyzed using FlowJo software (Tree Star).
Confocal microscopy
To image whole-mounted bone marrow tissue, one side of the bone (femur or tibia) was cut open, fixed for 8–16 h in PLP-buffer at 4°C and left in 30% sucrose for another 10–16 h. Fixed bones were embedded in optical cutting temperature compound (OCT) over dry ice and stored at 80C. For staining, bones were trimmed 60–100 μm on a cryostat and collected by melting the OCT. Exposed bones were fixed again in 4% PFA for 30 min, blocked for 1 h at RT with 1% BSA, 0.25% Triton X-100, 1% Fc-Block. If rabbit anti-PERILIPIN-1 antibody (Abcam) was used, 10% normal goat serum was added in the blocking buffer. Antibodies (TER-119, CD8, CD4 are the same as used for flow cytometry) or nuclei stain (DAPI) were diluted in blocking buffer and tissues were stained for 1 h at RT, washed 3x in PBS and then imaged directly, or if PERILIPIN-1 was used, bones were incubated for 1 h at RT with the secondary antibody AF647 goat anti-rabbit IgG. Bones were imaged in a PBS filled 4-well chambered cover glass using an upright inverted confocal microscope from Leica (Leica TCS SP8). Imaris software (Bitplane) was used for all confocal image processing.
In vitro activation of CD8+ T cells and adoptive transfer
Spleen and lymph nodes from wild type and knock out mice were processed through a 70 μm filter, stained with an anti-CD8β antibody conjugated to PE then positively enriched using anti-PE microbeads (Miltenyi) and a magnetic column (Miltenyi). Cells were cultured in a 24-well plate coated with 5 μg anti-CD3 and anti-CD28 antibodies in complete media with 10 ng/mL IL-2. Cells were split on days 2 and 3, with 10 ng/mL IL-7 added for days 4 and 5 of culture. OT-I cells were isolated from spleen of OT-I mice (CD45.1 or mTomato+) background and activated with SIINFEKL peptide. 2–5 million cells were transferred intravenously via the retroorbital vein.
In vivo treatments
Dexamethasone (Sigma) was administered to mice fed ad libitum at a dose of 2 mg/kg i.p. every day for 2 weeks. For inducible gene deletion, 75 mg/kg tamoxifen (Sigma) in 90% corn oil: 10% ethanol for 5 consecutive days i.p. Experiments were performed 3 weeks after the final treatment. FTY720 (Sigma) was administered i.p. four times every other day at a dose of 1 mg/kg, with or without 0.5 mg of an anti-CD62L antibody (Mel-14, BioXcell). For AMD3100 (Sigma) experiments, mice were put on DR for 3 weeks then injected with 10 mg/kg subcutaneously for 4 consecutive days. 1 mg/kg BrdU (BD) was administered i.p. every day for 7 days prior to the experiment. Anti-CD4 (GK1.5, BioXcell) and anti-CD8 (2.34, BioXcell) was administered i.p. at a dose of 0.2 mg for three consecutive days prior to infection.
Ex vivo assays
Bodipy-C16 uptake assays were performed as previously described (Pan et al., 2017). LipidTOX (Thermofisher) staining was performed on BM cells after surface staining according the manufactures instructions.
RNA extraction, cDNA synthesis and Quantitative PCR
Whole bone marrow from femur or tibia was flushed in Trizol (Thermofisher). Total RNA extraction was performed with RNeasy mini kit (QIAGEN). DNase-treated total RNA (100 ng) was reverse transcribed into cDNA with Omniscript RT kit (QIAGEN) following manufacturer’s instructions. qPCR was performed using the Taq PCR Master Mix (Life Technologies) on a Quantstudio 6 Flex Real-Time PCR (Life Technologies).
RNA Sequencing
CD8+ TCM were sorted from the bone marrow and spleen of mice fed ad libitum or on DR. RNA was extracted using an Arcturus PicoPure RNA Isolation Kit (Applied Biosystems), as per manufacturer’s instructions. cDNA was synthesized with the Ultralow V4 kit (Clonetech) and sequencing libraries were subsequently prepared with the Nextera XT DNA prep kit (Illumina). RNA-seq reads were mapped with STAR (Dobin et al., 2013) to the mm10 reference genome with default parameters. Read counts were assessed with HOMER’s (Heinz et al., 2010) analyzeRepeats with the option rna and parameters -noadj -condenseGenes and -count exons for three replicates per condition. Differential gene expression was assessed with DESeq2 (Love et al., 2014) using HOMER’s getDiffExpression.pl using a false discovery rate (FDR) of 5% and a fold change of 1.5. Metascape (Tripathi et al., 2015) was used for analyzing enriched GO terms, and GSEA was used for gene set enrichment analysis. PCA was performed in R with prcomp, center = TRUE, scale. = TRUE. GEO accession number is GSE124063.
ELISA
Mouse corticosterone ELISA was performed according to the instructions of the manufacturer (Thermofisher). To obtain bone marrow extracellular fluid, femurs were flushed in approximately 2 mL of PBS, centrifuged and the supernatant was taken.
2-photon imaging and analysis
Mice fed ad libitum or on DR for 3 weeks received 20 × 106 mTomato+ OT-I cells i.v. and were imaged 1 week later. To image, mice were anesthetized with ketamine (85 mg/kg), xylazine (13 mg/kg), and acepromazine (2 mg/kg) in PBS and maintained at a core temperature of 37°C. 20 μg of an anti-CD31 AF647 antibody (clone EMC13.3, Biolegend) was injected i.v. to visualize vessels immediately before imaging. Two-photon imaging through a surgically thinned skull was adapted from methods previously described (Manglani and McGavern, 2018). Briefly, a metal bracket was glued to the skull such that the imaging window contained the frontal bone sutures. The skull was thinned to leave 25 μm of bone above the bone marrow. 3D time lapses were captured using a Leica SP8 two-photon microscope equipped with an 8,000-Hz resonant scanner, a 25 × color corrected water-dipping objective (1.0 NA), a quad HyD external detector array, a Mai Tai HP DeepSee Laser (Spectra-Physics) tuned to 905nm and an Insight DS laser (Spectra-Physics) tuned to 1050nm. The following dichroic mirrors were used for imaging studies: 495nm-LP, 562nm-LP, and 624-LP. Z-stacks were acquired at 8.5 sec intervals and consisted of 7 optical slices (3.5mm step size). A second harmonic signal was used to visualize skull bone. Cell speed and track displacement length of mTomato OT-I cells were obtained using Imaris software (Bitplane). ImageJ software was used to generate the supplemental movies.
Oxygen consumption flux evaluation
CD8+ CD44+ T cells were enriched via negative selection and sorted from secondary lymphoid organs or bone marrow of mice fed ad libitum or on DR. Real-time oxygen-consumption rate (OCR) in T cells were determined with an XF-96e Extracellular Flux Analyzer (Seahorse Bioscience); 3 × 10⁵ cells/well were used for each condition. Cell were previously attached by using Cell Tak (25 ug/mL). The assay was performed in XF DMEM pH = 7.4 supplemented with 2 mM glutamine, 25 mM glucose and 1mM pyruvate. Three consecutive measurements were performed under basal conditions and after the sequential addition of the following ETC inhibitors: 1 μM oligomycin, 1 μM FCCP, 1 μM rotenone and 1 μM antimycin A. Basal respiration rate (BRR) was defined as last rate measurement before the first injection. Maximal respiration rate (MRR) was defined as the maximal rate measurement after FCCP injection. Spare respiration capacity (SRC) was defined as the difference between MRR and BRR.
QUANTIFICATION AND STATISTICAL ANALYSIS
Groups were compared with Prism V8 software (Graphpad) using a two-tailed unpaired Student’s t test or Log-rank (Mantel-Cox) test where appropriate. Differences were considered to be statistically significant when p < 0.05. Data are expressed as mean, or mean ± SD. Refer to figure legends for the specific statistical tests used in each experiment. Sample sizes were determined based on previous experience with similar experiments.
DATA AND CODE AVAILABILITY
The datasets generated during this study can be found using the GEO accession number GEO: GSE124063.
Supplementary Material
KEY RESOURCES TABLE
| REAGENT or RESOURCE | SOURCE | IDENTIFIER |
|---|---|---|
| Antibodies | ||
| Anti-mouse B220, PE-CF594 (RA3–6B2) | BD | Cat# 562290; RRID:AB_11151901 |
| Anti-mouse BrDU, FITC | BD | 557891 |
| Anti-mouse CD4, BV605 (RM4–5) | Biolegend | BioLegend Cat# 100548; RRID:AB_2563054 |
| Anti-mouse CD8β, PE (H35–17.2) | eBioscience | Cat# 12–0083-82; RRID:AB_657767 |
| Anti-mouse CD8β, BV650 (H35–17.2) | BD | Cat# 740552; RRID:AB_2740253 |
| Anti-mouse CD16/32, purified (2.4G2) | Bio-X-Cell | Cat# CUS-HB-197; RRID:AB_2687830 |
| Anti-mouse CD25, AF488 (PC61.5) | eBioscience | Cat# 53–0251-82; RRID:AB_763472 |
| Anti-mouse CD31, AF647 (MEC13.3) | Biolegend | Cat# 102516; RRID:AB_2161029 |
| Anti-mouse CD44, PE-Cy7 (IM7) | eBioscience | Cat# 25–0441-82; RRID:AB_469623 |
| Anti-mouse CD44, AF700 (IM7) | eBioscience | Cat# 56–0441-82; RRID:AB_494011 |
| Anti-mouse CD45, APC-eFluor 780 (30-F11) | eBioscience | Cat# 47–0451-82; RRID:AB_1548781 |
| Anti-mouse CD45.1, FITC (A20) | eBioscience | Cat# 11–0453-85; RRID:AB_465059 |
| Anti-mouse CD45.2, APC-eFluor 780 (104) | eBioscience | Cat# 47–0454-82; RRID:AB_1272175 |
| Anti-mouse CD62L, FITC (MEL-14) | eBioscience | Cat# 11–0621-85; RRID:AB_465110 |
| Anti-mouse CD69, PE (H1.2F3) | eBioscience | Cat# 12–0691-83; RRID:AB_465733 |
| Anti-mouse CD71, APC (R17217) | eBioscience | Cat# 17–0711-82; RRID:AB_1834355 |
| Anti-mouse CD90.2, BV785 (30-H12) | Biolegend | Cat# 105331; RRID:AB_2562900 |
| Anti-mouse CD122, PerCP-eFluor 710 (TM-b1) | eBioscience | Cat# 46–1222-82; RRID:AB_11064442 |
| Anti-mouse CD127, BV605 (A7R34) | Biolegend | Cat# 135041; RRID:AB_2572047 |
| Anti-mouse CXCR4, PE (2B11) | eBioscience | Cat# 12–9991-81; RRID:AB_891393 |
| Anti-mouse CX3CR1, PE (SA001F11) | Biolegend | Cat# 149005; RRID:AB_2564314 |
| Anti-mouse EOMES, eFluor450 (Dan11mag) | eBioscience | Cat# 48–4875-82; RRID:AB_2574062 |
| Anti-mouse FOXP3, PerCP (FJK-16S) | eBioscience | Cat# 45–5773-82; RRID:AB_914351 |
| Anti-mouse NK1.1, PeCy7 | eBioscience | Cat# 25–5941-82; RRID:AB_469665 |
| Anti-mouse TCRγδd, PE-CF594 (eBioGL3) | BD | Cat# 563532; RRID:AB_2661844 |
| Anti-mouse TER-119, eFluor450 (TER-119) | eBioscience | Cat# 48–5921-82; RRID:AB_1518808 |
| Anti-mouse Vα2, PE (B20.1) | eBioscience | Cat# 12–5812-82; RRID:AB_465949 |
| Anti-mouse BCL-2, eFluor450 (10C4) | eBioscience | Cat# 48–6992-42; RRID:AB_2574099 |
| Anti-mouse IFN-γ, eFluor450 (XMG1.2) | eBioscience | Cat# 48–7311-82; RRID:AB_1834366 |
| Anti-human/mouse T-BET, BV421 (eBio4B10) | Biolegend | Cat# 644816; RRID:AB_10959653 |
| Anti-mouse TCRβ, PerCP-Cy5.5 (H57–597) | eBioscience | Cat# 45–5961-82; RRID:AB_925763 |
| Anti-mouse AKT473, PeCy7 (MRRBY) | eBioscience | Cat# 12–9715-42; RRID:AB_2637101 |
| Anti-mouse mTOR2448, PE (SDRNR) | eBioscience | Cat# 25–9718-42; RRID:AB_2573550 |
| Anti-mouse pS6240/244, AF488 (D68F8) | Cell signaling technologies | Cat# 5018; RRID:AB_10695861 |
| Anti-mouse PERILIPIN1, purified | Abcam | Cat# ab3526; RRID:AB_2167274 |
| Normal Goat Serum | Jackson ImmunoResearch Laboratories |
Cat# 005–000-121; RRID:AB_2336990 |
| Rat Gamma Globulin | Jackson ImmunoResearch Laboratories |
Cat# 012–000-002; RRID:AB_2337135 |
| Goat anti-rabbit AF647 | Life Technologies | Cat# A27040; RRID:AB_2536101 |
| Purified anti-mouse CD3 | BD | Cat# 553057; RRID:AB_394590 |
| Purified anti-mouse CD28 | BD | Cat# 553294; RRID:AB_394763 |
| Purified anti-mouse CD62L (Mel-14) | Bio-X-Cell | Cat# BE0021; RRID:AB_1107665 |
| Purified anti-mouse CD8 (2.43) | Bio-X-Cell | Cat# BE0061; RRID:AB_1125541 |
| Purified anti-mouse CD4 (GK1.5) | Bio-X-Cell | Cat# BE0003–1; RRID:AB_1107636 |
| Bacterial and Virus Strains | ||
| Yersinia pseudotuberculosis (32777) | Laboratory of Y.B. | N/A |
| Influenza A Virus, A/Puerto Rico/8/1934 (PR8), strain H1N1 | Laboratory of H.D.H, originally from Mount Sinai School of Medicine | N/A |
| Recombinant vaccinia-virus expressing human gp100 | Laboratory of N.P.R | N/A |
| Chemicals, Peptides, and Recombinant Proteins | ||
| 2-Mercaptoethanol | Sigma-Aldrich | M3148–25ML |
| Brefeldin A (GolgiPlug) | BD Biosciences | 555029 |
| BSA | Sigma-Aldrich | A3059–500G |
| DAPI | Sigma-Aldrich | D9542 |
| DNase I | Sigma-Aldrich | DN25–5G |
| DMSO | Sigma-Aldrich | D2650 |
| EDTA (0.5M) | Corning | 46–034-Cl |
| FBS | Hyclone | SH30070.03 |
| L-Glutamine | Corning | 25–005-Cl |
| HEPES | Corning | 25–060-Cl |
| Ionomycin | Sigma-Aldrich | I0634–5MG |
| Bodipy FL C16 | Life Technologies | D-3821 |
| BrdU | Thermo Fisher or BD Biosciences |
B23151 or 550891 |
| Liberase TL | Roche | 5401020001 |
| Sodium Pyruvate (100X) | Corning | 25–000-Cl |
| SIINFEKL peptide | Genscript | N/A |
| Triton X | Sigma-Aldrich | T9284 |
| Liberase TL | Roche | 05401020001 |
| MEM Non-essential Amino Acids (100X) | Corning | 25–025-Cl |
| Paraformaldehyde | Electron Microscopy Sciences |
15714-S |
| Pennicillin-Streptomycin (100X) | Corning | 30–002-Cl |
| Phorbol 12-myristate 13-acetate (PMA) | Sigma-Aldrich | P8139–10MG |
| ProLong Gold Antifade Mountant | Molecular Probes | P36930 |
| RPMI 1640 medium | Corning | 10–040-CV |
| Methanol | JT Baker | 9093–03 |
| Bodipy FL-C16 | Life Technologies | D-3821 |
| LipidTOX | Life Technologies | H34476 |
| DNase I | Sigma | DN25–5G |
| Liberase TL | Roche | 5401020001 |
| Trizol | Thermo Fisher | 15596018 |
| OCT | Fisher | 23–730-571 |
| Recombinant human IL-2 | Biolegend | 589106 |
| Recombinant human IL-7 | Biolegend | 581906 |
| Dexamethasone | Sigma-Aldrich | D1756–100MG |
| Tamoxifen | Sigma-Aldrich | T5648–5G |
| Corn oil | Sigma-Aldrich | C8267–500ML |
| AMD3100 | Sigma-Aldrich | 239820–5MG |
| FTY720 | Sigma-Aldrich | SML0700–25MG |
| Glutamine | Sigma-Aldrich | 1294808–100MG |
| Glucose | Sigma-Aldrich | G8270–100G |
| Oligomycin | Sigma-Aldrich | 75351–5MG |
| FCCP | Sigma-Aldrich | C2920–10MG |
| Rotenone | Sigma-Aldrich | R8875–5G |
| Antimycin A | Sigma-Aldrich | A8674–100MG |
| Fatty-acid free BSA | Sigma-Aldrich | A8806 |
| 2X YT medium | Sigma-Aldrich | Y1003 |
| Regular mouse chow | Lab Diet Advanced Protocol |
5V75 |
| Control isocaloric diet | Envigo | TD.160179 |
| Adequate vitamins and minerals diet | Envigo | TD.190106 |
| Adequate essential amino acids diet | Envigo | TD.190107 |
| Adequate protein diet | Envigo | TD.190108 |
| Diet in which only calories at 50% | Envigo | TD.190105 |
| Critical Commercial Assays | ||
| Anti-PE microbeads | Miltenyi Biotec | 130–048-801 |
| Arcturus PicoPure RNA Isolation kit | Thermo Fisher | KIT0204 |
| FITC BrdU Flow kit | BD Biosciences | 557891 |
| BD Cytofix/Cytoperm | BD Biosciences | 554722 |
| BD Perm/Wash | BD Biosciences | 554723 |
| Foxp3 / Transcription Factor Staining Buffer Set | eBioscience | 00–5523-00 |
| High Sensitivity D1000 ScreenTape | Agilent | 5067–5584 |
| LIVE/DEAD Fixable Blue Dead Cell Staining Kit | Life Technologies | L23105 |
| MACS Cell Separation Column LS | Miltenyi Biotec | 130–042-401 |
| Omniscript RT kit | QIAGEN | 205111 |
| Taq PCR Master Mix | Life Technologies | K0171 |
| Mouse corticosterone ELISA | Thermofisher | EIACORT |
| Nextera XT DNA Library Prep Kit | Illumina | FC-131–1096 |
| SMARTer Ultra Low Input RNA Kit | Clonetech | 634946 |
| Deposited Data | ||
| Raw RNA-Seq data | This manuscript | GEO: GSE124063 |
| Experimental Models: Cell Lines | ||
| B16 melanoma | The laboratory of N.P.R. | N/A |
| Experimental Models: Organisms/Strains | ||
| Mouse: C57BL/6 | Taconic Farms | Mouse strain: C57BL/6NTac |
| Mouse: B6.SJL-Ptprca/BoyAiTac (CD45.1) | Taconic Farms – NIAID exchange | Mouse strain: Tac 8478 |
| Mouse: OT-I CD45.1 RAG−/− | Taconic Farms – NIAID exchange | Mouse strain: Tac 300 |
| Mouse: C57BL/6-Tg(TcraTcrb)1100Mjb/J (OT-I) | Jackson laboratories | Mouse strain: Jax, 003831 |
| Mouse: B6.129(Cg)-Gt(ROSA)26Sortm4 (ACTB-tdTomato,-EGFP)Luo/J (mTomato) |
Jackson laboratories | Mouse strain: Jax, 007676 |
| Mouse: mTomato x OT-I | Laboratory of D.B.M | N/A |
| Mouse: C57BL/6-Tg(Adipoq-cre/ERT2)1Soff/J | Jackson laboratories | Mouse strain: Jax, 025124 |
| Mouse: B6.129P2-Gt(ROSA)26Sortm1(DTA)Lky/J | Jackson laboratories | Mouse strain: Jax, 009669 |
| Mouse: Adipoq-CreERT2 x Rosa26-DTA | Laboratory of Y.B. | N/A |
| Mouse: Cxcr4fl/fl x UBC-CREERT2 | Laboratory of S.R.S | N/A |
| Mouse: S1pr1fl/fl x UBC-CREERT2 | Laboratory of S.R.S | N/A |
| Mouse: B6Cg.Thy1a/Cy Tg(TcraTcrb)8Rest/J | Jackson laboratories | Mouse strain: Jax, 005023 |
| Oligonucleotides | ||
| Hprt | Thermofisher | 4331182 (Mm03024075_m1) |
| Fabp4 | Thermofisher | 4331182 (Mm00445878_m1) |
| Software and Algorithms | ||
| Flowjo software | Treestar | RRID: SCR_008520 |
| Imaris software | Bitplane | RRID: SCR_007370 |
| Prism software | Graphpad | RRID: SCR_002798 |
| ImageJ | https://imagej.net/ | RRID: SCR_003070 |
| STAR aligner | Dobin et al., 2013 | RRID: SCR_015899 |
| HOMER | http://homer.ucsd.edu/ | RRID: SCR_010881 |
| DESeq2 | https://bioconductor.org/packages/release/bioc/html/DESeq2.html | RRID: SCR_015687 |
| Metascape | http://metascape.org/gp/index.html#/main/step1 | RRID: SCR_016620 |
| GSEA | http://www.broadinstitute.org/gsea/ | RRID: SCR_003199 |
| FastQC | Babraham Bioinformatics | RRID: SCR_014583 |
| R | https://www.r-project.org/ | N/A |
Highlights.
Dietary restriction promotes memory T cell accumulation in BM
BM trophic factors and adipocytes promote memory T cell accumulation in BM
Memory T cells display enhanced protective function during dietary restriction
ACKNOWLEDGMENTS
Y.B. is supported by the Division of Intramural Research of NIAID (NIAID; ZIAAI001132, ZIA-AI001133), NIH. N.C. and Y.B. were supported by the Office of Dietary Supplements Research Scholar program, NIH. Work in the Schwab lab was supported by NIH grants R01AI085166 and R01AI123308, and a Vilcek Scholar Award to D.D. We thank the Belkaid lab for their suggestions, support, and critical reading of the manuscript and J. Kehr and N. Bouladoux for managing the program of the laboratory. We thank K. Beacht, E. Lewis, and J. LeGrand for technical assistance; the NIAID animal facility staff; T. Hawley (NIAID flow cytometry facility); O. Schwartz (NIAID biological imaging facility); and B.Tran and J. Sheti (NCI sequencing core facility).
Footnotes
DECLARATION OF INTERESTS
The authors declare no competing interests.
SUPPLEMENTAL INFORMATION
Supplemental Information can be found online at https://doi.org/10.1016/j.cell.2019.07.049.
REFERENCES
- Acosta-Rodríguez VA, de Groot MHM, Rijo-Ferreira F, Green CB, and Takahashi JS (2017). Mice under Caloric Restriction Self-Impose a Temporal Restriction of Food Intake as Revealed by an Automated Feeder System. Cell Metab. 26, 267–277. [DOI] [PMC free article] [PubMed] [Google Scholar]
- Araki K, Turner AP, Shaffer VO, Gangappa S, Keller SA, Bachmann MF, Larsen CP, and Ahmed R. (2009). mTOR regulates memory CD8 T-cell differentiation. Nature 460, 108–112. [DOI] [PMC free article] [PubMed] [Google Scholar]
- Aramburu J, Ortells MC, Tejedor S, Buxadé M, and Lόpez-Rodríguez C. (2014). Transcriptional regulation of the stress response by mTOR. Sci. Signal. 7, re2. [DOI] [PubMed] [Google Scholar]
- Arojo OA, Ouyang X, Liu D, Meng T, Kaech SM, Pereira JP, and Su B. (2018). Active mTORC2 Signaling in Naive T Cells Suppresses Bone Marrow Homing by Inhibiting CXCR4 Expression. J. Immunol. 201, 908–915. [DOI] [PubMed] [Google Scholar]
- Becker TC, Coley SM, Wherry EJ, and Ahmed R. (2005). Bone marrow is a preferred site for homeostatic proliferation of memory CD8 T cells. J. Immunol. 174, 1269–1273. [DOI] [PubMed] [Google Scholar]
- Besedovsky L, Born J, and Lange T. (2014a). Endogenous glucocorticoid receptor signaling drives rhythmic changes in human T-cell subset numbers and the expression of the chemokine receptor CXCR4. FASEB J. 28, 67–75. [DOI] [PubMed] [Google Scholar]
- Besedovsky L, Linz B, Dimitrov S, Groch S, Born J, and Lange T. (2014b). Cortisol increases CXCR4 expression but does not affect CD62L and CCR7 levels on specific T cell subsets in humans. Am. J. Physiol. Endocrinol. Metab. 306, E1322–E1329. [DOI] [PubMed] [Google Scholar]
- Buck MD, O’Sullivan D, Klein Geltink RI, Curtis JD, Chang CH, Sanin DE, Qiu J, Kretz O, Braas D, van der Windt GJ, et al. (2016). Mitochondrial Dynamics Controls T Cell Fate through Metabolic Programming. Cell 166, 63–76. [DOI] [PMC free article] [PubMed] [Google Scholar]
- Cain DW, and Cidlowski JA (2017). Immune regulation by glucocorticoids. Nat. Rev. Immunol. 17, 233–247. [DOI] [PMC free article] [PubMed] [Google Scholar]
- Cawthorn WP, Scheller EL, Learman BS, Parlee SD, Simon BR, Mori H, Ning X, Bree AJ, Schell B, Broome DT, et al. (2014). Bone marrow adipose tissue is an endocrine organ that contributes to increased circulating adiponectin during caloric restriction. Cell Metab. 20, 368–375. [DOI] [PMC free article] [PubMed] [Google Scholar]
- Chaix J, Nish SA, Lin WH, Rothman NJ, Ding L, Wherry EJ, and Reiner SL (2014). Cutting edge: CXCR4 is critical for CD8+ memory T cell homeostatic self-renewal but not rechallenge self-renewal. J. Immunol. 193, 1013–1016. [DOI] [PMC free article] [PubMed] [Google Scholar]
- Chongsathidkiet P, Jackson C, Koyama S, Loebel F, Cui X, Farber SH, Woroniecka K, Elsamadicy AA, Dechant CA, Kemeny HR, et al. (2018). Sequestration of T cells in bone marrow in the setting of glioblastoma and other intracranial tumors. Nat. Med. 24, 1459–1468. [DOI] [PMC free article] [PubMed] [Google Scholar]
- Choo AY, Kim SG, Vander Heiden MG, Mahoney SJ, Vu H, Yoon SO, Cantley LC, and Blenis J. (2010). Glucose addiction of TSC null cells is caused by failed mTORC1-dependent balancing of metabolic demand with supply. Mol. Cell 38, 487–499. [DOI] [PMC free article] [PubMed] [Google Scholar]
- Contreras NA, Fontana L, Tosti V, and Nikolich-Zugich J. (2018). Calori e restriction induces reversible lymphopenia and lymphoid organ atrophy due to cell redistribution. Geroscience 40, 279–291. [DOI] [PMC free article] [PubMed] [Google Scholar]
- Cui G, Staron MM, Gray SM, Ho PC, Amezquita RA, Wu J, and Kaech SM (2015). IL-7-Induced Glycerol Transport and TAG Synthesis Promotes Memory CD8+ T Cell Longevity. Cell 161, 750–761. [DOI] [PMC free article] [PubMed] [Google Scholar]
- Cyster JG, and Schwab SR (2012). Sphingosine-1-phosphate and lymphocyte egress from lymphoid organs. Annu. Rev. Immunol. 30, 69–94. [DOI] [PubMed] [Google Scholar]
- Devlin MJ, Cloutier AM, Thomas NA, Panus DA, Lotinun S, Pinz I, Baron R, Rosen CJ, and Bouxsein ML (2010). Caloric restriction leads to high marrow adiposity and low bone mass in growing mice. J. Bone Miner. Res. 25, 2078–2088. [DOI] [PMC free article] [PubMed] [Google Scholar]
- Di Rosa F, and Gebhardt T. (2016). Bone Marrow T Cells and the Integrated Functions of Recirculating and Tissue-Resident Memory T Cells. Front. Immunol. 7, 51. [DOI] [PMC free article] [PubMed] [Google Scholar]
- Dobin A, Davis CA, Schlesinger F, Drenkow J, Zaleski C, Jha S, Batut P, Chaisson M, and Gingeras TR (2013). STAR: ultrafast universal RNA-seq aligner. Bioinformatics 29, 15–21. [DOI] [PMC free article] [PubMed] [Google Scholar]
- Flygare J, Rayon Estrada V, Shin C, Gupta S, and Lodish HF (2011). HIF1alpha synergizes with glucocorticoids to promote BFU-E progenitor selfrenewal. Blood 117, 3435–3444. [DOI] [PMC free article] [PubMed] [Google Scholar]
- Fujita Y, Murakami M, Ogawa Y, Masuzaki H, Tanaka M, Ozaki S, Nakao K, and Mimori T. (2002). Leptin inhibits stress-induced apoptosis of T lymphocytes. Clin. Exp. Immunol. 128, 21–26. [DOI] [PMC free article] [PubMed] [Google Scholar]
- Gerlach C, Moseman EA, Loughhead SM, Alvarez D, Zwijnenburg AJ, Waanders L, Garg R, de la Torre JC, and von Andrian UH (2016). The Chemokine Receptor CX3CR1 Defines Three Antigen-Experienced CD8 T Cell Subsets with Distinct Roles in Immune Surveillance and Homeostasis. Immunity 45, 1270–1284. [DOI] [PMC free article] [PubMed] [Google Scholar]
- Ghosh MC, Baatar D, Collins G, Carter A, Indig F, Biragyn A, and Taub DD (2009). Dexamethasone augments CXCR4-mediated signaling in resting human T cells via the activation of the Src kinase Lck. Blood 113, 575–584. [DOI] [PMC free article] [PubMed] [Google Scholar]
- Han SJ, Glatman Zaretsky A, Andrade-Oliveira V, Collins N, Dzutsev A, Shaik J, Morais da Fonseca D, Harrison OJ, Tamoutounour S, Byrd AL, et al. (2017). White Adipose Tissue Is a Reservoir for Memory T Cells and Promotes Protective Memory Responses to Infection. Immunity 47, 1154–1168. [DOI] [PMC free article] [PubMed] [Google Scholar]
- Hänel P, Andréani P, and Gräler MH (2007). Erythrocytes store and release sphingosine 1-phosphate in blood. FASEB J. 21, 1202–1209. [DOI] [PubMed] [Google Scholar]
- Harp JR, Gilchrist MA, and Onami TM (2010). Memory T cells are enriched in lymph nodes of selectin-ligand-deficient mice. J. Immunol. 185, 5751–5761. [DOI] [PubMed] [Google Scholar]
- Hart BL (1988). Biological basis of the behavior of sick animals. Neurosci. Biobehav. Rev. 12, 123–137. [DOI] [PubMed] [Google Scholar]
- Heinz S, Benner C, Spann N, Bertolino E, Lin YC, Laslo P, Cheng JX, Murre C, Singh H, and Glass CK (2010). Simple combinations of lineagedetermining transcription factors prime cis-regulatory elements required for macrophage and B cell identities. Mol. Cell 38, 576–589. [DOI] [PMC free article] [PubMed] [Google Scholar]
- Jameson SC, and Masopust D. (2018). Understanding Subset Diversity in T Cell Memory. Immunity 48, 214–226. [DOI] [PMC free article] [PubMed] [Google Scholar]
- Kaech SM, and Cui W. (2012). Transcriptional control of effector and memory CD8+ T cell differentiation. Nat. Rev. Immunol. 12, 749–761. [DOI] [PMC free article] [PubMed] [Google Scholar]
- Kalaany NY, and Sabatini DM (2009). Tumours with PI3K activation are resistant to dietary restriction. Nature 458, 725–731. [DOI] [PMC free article] [PubMed] [Google Scholar]
- Karsten E, Breen E, and Herbert BR (2018a). Red blood cells are dynamic reservoirs of cytokines. Sci. Rep. 8, 3101. [DOI] [PMC free article] [PubMed] [Google Scholar]
- Karsten E, Hill CJ, and Herbert BR (2018b). Red blood cells: The primary reservoir of macrophage migration inhibitory factor in whole blood. Cytokine 102, 34–40. [DOI] [PubMed] [Google Scholar]
- Klonowski KD, Williams KJ, Marzo AL, Blair DA, Lingenheld EG, and Lefrançois L. (2004). Dynamics of blood-borne CD8 memory T cell migration in vivo. Immunity 20, 551–562. [DOI] [PubMed] [Google Scholar]
- Love MI, Huber W, and Anders S. (2014). Moderated estimation of fold change and dispersion for RNA-seq data with DESeq2. Genome Biol. 15, 550. [DOI] [PMC free article] [PubMed] [Google Scholar]
- Maeda Y, Seki N, Sato N, Sugahara K, and Chiba K. (2010). Sphingosine 1-phosphate receptor type 1 regulates egress of mature T cells from mouse bone marrow. Int. Immunol. 22, 515–525. [DOI] [PubMed] [Google Scholar]
- Mandala S, Hajdu R, Bergstrom J, Quackenbush E, Xie J, Milligan J, Thornton R, Shei GJ, Card D, Keohane C, et al. (2002). Alteration of lymphocyte trafficking by sphingosine-1-phosphate receptor agonists. Science 296, 346–349. [DOI] [PubMed] [Google Scholar]
- Manglani M, and McGavern DB (2018). Intravital Imaging of Neuroimmune Interactions Through a Thinned Skull. Curr. Protoc. Immunol. 120, 24.2.1–24.2.12. [DOI] [PMC free article] [PubMed] [Google Scholar]
- Mannick JB, Morris M, Hockey HP, Roma G, Beibel M, Kulmatycki K, Watkins M, Shavlakadze T, Zhou W, Quinn D, et al. (2018). TORC1 inhibition enhances immune function and reduces infections in the elderly. Sci. Transl. Med. 10. [DOI] [PubMed] [Google Scholar]
- Masopust D, Vezys V, Marzo AL, and Lefrançois L. (2001). Preferential localization of effector memory cells in nonlymphoid tissue. Science 291, 2413–2417. [DOI] [PubMed] [Google Scholar]
- Matloubian M, Lo CG, Cinamon G, Lesneski MJ, Xu Y, Brinkmann V, Allende ML, Proia RL, and Cyster JG (2004). Lymphocyte egress from thymus and peripheral lymphoid organs is dependent on S1P receptor 1. Nature 427, 355–360. [DOI] [PubMed] [Google Scholar]
- Mazo IB, Honczarenko M, Leung H, Cavanagh LL, Bonasio R, Weninger W, Engelke K, Xia L, McEver RP, Koni PA, et al. (2005). Bone marrow is a major reservoir and site of recruitment for central memory CD8+ T cells. Immunity 22, 259–270. [DOI] [PubMed] [Google Scholar]
- Mendoza A, Fang V, Chen C, Serasinghe M, Verma A, Muller J, Chaluvadi VS, Dustin ML, Hla T, Elemento O, et al. (2017). Lymphatic endothelial S1P promotes mitochondrial function and survival in naive T cells. Nature 546, 158–161. [DOI] [PMC free article] [PubMed] [Google Scholar]
- Mittelstadt PR, Monteiro JP, and Ashwell JD (2012). Thymocyte responsiveness to endogenous glucocorticoids is required for immunological fitness. J. Clin. Invest. 122, 2384–2394. [DOI] [PMC free article] [PubMed] [Google Scholar]
- Mueller SN, and Mackay LK (2016). Tissue-resident memory T cells: local specialists in immune defence. Nat. Rev. Immunol. 16, 79–89. [DOI] [PubMed] [Google Scholar]
- Nikolich-Zugich J, and Messaoudi I. (2005). Mice and flies and monkeys too: caloric restriction rejuvenates the aging immune system of non-human primates. Exp. Gerontol. 40, 884–893. [DOI] [PubMed] [Google Scholar]
- O’Sullivan D, van der Windt GJ, Huang SC, Curtis JD, Chang CH, Buck MD, Qiu J, Smith AM, Lam WY, DiPlato LM, et al. (2014). Memory CD8(+) T cells use cell-intrinsic lipolysis to support the metabolic programming necessary for development. Immunity 41, 75–88. [DOI] [PMC free article] [PubMed] [Google Scholar]
- Overwijk WW, Theoret MR, Finkelstein SE, Surman DR, de Jong LA, Vyth-Dreese FA, Dellemijn TA, Antony PA, Spiess PJ, Palmer DC, et al. (2003). Tumor regression and autoimmunity after reversal of a functionally tolerant state of self-reactive CD8+ T cells. J. Exp. Med. 198, 569–580. [DOI] [PMC free article] [PubMed] [Google Scholar]
- Pabst R, Miyasaka M, and Dudler L. (1986). Numbers and phenotype of lymphocytes emigrating from sheep bone marrow after in situ labelling with fluorescein isothiocyanate. Immunology 59, 217–222. [PMC free article] [PubMed] [Google Scholar]
- Pan Y, Tian T, Park CO, Lofftus SY, Mei S, Liu X, Luo C, O’Malley JT, Gehad A, Teague JE, et al. (2017). Survival of tissue-resident memory T cells requires exogenous lipid uptake and metabolism. Nature 543, 252–256. [DOI] [PMC free article] [PubMed] [Google Scholar]
- Pappu R, Schwab SR, Cornelissen I, Pereira JP, Regard JB, Xu Y, Camerer E, Zheng YW, Huang Y, Cyster JG, and Coughlin SR (2007). Promotion of lymphocyte egress into blood and lymph by distinct sources of sphingosine-1-phosphate. Science 316, 295–298. [DOI] [PubMed] [Google Scholar]
- Parretta E, Cassese G, Barba P, Santoni A, Guardiola J, and Di Rosa F. (2005). CD8 cell division maintaining cytotoxic memory occurs predominantly in the bone marrow. J. Immunol. 174, 7654–7664. [DOI] [PubMed] [Google Scholar]
- Pearce EL, Walsh MC, Cejas PJ, Harms GM, Shen H, Wang LS, Jones RG, and Choi Y. (2009). Enhancing CD8 T-cell memory by modulating fatty acid metabolism. Nature 460, 103–107. [DOI] [PMC free article] [PubMed] [Google Scholar]
- Raud B, McGuire PJ, Jones RG, Sparwasser T, and Berod L. (2018a). Fatty acid metabolism in CD8+ T cell memory: Challenging current concepts. Immunol. Rev. 283, 213–231. [DOI] [PMC free article] [PubMed] [Google Scholar]
- Raud B, Roy DG, Divakaruni AS, Tarasenko TN, Franke R, Ma EH, Samborska B, Hsieh WY, Wong AH, Stuve P, et al. (2018b). Etomoxir Actions on Regulatory and Memory T Cells Are Independent of Cpt1a-Mediated Fatty Acid Oxidation. Cell Metab. 28, 504–515. [DOI] [PMC free article] [PubMed] [Google Scholar]
- Redman LM, Smith SR, Burton JH, Martin CK, Il’yasova D, and Ravussin E. (2018). Metabolic Slowing and Reduced Oxidative Damage with Sustained Caloric Restriction Support the Rate of Living and Oxidative Damage Theories of Aging. Cell Metab 27, 805–815. [DOI] [PMC free article] [PubMed] [Google Scholar]
- Robertson LT, and Mitchell JR (2013). Benefits of short-term dietary restriction in mammals. Exp. Gerontol. 48, 1043–1048. [DOI] [PMC free article] [PubMed] [Google Scholar]
- Sallusto F, Lenig D, Förster R, Lipp M, and Lanzavecchia A. (1999). Two subsets of memory T lymphocytes with distinct homing potentials and effector functions. Nature 401, 708–712. [DOI] [PubMed] [Google Scholar]
- Saxton RA, and Sabatini DM (2017). mTOR Signaling in Growth, Metabolism, and Disease. Cell 169, 361–371. [DOI] [PubMed] [Google Scholar]
- Scheller EL, Doucette CR, Learman BS, Cawthorn WP, Khandaker S, Schell B, Wu B, Ding SY, Bredella MA, Fazeli PK, et al. (2015). Regionspecific variation in the properties of skeletal adipocytes reveals regulated and constitutive marrow adipose tissues. Nat. Commun. 6, 7808. [DOI] [PMC free article] [PubMed] [Google Scholar]
- Scheller EL, Cawthorn WP, Burr AA, Horowitz MC, and MacDougald OA (2016). Marrow Adipose Tissue: Trimming the Fat. Trends Endocrinol. Metab. 27, 392–403. [DOI] [PMC free article] [PubMed] [Google Scholar]
- Scheller EL, Khandaker S, Learman BS, Cawthorn WP, Anderson LM, Pham HA, Robles H, Wang Z, Li Z, Parlee SD, et al. (2019). Bone marrow adipocytes resist lipolysis and remodeling in response to b-adrenergic stimulation. Bone 118, 32–41. [DOI] [PMC free article] [PubMed] [Google Scholar]
- Shimba A, Cui G, Tani-Ichi S, Ogawa M, Abe S, Okazaki F, Kitano S, Miyachi H, Yamada H, Hara T, et al. (2018). Glucocorticoids Drive Diurnal Oscillations in T Cell Distribution and Responses by Inducing Interleukin-7 Receptor and CXCR4. Immunity 48, 286–298. [DOI] [PubMed] [Google Scholar]
- Speakman JR, and Mitchell SE (2011). Caloric restriction. Mol. Aspects Med. 32, 159–221. [DOI] [PubMed] [Google Scholar]
- Spencer SP, Wilhelm C, Yang Q, Hall JA, Bouladoux N, Boyd A, Nutman TB, Urban JF Jr., Wang J, Ramalingam TR, et al. (2014). Adaptation of innate lymphoid cells to a micronutrient deficiency promotes type 2 barrier immunity. Science 343, 432–437. [DOI] [PMC free article] [PubMed] [Google Scholar]
- Surh CD, and Sprent J. (2008). Homeostasis of naive and memory T cells. Immunity 29, 848–862. [DOI] [PubMed] [Google Scholar]
- Tripathi S, Pohl MO, Zhou Y, Rodriguez-Frandsen A, Wang G, Stein DA, Moulton HM, DeJesus P, Che J, Mulder LC, et al. (2015). Metaand Orthogonal Integration of Influenza “OMICs” Data Defines a Role for UBR4 in Virus Budding. Cell Host Microbe 18, 723–735. [DOI] [PMC free article] [PubMed] [Google Scholar]
- van der Windt GJ, Everts B, Chang CH, Curtis JD, Freitas TC, Amiel E, Pearce EJ, and Pearce EL (2012). Mitochondrial respiratory capacity is a critical regulator of CD8+ T cell memory development. Immunity 36, 68–78. [DOI] [PMC free article] [PubMed] [Google Scholar]
- Wang A, Huen SC, Luan HH, Yu S, Zhang C, Gallezot JD, Booth CJ, and Medzhitov R. (2016). Opposing Effects of Fasting Metabolism on Tissue Tolerance in Bacterial and Viral Inflammation. Cell 166, 1512–1525. [DOI] [PMC free article] [PubMed] [Google Scholar]
- Wing EJ, Magee DM, and Barczynski LK (1988). Acute starvation in mice reduces the number of T cells and suppresses the development of T-cellmediated immunity. Immunology 63, 677–682. [PMC free article] [PubMed] [Google Scholar]
- Xiao H, Peng Y, Hong Y, Liu Y, Guo ZS, Bartlett DL, Fu N, and He Y. (2011). Lentivector prime and vaccinia virus vector boost generate high-quality CD8 memory T cells and prevent autochthonous mouse melanoma. J. Immunol. 187, 1788–1796. [DOI] [PMC free article] [PubMed] [Google Scholar]
- Zhang L, Prak L, Rayon-Estrada V, Thiru P, Flygare J, Lim B, and Lodish HF (2013). ZFP36L2 is required for self-renewal of early burst-forming unit erythroid progenitors. Nature 499, 92–96. [DOI] [PMC free article] [PubMed] [Google Scholar]
- Zhou BO, Yu H, Yue R, Zhao Z, Rios JJ, Naveiras O, and Morrison SJ (2017). Bone marrow adipocytes promote the regeneration of stem cells and haematopoiesis by secreting SCF. Nat. Cell Biol. 19, 891–903. [DOI] [PMC free article] [PubMed] [Google Scholar]
Associated Data
This section collects any data citations, data availability statements, or supplementary materials included in this article.
Supplementary Materials
Data Availability Statement
The datasets generated during this study can be found using the GEO accession number GEO: GSE124063.