

Abstract
Background
Skeletal muscle depletion or sarcopenia is related to multiple adverse clinical outcome. However, frailty questionnaires are currently applied in the daily practice to identify patients who are potentially (un)suitable for treatment but are time consuming and straining for patients and the clinician. Screening for sarcopenia in patients with head and neck cancer (HNC) could be a promising fast biomarker for frailty. Our objective was to quantify sarcopenia with pre‐treatment low skeletal muscle mass from routinely obtained neck computed tomography scans at level of third cervical vertebra in patients diagnosed with HNC and evaluate its association with frailty.
Methods
A total of 112 HNC patients with Stages III and IV disease were included from a prospective databiobank. The amount of skeletal muscle mass was retrospectively defined using the skeletal muscle index (SMI). Correlation analysis between SMI and continuous frailty data and the observer agreement were analysed with Pearson's r correlation coefficients. Sarcopenia was present when SMI felt below previously published non‐gender specific thresholds (<43.2 cm2/m2). Frailty was evaluated by Geriatrics 8 (G8), Groningen Frailty Indicator, Timed Up and Go test, and Malnutrition Universal Screening Tool. A univariate and multivariate logistic regression analysis was performed for all patients and men separately to obtain odds ratios (ORs) and 95% confidence intervals (95% CIs).
Results
The cohort included 82 men (73%) and 30 women (27%), with a total mean age of 63 (±9) years. The observer agreement for cross‐sectional measurements was excellent for both intra‐observer variability (r = 0.99, P < 0.001) and inter‐observer variability (r = 0.98, P < 0.001). SMI correlated best with G8 frailty score (r = 0.38, P < 0.001) and did not differ per gender. Sarcopenia was present in 54 (48%) patients, whereof 25 (46%) men and 29 (54%) women. Prevalence of frailty was between 5% and 54% depending on the used screening tool. The multivariate regression analysis for all patients and men separately isolated the G8 questionnaire as the only independent variable associated with sarcopenia (OR 0.76, 95% CI 0.66–0.89, P < 0.001 and OR 0.76, 95% CI 0.66–0.88, P < 0.001, respectively).
Conclusions
This is the first study that demonstrates that sarcopenia is independently associated with frailty based on the G8 questionnaire in HNC patients. These results suggest that in the future, screening for sarcopenia on routinely obtained neck computed tomography scans may replace time consuming frailty questionnaires and help to select the (un)suitable patients for therapy, which is highly clinically relevant.
Keywords: Sarcopenia, Head and neck neoplasms, Computer‐assisted image analysis, Frailty, Malnutrition, Mobility limitation
Introduction
Head and neck cancer (HNC) represents worldwide an important population burden, with annually more than 550 000 new cases and 380 000 deaths.1 Moreover, incidence in the Netherlands of patients with HNC has increased from 2077 in 1990 to 3081 in 2017 and will most likely continue to increase due to aging of our society.2 Approximately two‐thirds of patients with HNC are diagnosed with advanced disease and require complex treatment, including surgery, radiotherapy, and systemic therapy (chemotherapy and/or immunotherapy) in a multidisciplinary approach.3 Despite progression in treatment in the last decade, treatment is not always successful with an overall 5‐year survival of 40–50%4, 5 and is generally straining resulting in adverse events including toxicity, complication, and mortality.6 In addition, HNC patients are a challenging population with significant pre‐existent health problems that could interfere with their treatment plan,7 including an increased risk of malnutrition due to dysphagia and changes of metabolism induced by the tumour.8 It is therefore of great importance to identify which patients are (un)suitable for treatment.
Currently, the comprehensive geriatric assessment (CGA) is considered as a gold standard to diagnose frailty, which is associated with poor outcomes and higher risks of treatment; therefore, it assesses the biological age, rather than the chronological age per se to identify for treatment (un)suitable patients.9, 10 A CGA is a multidimensional and interdisciplinary assessment through evaluating physical, psychological, functional, and social capabilities and limitations of the onco‐geriatric patient.10 Although CGA is the most valid and reliable method, it is very time intensive. Alternatively, frailty questionnaires are used to identify patients who should undergo a full CGA,11 which are also time intensive even though it is a shorter procedure. Moreover, questionnaires suffer from subjectivity. A biological marker of frailty would be more accurate, but such a marker does not yet exist. There are several promising studies, but no breakthrough has been achieved on this field of research, for example, elevated IL‐6 and adiponectin level12 and pattern of circulating amino acid levels.13 As a consequence, there is a search for a fast biomarker to identify frail patients.
Screening for sarcopenia could be such an alternative. Sarcopenia is defined by European Working Group on Sarcopenia in Older People as a progressive and generalized skeletal muscle disorder that is associated with increased likelihood of adverse outcomes including falls, fractures, physical disability, and mortality.14 Sarcopenia is confirmed by the presence of low skeletal muscle mass.14 Muscle quantity is classically measured on abdominal computed tomography (CT) at level of third lumbar vertebra (L3) because of the accuracy and strong correlation of the single slice measurement with the total body skeletal muscle mass15, 16 and the availability of routinely made abdominal CT scans in abdominal oncology patients.17 Recent developments make it possible to assess skeletal muscle mass at the level of C3 using neck CT scans, which are nowadays a part of the normal diagnostic work‐up in HNC patients.18 This is a major leap in assessing sarcopenia in HNC patients, as most HNC patients (93%) lack abdominal imaging with CT.19 Importantly, sarcopenia is related to adverse clinical outcomes including disability, malnutrition, poor response to chemotherapy with increased toxicity, post‐operative complications, and lower overall survival in abdominal oncology populations.17, 20, 21 Associations of sarcopenia and frailty in HNC patients remain unexplored till now. Assessing skeletal muscle mass with neck CT scans might be a promising, feasible, cost‐effective, innovative, and fast imaging biomarker to assess adverse outcome including frailty in HNC patients.
Before widespread clinical implementation of CT measured skeletal muscle mass at C3 is possible, it is important to understand the interaction of skeletal muscle mass with different domains of frailty in HNC patients. The primary aim of this present study is to quantify pre‐treatment C3 skeletal muscle mass in patients diagnosed with HNC and analyse its association with frailty. Our secondary aim was to investigate whether C3 low skeletal muscle mass, or sarcopenia, is related to mobility and nutritional status.
Methods
Patients and study design
Patients diagnosed between November 2014 and September 2017 with squamous cell carcinoma of the oral cavity, larynx, oropharynx, and hypopharynx with Stages III and IV disease (according to the 7th edition AJCC staging manual) were included (n = 163). To prevent possible pathophysiological interference, patients with a history of malignancies or patients with multiple simultaneous primary malignant tumours were excluded from the here presented analyses (n = 26). Patients without neck CT scan at time of diagnosis were also excluded (n = 17). This resulted in an initial inclusion of 121 patients. Image analysis was not possible due to various image analysis implications in five patients: a too small field of view (n = 3), a skewed CT image of the neck (n = 1), and an analysis error due to incompatibility of extern origin CT images (n = 1). An additional four patients were excluded from the cohort analysis because one or both sternocleidomastoid muscles were infiltrated by lymphatic node metastasis, which are used for skeletal muscle quantification, and discrimination between metastasis and muscle was therefore not feasible. This resulted in the final inclusion of 112 patients (Figure 1).
Figure 1.
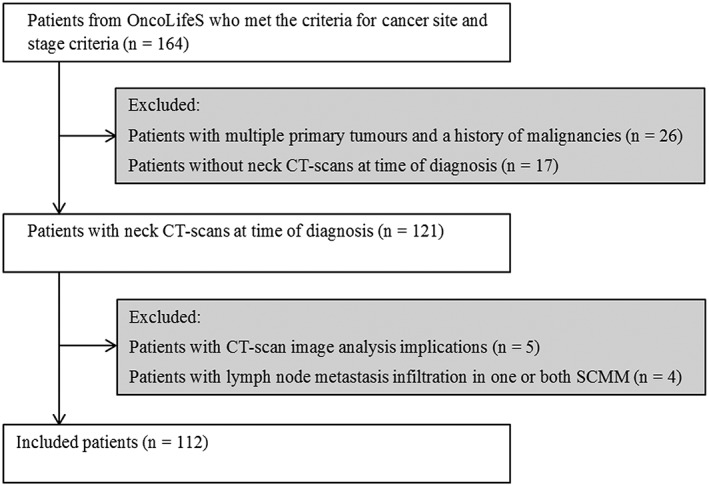
Flowchart of included and excluded patients. CT, computed tomography; OncoLifeS, Oncological Life Study; SCMM, Sternocleidomastoid muscle.
The following baseline characteristics were retrieved from a prospectively maintained databiobank and analysed retrospectively: age, gender, length, weight, body mass index (BMI), Adult Comorbidity Evaluation‐27 index (ACE‐27), alcohol abuse (men >3 units per day and women >2 units per day),22 history of smoking, tumour site, and tumour stage.
Screening tools for frailty, mobility, and risk of malnutrition.
An overview of all applied screening tools and cut‐off values can be found in Table 1. Frailty status was determined with GFI and G8. The G8 frailty questionnaire is especially designed for onco‐geriatric patients, with seven items derived from the Mini Nutritional Assessment and one item relative to patients age.23 GFI is a 15‐item questionnaire to evaluate frailty status in geriatrics through loss of function and resources in physical, social, and psychological domains.24 Patients were categorized as non‐frail (GFI < 4 and G8 > 14) and frail (GFI ≥ 4 and G8 ≤ 14).23, 24
Table 1.
| Tests used | Outcome | Cut‐off value | |
|---|---|---|---|
| Sarcopenia | CSA at C3 | SMI in cm2/m2 | Sarcopenic = SMI <43.2 |
| Frailty | G8 | Score ranged 0–17 | Frail = G8 ≤14 |
| GFI | Score ranged 0–5 | Frail = GFI ≥4 | |
| Malnutrition risk | MUST | Score ranged 0–6 | Low risk = MUST = 0 |
| Medium risk = MUST = 1 | |||
| High risk = MUST ≥2 | |||
| Mobility | TUG | Mean of two attempts in seconds | Limited = TUG ≥20 |
C3, third cervical vertebrae; CSA, cross‐sectional area; G8, Geriatrics 8; GFI, Groningen Frailty Indicator; MUST, Malnutrition Universal Screening Tool; SMI, skeletal muscle index; TUG, Timed Up and Go test.
Timed Up and Go test (TUG) was performed to assess mobility. During this test, the patient was asked to stand up from a chair, walk 3 m, turn around, return to the chair, and sit down.25 The risk on malnutrition was evaluated with the five‐step Malnutrition Universal Screening Tool (MUST). Outcome of the MUST questionnaire depended on present BMI, recent unplanned weight loss, and acute disease effect on nutritional intake.26
Measurements to define skeletal muscle mass
All analysed CT scans of the neck were made in the normal diagnostic work‐up before initiating treatment. CT scans were performed preferable post‐contrast, reconstructed with a 1 mm slice thickness, and usage of a soft‐tissue kernel. Image analysis was conducted with Aquarius workstation iNtuition edition program (ver.4.4.13.P3, Terarecon Inc., Foster City, CA, USA).
Quantification of pre‐treatment skeletal muscle mass was determined for each patient according to the method previously published by Swartz et al.18 In short, C3 was used as a landmark, and the foremost caudal CT slice in axial plane with the entire vertebral arc displaying was selected. Angulation for optimizing visibility was prohibited to ensure reproducibility. Threshold for Hounsfield units (HU) were set from −29 HU to +150 HU, which corresponds with skeletal muscle density.16 Most of the skeletal muscle was selected automatically, while other densities such as bone structures and fat infiltration were excluded. However, the outer counters had to be manually adjusted for each region of interest to exclude for instance large veins (Figure 2). The right sternocleidomastoid muscle, left sternocleidomastoid muscle, and paravertebral muscles were separately contoured. The total cross‐sectional area (CSA, cm2) of the skeletal muscle at C3 corresponds with the total sum of pixels within the HU ranged from −29 to +150 of these three structures.
Figure 2.

Example of skeletal muscle measurements on an axial CT slice at level of C3. Circumvented right sternocleidomastoid muscle (A), left sternocleidomastoid muscle (B), and paravertebral muscles (C) are shown at the level of C3. Tissue with corresponding muscle HU values are presented in green. Tissues presented as black or white are not corresponding with muscle HU values and are not included in the calculation when circumvented. Total CSA of skeletal muscle at L3 is calculated according to the algorithm given by Schwartz et al.18 Total CSA of skeletal muscle at L3 (cm2) = 27.304 + 1.363*total CSA of skeletal muscle at C3 (cm2) − 0.671*Age (years) + 0.640*Weight (kg) + 26.442*Sex (1 for female and 2 for male). SMI (cm2/m2) = CSA of skeletal muscle at L3 (cm2)/Length (m2). C3, third cervical vertebra; CSA, cross‐sectional area; CT, computed tomography; HU, Hounsfield units; L3, third lumbar vertebra.
Thereafter, calculations were made to estimate the CSA at L3 using the algorithm described by Swartz et al.[18] and was furthermore adjusted for patients height (m2) resulting in SMI (cm2/m2) (see legend of Figure 2). Sarcopenia, or low skeletal muscle mass, was based on a research of Wendrich et al.27 with a non‐gender specific SMI cut‐off point of <43.2 cm2/m2 (P < 0.001), which is best associated with the presence of chemotherapy dose‐limiting toxicity in HNC patients (lowest log‐likelihood value).27
The main observer (A. T. Z.) performed skeletal muscle analysis in all 112 patients. To evaluate inter‐observer and intra‐observer reliability, 25 patients were randomly selected and measured again by the main observer and another observer (A. H.).
Statistical analysis
Firstly, the patient cohort was described regarding the baseline. Continuous variables were presented as median and interquartile range or mean and standard deviation, for respectively non‐normal and normal distributed data. Normality was tested using Kolmogorov–Smirnov analysis. Ordinal or nominal variables were presented as absolute numbers and percentage of total. The outcome, or skeletal muscle mass status, was presented continuously based on SMI and dichotomously as sarcopenic and non‐sarcopenic based on previously published non‐gender specific cut‐offs for SMI.27 To evaluate correlations of CSA measurements at C3 level between right sternocleidomastoid muscle, left sternocleidomastoid muscle, and paravertebral muscles, inter‐observer and intra‐observer analyses were performed with bivariate Pearson's r correlation coefficients. Correlation between SMI and other continuous variables of frailty screening tools were also analysed with bivariate Pearson's r correlation coefficients. To evaluate whether frailty, impaired mobility, and risk of malnutrition are related to the skeletal muscle status of a patient, univariate logistic regression analyses were performed, with sarcopenia as dependent variable and the baseline variables as independent variables. In this way, odds ratios (ORs) and 95% CIs were provided. Variables that were statistically significant (α < 0.05) in the univariate regression (maximum 5)28 were included in the multivariate logistic regression in a backward manner. As gender was excluded to the multivariate regression analyses, we performed additional analysis with data stratified for gender and sarcopenia as dependent variable. Possible multicollinearity was analysed with variance inflation factors. SPSS version 23.0 (SPSS Inc., Chicago, IL, USA) was used for all statistical analysis.
Results
General patient and disease characteristics
This retrospective cohort study (on prospectively gathered data) incorporated 112 patients diagnosed with primary squamous cell carcinoma of the head and neck between November 2014 and September 2017. Pre‐treatment neck CT scans were analysed. A summary of general characteristics is presented in Table 2 and outcome of screening tools in Table 3. Most patients had oropharyngeal cancer (49%), followed by laryngeal (24%), oral (18%), and hypo‐pharyngeal (9%) cancer. Three‐quarters of patients had Stage IV advanced disease. The majority of the patient sample was male (73%), and the mean age at time of diagnosis was 63 (±9) years.
Table 2.
Demographic and clinical characteristics in patients with and without sarcopenia
| Total (n = 112) | Non‐sarcopenic (n = 58) | Sarcopenic (n = 54) | OR (95% CI) | P value | |
|---|---|---|---|---|---|
| Gender | |||||
| Male | 82 (73.2%) | 57 (98.3%) | 25 (46.3%) | 1 | |
| Female | 30 (26.8%) | 1 (1.7%) | 29 (53.7%) | 66.1 (8.5–512.7) | <0.001 |
| Age (years) | 63.2 (±9.2) | 61.9 (±8.9) | 64.5 (±9.4) | 1.0 (1.0–1.1) | 0.13 |
| BMI (kg/m2) | 23.4 (22.4–28.5) | 26.7 (24.1–30.0) | 23.0 (19.8–24.8) | 0.8 (0.7–0.9) | <0.001 |
| ACE‐27 | |||||
| 0–1 | 69 (61.6%) | 38 (65.5%) | 31 (57.4%) | 1 | |
| 2–3 | 43 (38.4%) | 20 (34.5%) | 23 (42.6%) | 1.4 (0.7–3.0) | 0.38 |
| Smoking | |||||
| Never | 9 (8.0%) | 6 (10.3%) | 3 (5.6%) | 1 | |
| Active/Quit | 103 (82.0%) | 52 (89.7%) | 51 (94.4%) | 1.96 (0.5–8.3) | 0.35 |
| Alcohol abuse | |||||
| No | 78 (75.0%) | 42 (75.0%) | 36 (75.0%) | 1 | |
| Yes | 26 (25.0%) | 15 (25.0%) | 12 (25.0%) | 1.0 (0.4–2.4) | 1.00 |
| Missing | 8 | 2 | 6 | ||
| Cancer site | |||||
| Oral cavity | 20 (17.9%) | 10 (17.2%) | 10 (18.5%) | 1 | 0.36a |
| Oropharynx | 55 (49.1%) | 25 (43.1%) | 30 (55.6%) | 1.2 (0.4–3.3) | 0.73 |
| Hypopharynx | 10 (8.9%) | 5 (8.6%) | 5 (9.3%) | 1.0 (0.2–4.6) | 1.00 |
| Larynx | 27 (24.1%0 | 18 (31.0%) | 9 (16.7%) | 0.5 (0.2–1.6) | 0.25 |
| Cancer stage | |||||
| III | 28 (25.0%) | 14 (24.1%) | 14 (25.9%) | 1 | |
| IV | 84 (75.0%) | 44 (75.9%) | 40 (74.1%) | 0.9 (0.4–2.1) | 0.83 |
ACE‐27, Adult Comorbidity Evaluation‐27 index; BMI, body mass index; C3, third cervical vertebra; CI, confidence interval; CSA, cross‐sectional area; OR, odds ratio.
A univariate logistic regression with sarcopenia as dependent variable (n = 112). Normal distributed data are presented with mean (SD) and non‐normal distributed data with median (interquartile range). Underscored P values are significant (α < 0.05).
Overall P value of variable.
Table 3.
Characteristics of screening tools in patients with and without sarcopenia
| Total (n = 112) | Non‐sarcopenic (n = 58) | Sarcopenic (n = 54) | OR (95% CI) | P value | |
|---|---|---|---|---|---|
| GFI | |||||
| Score | 2.0 (1.0–4.0) | 1.5 (1.0–3.8) | 3.0 (1.0–5.0) | 1.2 (1.0–1.4) | 0.026 |
| Missing | 2 | 2 | 0 | ||
| G8 | |||||
| Score | 14.0 (11.0–16.0) | 15.0 (12.8–16.0) | 12.0 (10.0–15.3) | 0.8 (0.7–0.9) | <0.001 |
| TUG | |||||
| Score (s) | 8.3 (7.0–10.4) | 8.0 (6.9–10.0) | 9.5 (7.3–12.5) | 1.0 (1.0–1.1) | 0.44 |
| Missing | 4 | 1 | 3 | ||
| MUST | |||||
| Low | 59 (52.7%) | 39 (67.2%) | 20 (37.0%) | 1 | 0.007 a |
| Medium | 21 (18.8%) | 8 (13.8%) | 13 (24.1%) | 3.2 (1.1–8.9) | 0.029 |
| High | 32 (28.6%) | 11 (19.0%) | 21 (38.9%) | 3.7 (1.5–9.2) | 0.005 |
G8, Geriatrics 8; GFI, Groningen Frailty Index; MUST, Malnutrition Universal Screening Tool; TUG, Timed Up and Go test.
A univariate logistic regression analysis with sarcopenia as dependent variable (n = 112). The non‐normal distributed data are presented with median (interquartile range). Underscored P values are significant (α < 0.05).
Overall P value of variable.
Prevalence of frail patients was 54% and 31% based on the G8 (≤14) and GFI (≥4) questionnaire, respectively. Median TUG time was 8 s, and five patients (5%) were classified as having an impaired mobility (TUG ≥20 s). Based on MUST, 29% of patients had a high risk of malnutrition.
Quantification of pre‐treatment skeletal muscle mass
Overall, mean SMI was 44.1 cm2/m2 (±8.1) in 112 patients and ranged between 27.1 and 65.1 cm2/m2. When applying the SMI cut‐off point of <43.2 cm2/m2 by Wendrich et al.,27 48% (n = 54) patients were classified as sarcopenic. Sarcopenia was present in 31% (n = 25) men and in 97% (n = 29) women. Solely one woman was classified as non‐sarcopenic.
Preferences for CT scan parameters were predominantly achieved in 112 CT scans: 73% (n = 82) had a ≤1 mm slice thickness, 94% (n = 106) was contrast enhanced, and 100% had a soft‐tissue kernel. If a slice thickness of 1 mm was not available, a 2 mm thickness was used as best alternative. In merely four cases, a deviating slice thickness was used, namely, 1.25 (n = 1), 1.5 (n = 2), and 2.5 (n = 1). The mean time between first consultation and the CT scan was 1.6 (±2.4) weeks.
Observer agreement of cross‐sectional measurements
Observer agreement was assessed in 25 random re‐selected CT scans. Distribution of CSA measurements per structure and observer can be found in Table 4. All measurements made in the observer analysis correlated significantly (P < 0.001). The total CSA of skeletal muscle at level of C3 had relatively the best observer agreement, resulting in a significant intra‐observer and inter‐observer variability of r = 0.99 and r = 0.98, respectively. The intra‐observer and inter‐observer variability per structure was also excellent: paravertebral muscles (intra‐observer, r = 0.99; inter‐observer, r = 0.98), right sternocleidomastoid muscle (intra‐observer, r = 0.97; inter, r = 0.93), and left sternocleidomastoid muscle (intra‐observer, r = 0.96; inter‐observer, r = 0.96).
Table 4.
Observer reliability and reproducibility
| Observer A. T. Z. | Observer A. H. | Inter‐observer | Intra‐observer | |||
|---|---|---|---|---|---|---|
| Area cm2 | Area cm2 | R | P value | R | P value | |
| Right sternocleidomastoid muscle | 3.68 (±1.12) | 3.82 (±1.21) | 0.931 | <0.001 | 0.974 | <0.001 |
| Left sternocleidomastoid muscle | 3.76 (±1.16) | 3.63 (±1.06) | 0.963 | <0.001 | 0.957 | <0.001 |
| Paravertebral muscles | 36.90 (±8.54) | 37.27 (±9.02) | 0.977 | <0.001 | 0.998 | <0.001 |
| Total CSA | 44.34 (±10.28) | 44.73 (±10.73) | 0.982 | <0.001 | 0.997 | <0.001 |
CSA, cross‐sectional area.
Observer agreement of measured CSA (cm2) at level of C3 in 25 neck computed tomography scans analysed with bivariate Pearson's r correlation coefficient. The normal distributed data are presented with mean (SD). Underscored P values are significant (α < 0.05).
Correlation analysis of skeletal muscle mass and frailty scores
Skeletal muscle mass status, measured in SMI, correlated best with the G8 score (r = 0.38, P < 0.001), followed by the GFI score (r = −0.27, P = 0.004). TUG and SMI did not correlate significantly with each other (r = −0.11). Scatterplots for SMI and frailty scores for both G8 and GFI are illustrated in Figure 3 (A1 and B2, respectively). Data were stratified for gender to clarify the effect of gender on the relation between SMI and frailty scores. Remarkably, G8 showed no differences in correlation with SMI between men and women (r = 0.45, P < 0.001, and P = 0.012, respectively). However, GFI correlated better to SMI in women (r = −0.35) compared with men (r = −0.18), but both of these correlations were not significant. Scatterplots, stratified for gender, with SMI and frailty scores for both G8 (male, A2; female, A3) and GFI (male, B2; female, B3) are presented in Figure 3.
Figure 3.

Scatterplots for skeletal muscle index and frailty scores. The figure illustrates the correlation of skeletal muscle index and frailty scores for both G8 (A) and GFI (B), with corresponding cut‐off values for frailty (≤14 and ≥4, respectively). Data of the whole cohort (1) are furthermore stratified into men (2) and women (3). The analysis is limited to patients who have completed the G8 (n = 112) and GFI (n = 110) questionnaire. G8, Geriatrics 8; GFI, Groningen Frailty Index.
Univariate and multivariate logistic regression
Tables 2 and 3 give an overview of the univariate logistic regression analysis with sarcopenia as the dependent variable. Women (OR 66.1, 95% CI 8.5–512.7), patients with higher GFI score (OR 1.2, 95% CI 1.0–1.4), high risk of malnutrition (OR 3.7, 95% CI 1.5–9.2), relatively low BMI (OR 0.8, 95% CI 0.7–0.9), and relatively low G8 score (OR 0.8, 95% CI 0.7–0.9) were related to sarcopenia. Patients with sarcopenia tend to have a higher TUG score compared with patients without sarcopenia, although not statistically significant (median 9.5 vs. 8.0 s, respectively). Of the five patients with impaired mobility (TUG ≥20 s), four patients were classified with sarcopenia. Sarcopenic patients also tended to have more moderate to severe comorbidities (42.6% vs. 34.5%), although also not statistically significant.
Body mass index was not included in the multivariate analysis as we assumed multicollinearity with G8 (variance inflation factor = 2.89; see Table 5 for the multivariate analysis). As all women (except for one) had sarcopenia, the following variables were considered in the multivariate analyses: G8, GFI, and MUST. The G8 score was found to be an independent variable associated with sarcopenia (OR 0.76, 95% CI 0.66–0.89, P < 0.001). In other words, a relatively low G8 score, which corresponds with ‘more’ frailty, was significantly and independently associated with the presence of sarcopenia.
Table 5.
Multivariate regression analysis for determining if frailty is related to sarcopenia
| OR (95% CI) | P value | |
|---|---|---|
| GFI | ||
| G8 | 0.76 (0.6–0.89) | <0.001 |
| MUST | ||
| Low | ||
| Medium | ||
| High | ||
G8, Geriatrics 8; GFI, Groningen Frailty Index; MUST, Malnutrition Universal Screening Tool.
Automatic backwards multivariate logistic regression for several included determinants with sarcopenia as dependent variable (n = 112). Underscored P values are significant (α < 0.05).
Univariate and multivariate logistic regression stratified by gender
We aimed to analyse men and women separately; however, analysis for women was not feasible as solely one female was not sarcopenic. Univariate regression analysis with men and sarcopenia as dependent variables distinguished age (OR 1.07, 95% CI 1.01–1.14, P = 0.021), BMI (OR 0.55, 95% CI 0.41–0.74, P < 0.001), G8 (OR 0.69, 95% CI 0.56–0.84, P < 0.001), and MUST (P < 0.001) as significant variables. As previously mentioned, we excluded BMI from the analysis as we assumed multicollinearity with G8. The multivariate regression analysis for men with sarcopenia as dependent variable is presented in Table 6. Multivariate logistic regression analysis in a backward manner isolated G8 as an independent variable associated with sarcopenia (OR 0.76, 95% CI 0.66–0.88, P < 0.001).
Table 6.
Multivariate regression analysis to assess predictors for sarcopenia, including only men
| OR (95% CI) | P value | |
|---|---|---|
| Age | ||
| G8 | 0.76 (0.66–0.88) | <0.001 |
| MUST | ||
| Low | ||
| Medium | ||
| High |
G8, Geriatrics 8; MUST, Malnutrition Universal Screening Tool.
Automatic backwards multivariate logistic regression for several included determinants with sarcopenia as dependent variable, including only men (n = 82). Underscored P values are significant (α < 0.05).
Discussion
In the present study, we investigated the relationship between sarcopenia and frailty in a large cohort of 112 patients with primary squamous cell carcinoma of the oropharynx, hypopharynx larynx, and oral cavity. This is the first study that confirms that sarcopenia is independently associated with frailty based on the G8 questionnaire in HNC patients. These results suggest that screening for sarcopenia on routinely obtained neck CT scans may replace time‐consuming frailty questionnaires in the future.
Previous studies showed that sarcopenia, based on CT quantitative analysis of skeletal muscle mass, in HNC patients, is prevalent with occurring in 35.5–54.5% of the HNC patients.19, 27, 29 Sarcopenia thus represents an important group that should be identified as they are at risk for complications. Prevalence of sarcopenia in our cohort is 48.2% and thus in line with previous published prevalence. CT‐derived sarcopenia has been previously related to chemotherapy dose‐limiting toxicity and worsened survival and is aggravated trough (chemo)radiotherapy in HNC patients.19, 27, 29, 30 However, despite being a significant problem, other associations of CT‐determined sarcopenia in HNC patients are underreported in literature. To our best knowledge, this is hence the first study that specifically determined skeletal muscle mass status with CT image analysis and its association with frailty in HNC patients. Lack of previous studies is probably due to the absence of abdominal CT scans in HNC patients, which are typically used at level of L3 to determinate the status of skeletal muscle mass. A recent study confirms this, showing that merely 190 (7%) of the 2840 HNC patients had an abdominal CT scan.19 The recent published algorithm of Swartz et al.,18 however, made it assessable to evaluate the skeletal muscle status from routinely made neck CT scans, as the CSA of skeletal muscle at C3 strongly correlates with the CSA of skeletal muscle at L3. Using this method and based on previously published cut‐off, we have determined sarcopenia using routinely made neck CT scans.
Sarcopenia and frailty are both geriatric syndromes that partially overlap but essentially differ from each other.31 Frailty is defined as a state where a minor stressor can induce major implications and is portrayed as loss of function in physical, psychological, and/or social domains.32 Sarcopenia represents a state with progressive and generalized loss of skeletal muscle mass and strength and is therefore more focused on the physical domain.31 Frailty hence goes further than the physical factors and incorporates the physiological and social dimensions as well, including social support and cognitive function.31 Our expected and demonstrated strong association between sarcopenia and frailty is also further explained on the physical domains as we showed that the G8 was related with low skeletal muscle mass, while this was not demonstrated for the GFI, the latter including social and more cognitive aspects of frailty. A recent systemic review showed a higher sensitivity for predicting frailty in the G8 questionnaire than in the GFI that were 87% and 57%, respectively.11 This suggests, G8 is a better questionnaireto recognize frailty compared to GFI, and thus support our found association of sarcopenia and frailty basedon G8. Furthermore, patients in our cohort categorized as sarcopenic had more often an impaired mobility (TUG ≥20 s) compared with patients without sarcopenia (4 vs. 1, respectively) although the continuous TUG score was not significantly related to sarcopenia. An impaired mobility as underlying factor for frailty has been previously conceptualized in the frailty phenotype by Fried et al.33 Although others were unable to find an association of sarcopenia (measured as SMI from abdominal CT scans) with the Carolina Frailty Index in geriatric patients with different kinds of oncology.34 However, studies using a physical frailty definition, with low handgrip strength and weight loss as part of its criteria, have a tendency to portray more overlap with sarcopenia.35, 36 More accordance with sarcopenia and frailty is also found when sarcopenia is determined with reduced handgrip strength and low gait speed, like the criteria of the European Working Group on Sarcopenia in Older People. Silver et al. found that the decline in lean body mass, or skeletal muscle mass, determined with dual‐energy X‐ray absorptiometry was associated with significant impairment in physical function in patients diagnosed with HNC.37 ‘Physical frailty’ and sarcopenia are considered as two common and largely overlapping conditions38 and support our demonstrated physical frailty in patients with sarcopenia in patients with HNC. Furthermore, our demonstrated malnutrition might further explain frailty and sarcopenia in line with previous research showing such correlation.37, 39, 40
Our study has several strengths. Firstly, the study was performed in a large group of >100 patients. Secondly, an excellent inter‐observer and intra‐observer agreements by the two investigators was demonstrated in the 25 (22%) re‐selected neck CT scans, proving that CSA measurements of skeletal muscle at level of C3 are both reproducible and reliable. Thirdly, we applied a strict selection procedure for CT scan parameters; most included patients had therefore the same applied CT scan parameters, resulting in relative minimal differences between the CT scans. Fourthly, a short period between the diagnosis and quantification of skeletal muscle mass was achieved (1.6 ± 2.4 weeks); thus, alternations in skeletal muscle due to other external and internal influences have been brought to the absolute minimum.
The major limitation of the present study is the lack of external validation of our findings. As strong points can be considered the prospective inclusion of patients and the relatively high participation rate. A limitation of the generalizability of the results is the exclusion of patients with infiltration of lymph node metastasis into the sternocleidomastoid muscle (n = 4). Swartz et al.18 found out that using the paravertebral muscles and doubling the single not infiltrated sternocleidomastoid muscle was equally predictive for CSA of skeletal muscle at L3 in comparison with the paravertebral muscles and both available sternocleidomastoid muscles. This would have been an option, but in some cases, both sternocleidomastoid muscles were infiltrated, and skeletal muscle mass analysis was therefore still not feasible (n = 2). An important note should be made to the cut‐off values of SMI to diagnose sarcopenic patients, as there is no consensus in the literature that SMI cut‐off values should be applied for categorizing patients with and without sarcopenia. Previous published cut‐off values for SMI are often based on survival or on lowest quartile,20 but our applied cut‐off of SMI (<43.2 cm2/m2) of Wendrich et al.27 is determined on the likelihood to develop chemotherapy dose‐limiting toxicity. As the study population of this study is very similar to our population, we applied this cut‐off value. However, we found that nearly all women were sarcopenic (97%) when applying the SMI threshold of Wendrich et al.27 The application of this threshold could be considered as a limitation. Hence, we did additional analysis with data stratified for gender. Frailty, based on G8 questionnaire, was identified as the only independent predictor for sarcopenia, for both the whole cohort as only men. Furthermore, correlation analysis between SMI and G8 frailty score did not differ between men and women, indicating that the outcome was not gender dependent.
This study showed a clear relationship between sarcopenia and physical frailty in HNC patients. Further research should ideally retest our findings in a second, larger, prospective, multicentre cohort study. Until our results are verified in such larger cohort, the CGA should remain the gold standard to identify frailty. Sarcopenia, as a biomarker in HNC patients has the potential to predict clinical outcome, treatment response, toxicity, post‐operative morbidity, and survival. Therefore, screening for sarcopenia would allow better selection of patients for intensive therapy, although further research is needed before this can be implemented. Further research should also test the predictive value of skeletal muscle mass regarding adverse clinical outcome in comparison with the current gold standard, the CGA. In addition to our quantitative analysis of skeletal muscle, qualitative research with muscle radio‐density should be performed to analyse its predictive value to frailty in the head and neck cohort. As recently, muscle density on CT imaging was reported to be more associated with the Carolina Frailty Index in older adults with cancer than muscle mass.34 However, such an analysis was not possible in our study, as included patients underwent contrast enhanced CT scans, which is not reliable for muscle density measurements.41 Furthermore, the predictive value of C3 measured skeletal muscle mass to identify frailty should be compared with L3 measured skeletal muscle. However, in our cohort, only a couple of patients had CT scans of both the neck and abdomen; therefore, this analysis was not feasible. Validation of skeletal muscle mass assessment on MRI and low dose CT neck scans would be of interest to ensure that all HNC patients can be screened for sarcopenia before, during, and after treatment.
Conclusions
We isolated a significant, independent relationship between the presence of sarcopenia, derived from neck CT image analysis, and frailty based on the G8 questionnaire in 112 HNC patients. Screening for sarcopenia using the CT‐derived skeletal muscle mass measurement potentially could replace time‐consuming frailty questionnaires; however, until this CGA has to remain the gold standard. Screening for sarcopenia could help to select the (un)suitable patients for therapy, which is highly clinically relevant. Furthermore, skeletal muscle mass status has the potential to be a cost‐effective, non‐invasive biomarker.
Ethical standards
The study design was approved by the scientific committee of Oncological Life Study (OncoLifeS), which is a large prospective oncological databiobank of the University Medical Center Groningen, University of Groningen from the Netherlands. This databiobank has been approved by the Ethics Committee of the UMCG. All admitted patients gave informed consent. The authors certify that they comply with the ethical guidelines for authorship and publishing of the Journal of Cachexia, Sarcopenia and Muscle. 42
Conflict of interest
All authors declare that they have no conflict of interest.
Zwart A. T., van der Hoorn A., van Ooijen P. M. A., Steenbakkers R. J. H. M., de Bock G. H., and Halmos G. B. (2019) CT‐measured skeletal muscle mass used to assess frailty in patients with head and neck cancer, Journal of Cachexia, Sarcopenia and Muscle, 10: 1060–1069. 10.1002/jcsm.12443.
Contributor Information
Aniek T. Zwart, Email: a.t.zwart@umcg.nl.
Gyorgy B. Halmos, Email: g.b.halmos@umcg.nl.
References
- 1. Global Burden of Disease Cancer Collaboration . Global, regional, and national cancer incidence, mortality, years of life lost, years lived with disability, and disability‐adjusted life‐years for 32 cancer groups, 1990 to 2015: A systematic analysis for the Global Burden of Disease Study. JAMA Oncol 2017;3:524–548. [DOI] [PMC free article] [PubMed] [Google Scholar]
- 2. Dutch Cancer Registry, managed by the IKNL© . URL: https://www.iknl.nl/oncologische‐zorg/tumorteams/hoofd‐halskanker. Accessed August 2018.
- 3. Argiris A, Karamouzis MV, Raben D, Ferris RL. Head and neck cancer. Lancet 2008;371:1695–1709. [DOI] [PMC free article] [PubMed] [Google Scholar]
- 4. Baxi S, Fury M, Ganly I, Rao S, Pfister D. Ten years of progress in head and neck cancers. J Natl Compr Canc Netw 2012;10:806–810. [DOI] [PMC free article] [PubMed] [Google Scholar]
- 5. Ferlay J, Shin HR, Bray F, Forman D, Mathers C, Parkin DM. Estimates of worldwide burden of cancer in 2008: GLOBOCAN 2008. Int J Cancer 2010;127:2893–2917. [DOI] [PubMed] [Google Scholar]
- 6. Mehanna H, West CML, Nutting C, Paleri V. Head and neck cancer—Part 2: treatment and prognostic factors. BMJ 2010;341:c4690. [DOI] [PubMed] [Google Scholar]
- 7. Boje CR. Impact of comorbidity on treatment outcome in head and neck squamous cell carcinoma – A systematic review. Radiother Oncol 2014;110:81–90. [DOI] [PubMed] [Google Scholar]
- 8. Santarpia L, Contaldo F, Pasanisi F. Nutritional screening and early treatment of malnutrition in cancer patients. J Cachexia Sarcopenia Muscle 2011;2:27–35. [DOI] [PMC free article] [PubMed] [Google Scholar]
- 9. Pottel L, Lycke M, Boterberg T, Pottel H, Goethals L, Duprez F, et al. Serial comprehensive geriatric assessment in elderly head and neck cancer patients undergoing curative radiotherapy identifies evolution of multidimensional health problems and is indicative of quality of life. Eur J Cancer Care (Engl) 2014;23:401–412. [DOI] [PubMed] [Google Scholar]
- 10. Parker SG, McCue P, Phelps K, McCleod A, Arora S, Nockels K, et al. What is comprehensive geriatric assessment (CGA)? An umbrella review. Age Ageing 2018;47:149–155. [DOI] [PubMed] [Google Scholar]
- 11. Hamaker ME, Jonker JM, de Rooij SE, Vos AG, Smorenburg CH, van Munster BC. Frailty screening methods for predicting outcome of a comprehensive geriatric assessment in elderly patients with cancer: a systematic review. Lancet Oncol 2012;13:e437–e444. [DOI] [PubMed] [Google Scholar]
- 12. Ma L, Sha G, Zhang Y, Li Y. Elevated serum IL‐6 and adiponectin levels are associated with frailty and physical function in Chinese older adults. Clin Interv Aging 2018;13:2013–2020. [DOI] [PMC free article] [PubMed] [Google Scholar]
- 13. Calvani R, Picca A, Marini F, Biancolillo A, Gervasoni J, Persichilli S, et al. A distinct pattern of circulating amino acids characterizes older persons with physical frailty and sarcopenia: results from the BIOSPHERE study. Nutrients 2018;10:1691. [DOI] [PMC free article] [PubMed] [Google Scholar]
- 14. Cruz‐Jentoft AJ, Bahat G, Bauer J, Boirie Y, Bruyere O, Cederholm T, et al. Sarcopenia: revised European consensus on definition and diagnosis. Age Ageing 2019;48:16–31. [DOI] [PMC free article] [PubMed] [Google Scholar]
- 15. Mourtzakis M, Prado CMM, Lieffers JR, Reiman T, McCargar LJ, Baracos VE. A practical and precise approach to quantification of body composition in cancer patients using computed tomography images acquired during routine care. Appl Physiol Nutr Metab 2008;33:997–1006. [DOI] [PubMed] [Google Scholar]
- 16. Mitsiopoulos N, Baumgartner RN, Heymsfield SB, Lyons W, Gallagher D, Ross R. Cadaver validation of skeletal muscle measurement by magnetic resonance imaging and computerized tomography. J Appl Physiol (1985) 1998;85:115–122. [DOI] [PubMed] [Google Scholar]
- 17. Shachar SS, Williams GR, Muss HB, Nishijima TF. Prognostic value of sarcopenia in adults with solid tumours: a meta‐analysis and systematic review. Eur J Cancer 2016;57:58–67. [DOI] [PubMed] [Google Scholar]
- 18. Swartz JE, Pothen AJ, Wegner I, Smid EJ, Swart KM, de Bree R, et al. Feasibility of using head and neck CT imaging to assess skeletal muscle mass in head and neck cancer patients. Oral Oncol 2016;62:28–33. [DOI] [PubMed] [Google Scholar]
- 19. Grossberg AJ, Chamchod S, Fuller CD, Mohamed AS, Heukelom J, Eichelberger H, et al. Association of body composition with survival and locoregional control of radiotherapy‐treated head and neck squamous cell carcinoma. JAMA Oncol 2016;2:782–789. [DOI] [PMC free article] [PubMed] [Google Scholar]
- 20. Joglekar S, Asghar A, Mott SL, Johnson BE, Button AM, Clark E, et al. Sarcopenia is an independent predictor of complications following pancreatectomy for adenocarcinoma. J Surg Oncol 2015;111:771–775. [DOI] [PMC free article] [PubMed] [Google Scholar]
- 21. Kazemi‐Bajestani SM, Mazurak VC, Baracos V. Computed tomography‐defined muscle and fat wasting are associated with cancer clinical outcomes. Semin Cell Dev Biol 2016;54:2–10. [DOI] [PubMed] [Google Scholar]
- 22. Riper H, Kramer J, Smit F, Conijn B, Schippers G, Cuijpers P. Web‐based self‐help for problem drinkers: a pragmatic randomized trial. Addiction 2008;103:218–227. [DOI] [PubMed] [Google Scholar]
- 23. Soubeyran P, Bellera CA, Gregoire F, Blanc J, Ceccaldi J, Blanc‐Bisson C. Validation of a screening test for elderly patients in oncology. Clin Oncol 2008;26:20568. [Google Scholar]
- 24. Steverink N, Slaets J, Schuurmans H, Van Lis M. Measuring frailty: developing and testing of the Groningen Frailty Indicator (GFI). Gerontologist 2001;41:236–237. [Google Scholar]
- 25. Podsiadlo D, Richardson S. The timed “Up & Go”: a test of basic functional mobility for frail elderly persons. J Am Geriatr Soc 1991;39:142–148. [DOI] [PubMed] [Google Scholar]
- 26. Anonymous Malnutrition Universal Screening Tool . 2011. https://www.bapen.org.uk/pdfs/must/. Accessed 05‐07 2018.
- 27. Wendrich AW, Swartz JE, Bril SI, Wegner I, de Graeff A, Smid EJ, et al. Low skeletal muscle mass is a predictive factor for chemotherapy dose‐limiting toxicity in patients with locally advanced head and neck cancer. Oral Oncol 2017;71:26–33. [DOI] [PubMed] [Google Scholar]
- 28. Peduzzi P, Concato J, Kemper E, Holford TR, Feinstein AR. A simulation study of the number of events per variable in logistic regression analysis. J Clin Epidemiol 1996;49:1373–1379. [DOI] [PubMed] [Google Scholar]
- 29. Nishikawa D, Hanai N, Suzuki H, Koide Y, Beppu S, Hasegawa Y. The impact of skeletal muscle depletion on head and neck squamous cell carcinoma. ORL J Otorhinolaryngol Relat Spec 2018;80:1–9. [DOI] [PubMed] [Google Scholar]
- 30. Chamchod S, Fuller CD, Mohamed ASR, Grossberg A, Messer JA, Heukelom J, et al. Quantitative body mass characterization before and after head and neck cancer radiotherapy: a challenge of height‐weight formulae using computed tomography measurement. Oral Oncol 2016;61:62–69. [DOI] [PMC free article] [PubMed] [Google Scholar]
- 31. Cruz‐Jentoft AJ, Baeyens JP, Bauer JM, Boirie Y, Cederholm T, Landi F, et al. Sarcopenia: European consensus on definition and diagnosis: report of the European Working Group on Sarcopenia in Older People. Age Ageing 2010;39:412–423. [DOI] [PMC free article] [PubMed] [Google Scholar]
- 32. Clegg A, Young J, Iliffe S, Rikkert MO, Rockwood K. Frailty in elderly people. Lancet 2013;381:752–762. [DOI] [PMC free article] [PubMed] [Google Scholar]
- 33. Fried LP, Tangen CM, Walston J, Newman AB, Hirsch C, Gottdiener J, et al. Frailty in older adults: evidence for a phenotype. J Gerontol A Biol Sci Med Sci 2001;56:M146–M157. [DOI] [PubMed] [Google Scholar]
- 34. Williams GR, Deal AM, Muss HB, Weinberg MS, Sanoff HK, Guerard EJ, et al. Frailty and skeletal muscle in older adults with cancer. J Geriatr Oncol 2018;9:68–73. [DOI] [PMC free article] [PubMed] [Google Scholar]
- 35. Reijnierse EM, Trappenburg MC, Blauw GJ, Verlaan S, de van der Schueren MA, Meskers CG, et al. Common ground? The concordance of sarcopenia and frailty definitions. J Am Med Dir Assoc 2016;17:371.e7–371.e12. [DOI] [PubMed] [Google Scholar]
- 36. Mijnarends DM, Schols JM, Meijers JM, Tan FE, Verlaan S, Luiking YC, et al. Instruments to assess sarcopenia and physical frailty in older people living in a community (care) setting: similarities and discrepancies. J Am Med Dir Assoc 2015;16:301–308. [DOI] [PubMed] [Google Scholar]
- 37. Silver HJ, Dietrich MS, Murphy BA. Changes in body mass, energy balance, physical function, and inflammatory state in patients with locally advanced head and neck cancer treated with concurrent chemoradiation after low‐dose induction chemotherapy. Head Neck 2007;29:893–900. [DOI] [PubMed] [Google Scholar]
- 38. Calvani R, Marini F, Cesari M, Tosato M, Anker SD, von Haehling S, et al. Biomarkers for physical frailty and sarcopenia: state of the science and future developments. J Cachexia Sarcopenia Muscle 2015;6:278–286. [DOI] [PMC free article] [PubMed] [Google Scholar]
- 39. Cruz‐Jentoft AJ, Landi F, Schneider SM, Zuniga C, Arai H, Boirie Y, et al. Prevalence of and interventions for sarcopenia in ageing adults: a systematic review. Report of the International Sarcopenia Initiative (EWGSOP and IWGS). Age Ageing 2014;43:748–759. [DOI] [PMC free article] [PubMed] [Google Scholar]
- 40. Chasen MR, Bhargava R. A descriptive review of the factors contributing to nutritional compromise in patients with head and neck cancer. Support Care Cancer 2009;17:1345–1351. [DOI] [PubMed] [Google Scholar]
- 41. van Vugt JLA, van den Braak RRJC, Schippers HJW, Veen KM, Levolger S, de Bruin RWF, et al. Contrast‐enhancement influences skeletal muscle density, but not skeletal muscle mass, measurements on computed tomography. Clin Nutr 2018;37:1707–1714. [DOI] [PubMed] [Google Scholar]
- 42. von Haehling S, Morley JE, Coats AJS, Anker KM, Levolger SD. Ethical guidelines for publishing in the Journal of Cachexia, Sarcopenia and Muscle: update 2017. J Cachexia Sarcopenia Muscle 2017;8:1081–1083. [DOI] [PMC free article] [PubMed] [Google Scholar]