Abstract
Background
Due to high nuclease activity and complex contents in urine, urinary cell‐free DNA (ucfDNA) was prone to degrade. So, we developed standardized urine collection tube (UCT) to prevent ucfDNA degradation and simultaneously maintain urinary cells in their original form during the sample collection process, ensuring stabilization of the original proportion and integrity of ucfDNA.
Methods
Urine samples were collected from bladder cancer patients and divided into 10‐mL normal tubes and 10‐mL UCTs, respectively, and kept at ambient temperature. Urine supernatant was separated by centrifuging, and ucfDNA was extracted. Then ucfDNA was quantified by quantitative real‐time polymerase chain reaction. UcfDNA fragments distribution was analyzed by Agilent 2200, and the frequency of specific mutations of urinary system disease was detected by next‐generation sequencing method.
Results
Urine collected into UCTs showed no statistically significant changes in their original proportion and integrity of ucfDNA up to 7 days at ambient temperature and also ucfDNA fragments were maintained well. Conversely, urine collected into normal tubes was observed an obviously decline in their original proportion of ucfDNA and ucfDNA fragments changed greatly. The △% of allele fraction (AF) for specific genes of ucfDNA from UCTs was lower than from normal tubes by 3.7‐fold.
Conclusion
Using UCTs, they can maximally keep the original proportion and integrity of ucfDNA and stabilize urinary cells and minimize the background noise caused by urinary cellular DNA releasing, it will be help to open the door of next‐generation noninvasive liquid biopsy applications utilizing urine.
Keywords: liquid biopsy, noninvasive, preservation, urinary cell‐free DNA, urine
Abbreviations
- ACTB
actin beta
- AF
allele fraction
- BWA
Burrows‐Wheeler Aligner
- CT
cycle threshold
- FQ
FASTQ
- NGS
next‐generation sequencing
- qPCR
quantitative real‐time polymerase chain reaction
- SNV
single nucleotide variants
- ucfDNA
urinary cell‐free DNA
- UCT
urine collection tube
1. INTRODUCTION
Compared with traditional tissue biopsy, liquid biopsy is a minimally invasive to noninvasive procedure to obtain circulating tumor cells and cell‐free DNA from blood, urine, or other bodily fluids. It has been used widely for assessing patients with various cancers, such as in cancer diagnosis and prognosis, for checking residual disease and the risk of relapse, for treatment selection, and in monitoring disease burden.1 Liquid biopsy samples are often blood, urine, and saliva. Blood is used more in clinical studies and tests. Urine is a promising source of molecular diagnostic material. It is a truly noninvasive sample collection method, and its advantages include a large volume and easy, friendly sampling without the need for professional assistance, which can promote higher compliance and aid in widespread use of the method in clinical medicine and health examinations. Urinary DNA can be obtained from two components, which are easily separated by centrifugation: ucfDNA from the urine supernatant and cellular DNA from the urine cell sediment.2 Moreover, ucfDNA has more tumor‐derived DNA and allows for better detection of key genomic biomarkers than cellular DNA. Thus, it serves as a promising resource for robust tumor profiling with the potential to influence clinical decisions via noninvasive patient interventions.3
Recently, there have been more studies focused on ucfDNA. UcfDNA quantity and a high integrity of the fragments are critical for potential diagnostic and prognostic biomarker detection of bladder cancer.4, 5, 6, 7, 8 Studies about the distribution of ucfDNA fragments indicated that the higher molecular weight DNA, greater than 1 kb, is an important feature of ucfDNA.9, 10, 11 UcfDNA is also a promising biomarker for tumor liquid biopsy and has been used to detect tumor‐derived genes based on its high tumor genome load; this can also allow detection of tumor‐derived gene mutations.11, 12, 13, 14 Even tumor‐derived genes from liver cancer,15 lung cancer,16 colorectal cancer,17, 18, 19 and breast cancer20 have been detected in ucfDNA.
However, nuclease activity, especially DNase I activity, in urine is higher than in blood, as much as 100‐fold more, and DNase II activity is also higher.9 These conditions make ucfDNAs prone to degradation. To mitigate this problem, some researchers have added EDTA or EDTA‐K3 solution to urine samples to inhibit nuclease activity.5, 21, 22, 23, 24, 25, 26, 27, 28 Other precautions such as using a sterile container to collect urine4, 8, 29, 30, 31 and keeping urine samples at 4°C6, 32 or on ice3 to reduce nuclease activity. Unfortunately, these procedures make urine collection and transport inconvenient and may threaten the stability of the ucfDNA. Therefore, it is necessary to develop new methods that can allow for easy urine sample collection and preservation of the original proportion and integrity of ucfDNA, while maintaining urine cells in their original, damage‐free states. In our study, we developed such a method to keep the original proportion and integrity of ucfDNA from patients with bladder cancer.
2. METHODS AND MATERIALS
2.1. Donor recruitment
Patients with bladder cancer were recruited from XiangYa Hospital of Central South University, Changsha, China. This study was approved by XiangYa Hospital Medical Ethics Committee acting as the Institutional Review Board in Central South University, and an informed consent form was provided and collected from all donors before urine collection. A total of 24 patients with bladder cancer were recruited: Fifteen donors were recruited for normal room temperature tests, and another 9 donors were recruited for shipping tests.
2.2. Urine collection
At least 160 mL of first‐morning urine was collected into a special urine cup from each donor and then quickly divided into two groups of tubes with 10 mL of urine each: for this trial, 8 UCTs and 8 tubes blank control tubes. The UCTs contained proprietary chemicals from Hunan UPSBio, Inc., Changsha, China to inhibit ucfDNA degradation and to stabilize cells in the urine, while the blank normal tubes did not have any added chemicals. Urine was mixed up and down 10 times after transfer to the tubes. After urine sampling was finished in XiangYa Hospital of Central South University, the samples were immediately sent to Hunan UPSBio, Inc., for subsequent processing within 2 hours.
2.3. Sample processing and grouping
The experimental and control samples each consisted of 8 tubes of urine samples. Half of each set were centrifuged at 1600× g for 10 minutes, and urine supernatant was carefully transferred to a new tube without disturbing urine cell sediments. More specifically, the samples were divided as follows: (a) four centrifuged samples without urine cell sediments from normal tubes; (b) four samples that were not centrifuged from normal tubes; (c) four centrifuged samples without urine cell sediments from UCTs; and (d) four samples that were not centrifuged from UCTs. Samples were placed at ambient temperature, and ucfDNAs were extracted at 2 hours, 24 hours, 72 hours, and 7 days for each group. Next, we assessed the stability of ucfDNA under experimental shipping conditions; the following tests were conducted; (e) four centrifuged samples without urine cell sediments from normal tubes; (f) four samples that were not centrifuged from normal tubes; (g) four centrifuged samples without urine cell sediments from UCTs; and (h) four samples that were not centrifuged from UCTs. UcfDNAs were also extracted at 2 hours, 24 hours, 72 hours, and 7 days. The tubes were placed in an HS‐1 vertical mixer (Xinzhi, Ningbo, China) for 10 rpm for at least 18 hours every day at ambient temperature to simulate shipping conditions.
In brief, the original proportion and integrity of ucfDNA tends to be affected in two aspects: the degradation of ucfDNA and the release of cellular DNA from urine cell sediments. Therefore, we investigated the preservative effect of UCTs on these two aspects by centrifuging at 1600× g for 10 minutes to separate urine supernatant and urine cell sediment.
2.4. UcfDNA isolation
Before isolation, urine samples were centrifuged at 1600× g for 10 minutes; then, 1.9 mL of urine supernatant was carefully transferred to new 2‐mL tubes and centrifuged again at 16 000× g, 4°C for 10 minutes. Then, 1.8 mL of urine supernatant was purified by commercial MagMAX™ Cell‐Free DNA Isolation kit (Applied Biosystems Inc., Foster City, CA, USA). According to the manufacturer's protocol, ucfDNA was isolated through treating the samples with proteinase K (Tiangen, Beijing, China), and ucfDNA was eluted in 50 μL of elution solution and stored at −80°C until for further analysis. Then, a sample from same time point for each group was extracted in triplicate.
2.5. UcfDNA quantification
The concentration of ucfDNA samples was measured by Qubit™ 3.0 Fluorometer (Invitrogen Inc, Carlsbad, CA, USA) following the manufacturer's instructions for the Qubit™ dsDNA HS Assay kit (Invitrogen Inc).
2.6. Real‐time quantitative PCR
ACTB (actin beta), a highly conserved and single‐copy human gene, was chosen to measure the original proportion and integrity of ucfDNA by real‐time quantitative PCR (QPCR). Two primer pairs that amplify targets of 41 bp and 127 bp were designed within ACTB; the primer pairs sequences are summarized in Table 1. According to previous studies, ucfDNA fragments sizes can range from 150 bp to more than 1 kb. A 2‐μL template ucfDNA sample was mixed with SuperReal PreMix Plus (SYBR Green) kit (Tiangen, Beijing, China) and each primer pair to produce 20‐μL reactions. All real‐time quantitative PCR assays were carried out with an ABI QuantStudio 3 Real‐time PCR System (Applied Biosystems Inc.). All qPCR reactions were done in triplicate.
Table 1.
Details for primers sequences of ACTB
| Primers sequences | Primer names | Amplicon size |
|---|---|---|
| AATCTGGCACCACACCTTC | ACTB‐41‐F | 41 bp |
| GAGCCACACGCAGCTCATT | ACTB‐41‐R | 41 bp |
| AACACTGGCTCGTGTGACAA | ACTB‐127‐F | 127 bp |
| AGAACACGGCTAAGTGTGCT | ACTB‐127‐R | 127 bp |
Theoretically, the ACTB‐41 bp assays can amplify almost all of the ucfDNA fragments, and the ucfDNA sizes ranged from shorter than 100 bp to larger than 1 kb. It proved difficult to measure the initial template ucfDNA in the qPCR assays. So, the ACTB‐41 bp assay was used as internal control and assays from samples collected at 2 hours from each group were used as a standard control. The average 2–△△Ct of the ACTB‐127 bp assays were analyzed to measure the relative percentage of ≥ 127‐bp fragments, so the percentage of ≥ 127‐bp fragments at 2 hours was standardized as 1.
2.7. UcfDNA fragment tests
The 2‐ hours ucfDNA samples that had concentrations greater than 4.0 ng/μL, according to the results of ucfDNA quantification by Qubit™ 3.0 Fluorometer, were tested by the Agilent 2200 TapeStation system (Agilent Technologies, USA) to obtain a relatively high‐quality electropherogram. Operations were conducted according to manufacturer's protocol, and 2 μL of each ucfDNA sample was used in this test.
2.8. Library preparation and massively parallel DNA sequencing
DNA libraries were prepared with up to 30 ng ucfDNA by using KAPA LTP Library Preparation Kit (KAPA Biosystems, USA) following the manufacturer's instructions. Molecular barcodes were used to minimize the background noise. Multiplex PCR was conducted using the QIAGEN Multiplex PCR Plus Kit (Qiagen, Germany) according to the product handbook. DNA sequencing was performed by an Illumina X Ten sequencer using the 150‐bp paired‐end mode.
UcfDNA from groups B and D for 2 hours and 7 days was conducted for this experiment. Control experiments were carried out in group B. Five samples—No. 2, 5, 6, 7, and 9—were chosen to finish this test.
2.9. Sequencing data analysis
An in‐house data analysis pipeline was used and is summarized as follows: (a) The software cutadapt (v1.14) was used for removing Illumina TruSeq adapters and discarding reads with too many N bases; fastqc (v0.11.5) was used for the FASTQ quality control report; (b) a self‐defining Python script was used to detect and remove insert barcodes from both read 1 and read 2; (c) burrows‐wheeler aligner (BWA) mem (v0.7.17) was used for alignment of reads to the human reference genome (GRCh38), and Picard (v2.17.5) was used for removing duplicate reads; (d) a read was extracted if it met all of the following conditions: had an insert barcode, Map Quality ≥ 30, Base Quality ≥ 13, and the read 1 start position was equal to the start position of the upstream‐near specific primer or the read 1 end position was equal to that of the downstream‐near specific primer (other information such as the length of the insert fragments and its start and end positions were also output); (e) the insert fragments came from one molecule if they had the same start and end positions and also the same insert barcode; at least 3 insert fragments were required to merge them into one unique fragment; and (f) single nucleotide variants (SNV) were called if the allele fraction (AF) ≥ 1%, depth ≥ 100, and allele count ≥ 30. The △% of AF was used to measure the stability of the original proportion and integrity of the ucfDNA.
△% of AF = [AF (7 days)–AF (2 hours)/AF (2 hours)] × 100%.
2.10. Statistical analysis
Python package scipy was used to calculate P‐value and confidence interval. We performed stats.ttest_ind () for a two‐tailed t test for pairwise comparisons, and stats.t.interval () was used to estimate confidence intervals for each group.
3. RESULTS
3.1. UcfDNA degradation was relatively extensive under normal conditions
To study ucfDNA degradation, 15 urine samples were collected and stored at room temperature. UcfDNA degradation is visualized in Figure 1; samples in group A had urinary cells removed by centrifugation and samples in group B did not. In group A, the ≥127‐bp fragments percentage of ucfDNA decreased in a time‐dependent manner; the median at 24 hours, 72 hours, and 7 days was 0.799 ([0.56, 0.70], 95% CI), 0.494 ([0.33, 0.65], 95% CI), and 0.398 ([0.18, 0.71], 95% CI), respectively. There was a dramatic decline at 72 hours. The status of group B suggested that ucfDNA degradation apparently slowed; the median at 24 hours, 72 hours, and 7 days was 0.948 ([0.73, 1.00], 95% CI), 0.806 ([0.53, 0.84], 95% CI), and 0.548 ([0.36, 0.66], 95% CI), respectively. Compared with the initial 2‐ hours sample, statistically significant ucfDNA degradation was observed in group A for ≥127‐bp fragments percentage at 24 hours (P < 0.05), 72 hours (P ≤ 0.001), and 7 days (P ≤ 0.001. In group B, statistically significant ucfDNA degradation was observed at 24 hours (P < 0.05), 72 hours (P < 0.01), and 7 days (P ≤ 0.001). This suggested that ucfDNA was extensively degraded in the urine of patients with bladder cancer.
Figure 1.
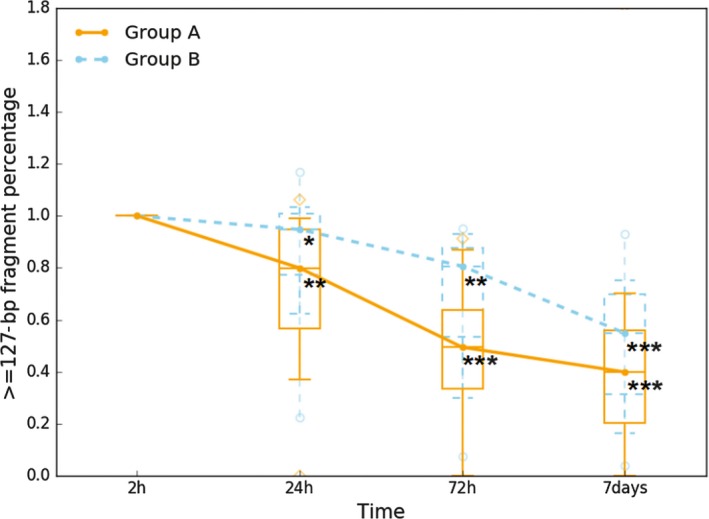
UcfDNA degradation in urine samples from patients with bladder cancer. UcfDNA degradation was tested in 15 patients with bladder cancer. Samples were collected by normal tubes, and groups A and B were, respectively, expressed samples without urinary cells and with urinary cells. In each box plot, the line inside of the box indicates the median value; the limits of the box indicate the 75th and 25th percentiles. The upper and lower error bars, respectively, represent the 5th and 95th percentiles. The uppermost and lowermost plots represent the maximum and minimum values. Statistically significant UcfDNA time‐dependent degradation was observed (*P < 0.05, **P < 0.01, ***P ≤ 0.001 by paired Student's t test)
3.2. Stabilization of ucfDNA from preserved urine
Given that ucfDNA degradation is serious, the methods to preserve ucfDNA are necessary for the study of urine. Thus, we developed UCTs containing proprietary chemicals capable of maintaining the original proportion and integrity of ucfDNA and stabilizing the urinary cells. We evaluated the effect of two conditions using UCTs, urinary cells were removed by centrifugation to observe the original proportion and integrity of ucfDNA in group C, while urinary cells remained in group D to observe the stabilization of the urinary cells. As shown in Figure 2, compared with the 2‐ hours blank control group A, without urinary cells, and group B, with urinary cells, there were no statistically significant changes in ucfDNA from UCTs during 7 days. The median values in group C at 24 hours, 72 hours, and 7 days were 0.989 ([0.96, 1.06], 95% CI), 0.981 ([0.94, 1.04], 95% CI), and 0.949 ([0.87, 1.02], 95% CI), respectively. The median values in group D at 24 hours, 72 hours, and 7 days were 0.973 ([0.93, 1.03], 95% CI), 0.982 ([0.93, 1.02], 95% CI), and 0.959 ([0.89, 1.02], 95% CI), respectively. This indicated that the original proportion and integrity of ucfDNA can be preserved effectively, and the urinary cells can be stabilized by using UCTs at least for 7 days.
Figure 2.
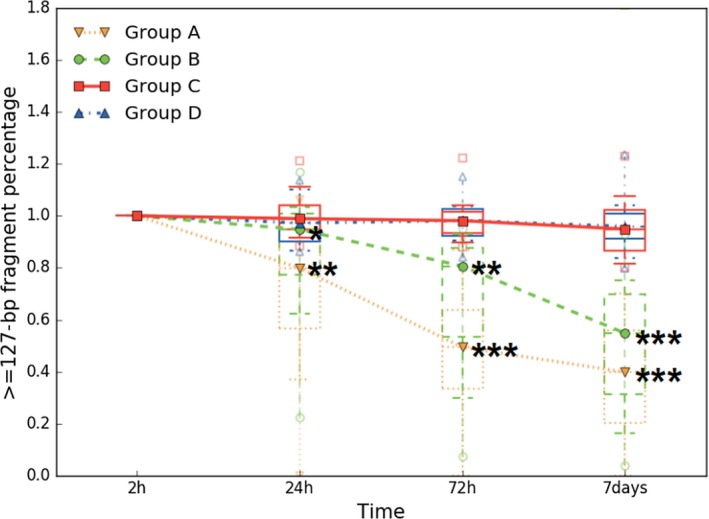
Preservative effect of ucfDNA through UCTs. Urine samples were collected from 15 patients and placed at ambient temperature. Groups A and B were, respectively, expressed samples without urinary cells and with urinary cells by using normal tubes, and groups C and D were, respectively, expressed samples without urinary cells and with urinary cells by using UCTs. In each box plot, the line inside of the box indicates the median value; the limits of the box indicate the 75th and 25th percentiles. The upper and lower error bars, respectively, represent the 5th and 95th percentiles. The uppermost and lowermost plots represent the maximum and minimum values. Over time, statistically significant ucfDNA changes were not observed in groups C and D. Statistically significant ucfDNA time‐dependent degradation was only observed in groups A and B (*P < 0.05, **P < 0.01, ***P ≤ 0.001 by paired Student's t test)
3.3. Profiles of ucfDNA fragment changes
Two samples with higher ucfDNA concentrations at 2 hours were chosen to test changes in the ucfDNA of fragment distribution by the Agilent 2200 TapeStation system. Samples No. 7 and No. 9 samples, whose ucfDNA concentrations at 2 hours were 6.72 ng/μL and 4.90 ng/μL, respectively, were used. The blue line, orange line, green line, and red line, respectively, indicated the ucfDNA fragments distribution at 2 hours, 24 hours, 72 hours, and 7 days for each group. The lower marker represented 25 bp, and the upper marker represented 1500 bp.
The electropherograms of the No. 7 sample are shown in Figure 3. For group A and group B compared with the fragments distribution at 2 hours, there was no significant change at 24 hours, but an obvious peak among 100‐400 bp was observed at 72 hours (green line) and larger fragments decreased (red circle). At 7 days, ucfDNA apparently degraded, but in group B, there was still a peak (red arrow). However, in group C and group D, there were no significant changes of ucfDNA fragments distribution features from the preserved urine samples.
Figure 3.
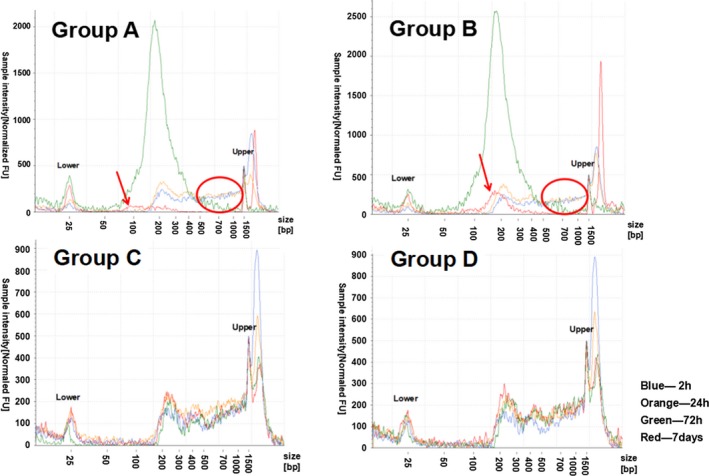
Electropherograms of ucfDNA samples No. 7. Groups A and B were, respectively, expressed samples without urinary cells and with urinary cells by using normal tubes, and groups C and D were, respectively, expressed samples without urinary cells and with urinary cells by using UCTs. The x‐axis represents the different sizes of the marker; the valid region was between the lower and upper sizes. The y‐axis represents the normalized sample intensity; the regions with high intensity demonstrate a high concentration
The electropherograms of the No. 9 urine sample are shown in Figure 4. Compared with the fragments distribution at 2 hours, there was also no significant change at 24 hours in groups A and B, but an obvious decline in the peak at 150‐400 bp was observed at 72 hours (green line) and larger fragments obviously decreased (red circle) in group A. At 7 days, ucfDNA degraded to nearly undetectable levels (red arrow). However, in group B, there was a reduction in relatively unusually large fragments (red arrow) and a relatively stable peak at approximately 200 bp. However, there were no obvious changes of ucfDNA fragments distribution features from the preserved urine samples.
Figure 4.
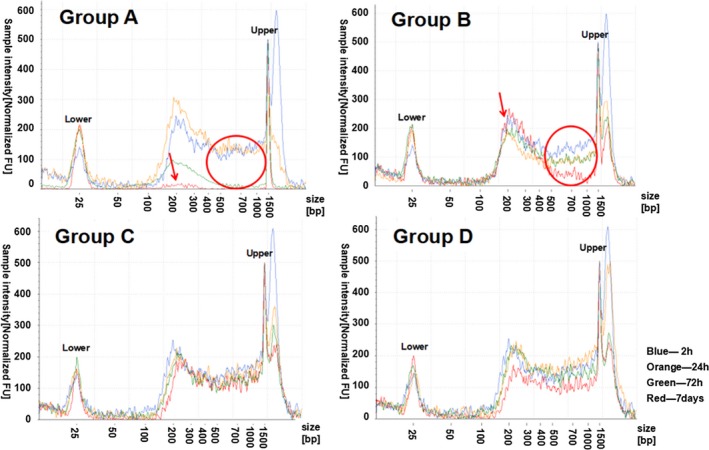
Electropherograms of ucfDNA samples No. 9. Groups A and B were, respectively, expressed samples without urinary cells and with urinary cells by using normal tubes, and groups C and D were, respectively, expressed samples without urinary cells and with urinary cells by using UCTs. The x‐axis represents the different sizes of the marker; the valid region was between the lower and upper sizes. The y‐axis represents the normalized sample intensity; the regions with high intensity demonstrate a high concentration
3.4. Slight changes of ucfDNA under experimental shipping conditions
To explore ucfDNA stabilization by using UCTs under experimental shipping conditions, 9 urine samples were collected to observe the ucfDNA changes. The results from analyzing the qPCR data for the experimental shipping conditions are shown in Figure 5. In group E, the median values at 24 hours, 72 hours, and 7 days were 0.884 ([0.58, 0.97], 95% CI), 0.470 ([0.27, 0.68], 95% CI), and 0.280 ([0.05, 0.89], 95% CI), respectively. Statistically significant ucfDNA degradation was observed at 24 hours (P < 0.01), 72 hours (P ≤ 0.001), and 7 days (P ≤ 0.001). The median values in group F at 24 hours, 72 hours, and 7 days were 0.963 ([0.80, 1.05], 95% CI), 0.828 ([0.52, 0.86], 95% CI), and 0.532 ([0.32, 0.73], 95% CI), respectively. Statistically significant ucfDNA degradation was observed at 72 hours (P ≤ 0.05) and 7 days (P ≤ 0.001). A relative delay of ucfDNA degradation appeared in group F compared with group E. Using UCTs under the experimental shipping condition, the median values in group G at 24 hours, 72 hours, and 7 days were 1.072 ([0.96, 1.12], 95% CI), 0.909 ([0.88, 1.03], 95% CI), and 0.945 ([0.88, 1.05], 95% CI), respectively. In group H, the median values at 24 hours, 72 hours, and 7 days were 1.026 ([0.93, 1.07], 95% CI), 0.961 ([0.88, 1.02], 95% CI), and 1.001 ([0.92, 1.07], 95% CI), respectively. There were slight changes in ucfDNA in groups G and H, but they were not statistically significant, which suggested that ucfDNA stabilization can be maintained by UCTs under experimental shipping conditions.
Figure 5.
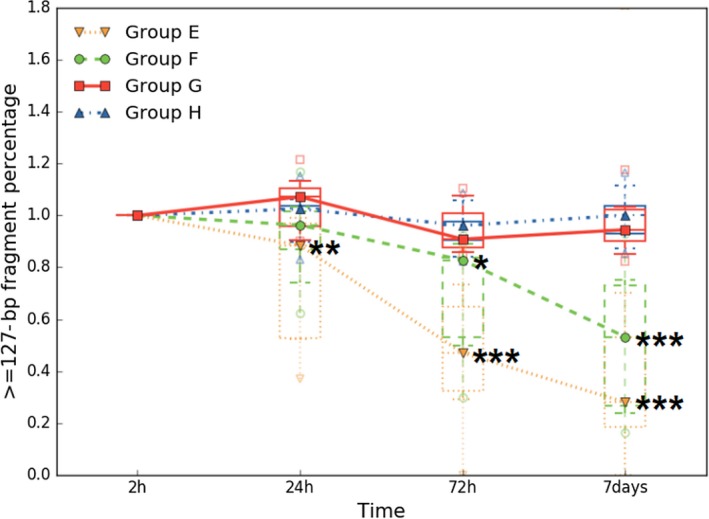
Preservative effect of ucfDNA by using UCTs under experimental shipping conditions. Urine samples were collected from 9 patients and placed on a vertical mixer at ambient temperature. Groups E and F were, respectively, expressed samples without urinary cells and with urinary cells by using normal tubes, and groups G and H were, respectively, expressed samples without urinary cells and with urinary cells by using UCTs. In each box plot, the line inside of the box indicates the median value; the limits of the box indicate the 75th and 25th percentiles. The upper and lower error bars, respectively, represent the 5th and 95th percentiles. The uppermost and lowermost plots represent the maximum and minimum values. Over time, statistically significant ucfDNA changes were not observed in groups G and H. Statistically significant ucfDNA time‐dependent degradation was observed in groups E and F (*P < 0.05, **P < 0.01, ***P ≤ 0.001 by paired Student's t test)
3.5. Small changes in allele fraction of preserved urine
To further investigate the original proportion and integrity of ucfDNA from the UCTs, the AF was detected using next‐generation sequencing (NGS).We used a panel that contained genes associated with diseases of the urinary system, which can reflect changes of ucfDNA associated with the specific disease. As shown in Figure 6, the Δ% of AF was used to measure the change of allele frequency variation in the ucfDNA. The average Δ% of AF of 7 days for groups B and D were 0.477% and 0.129%, respectively. The average Δ% of AF of group D was lower than group B by 3.7‐fold, which suggested that the original proportion and integrity of ucfDNA from UCTs can be preserved well. If the original proportion and integrity of ucfDNA would have had a large change, the allele fraction would also be obviously changed, increasing, or decreasing.
Figure 6.
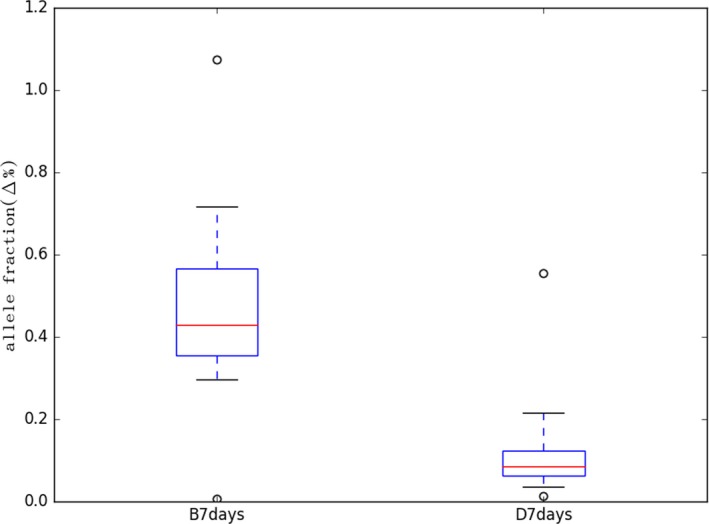
Changes in allele fraction. NGS data were analyzed from five samples (No. 2, 5, 6, 7, 9). Samples of groups B and D were, respectively, collected by normal tubes and UCTs with urinary cells and with urinary cells. The analysis results of 2 h for group B were the control of 7 days for group B, and the analysis results of 2 h for group D were the control of 7 days for group D. X‐axis represents the Δ% of AF
4. DISCUSSION
Nuclease activity in urine is much higher than in blood,9 so inhibiting nuclease activity is necessary during urine collection and storage. While there have been few reports about urine collection, only sterile containers have previously been required, even in remote areas.33 An important factor limiting the effective use of urine collection is serious ucfDNA degradation; the half‐life of ucfDNA is generally very short. In fact, compared with serum and saliva, urine contents have a much stronger effect on DNA degradation.34 Previous studies demonstrated that in renal stone patients, ucfDNA in both the renal pelvis and voided urine was degraded under first‐order kinetics with a half‐life of 2.6‐5.1 hours.24 The rapid process of ucfDNA degradation may result in flawed accuracy and precision in the initial fragments profile and concentration. Urine contents can be correlated with urological tumors, stones, infections, or other physiological changes. The contents of urine from patients tend to be much more complex than urine from healthy individuals. EDTA is a chemical commonly used to protect DNA from degradation because it can inhibit nuclease activity. In some studies, EDTA was used to preserve ucfDNA at 4°C, quickly centrifuged to remove urinary sediment and stored at −80°C or −20°C or immediately extracted after sampling; however, this procedure is difficult for widespread usage to maximally protect ucfDNA.3, 11, 24, 25, 31, 35, 36
For potential biomarker use, the original proportion and integrity of ucfDNA is a very important factor in liquid biopsy. When the original proportion and integrity of ucfDNA is damaged, the target sequence may fail to amplify by PCR. Because the detection of most low‐frequency mutations in liquid biopsies depends on DNA amplification, the original proportion and integrity of ucfDNA must be maintained. Another key factor affecting low‐frequency mutation detection is background interference because of the degradation of longer ucfDNA and the release of cellular DNA originating from broken urinary cells can affect the proportion of the target ucfDNA. Therefore, the allele frequency of the target ucfDNA may be influenced, especially for low‐frequency alleles. The original proportion and integrity of ucfDNA can be protected by UCTs up to 7 days at ambient temperature.
The sample collection process is also an important preanalytical factor that can affect ucfDNA detection. Currently, the majority of ucfDNA studies have been performed at the same location where the urine was collected or close to urine collection site, and the urine sample must be placed at 4°C or a lower temperature and centrifuged immediately to minimize the ucfDNA degradation and release of cellular DNA. Thus, it is difficult to transport to another site. The new method that we had developed can be used to solve these preanalytical issues. We showed that UCTs can protect ucfDNA from degradation and can stabilize the urinary cells, thus ensuring that the original proportion and integrity of ucfDNA was maintained for up to 7 days at room temperature. This method provides an easier and more convenient way for collection, handling, shipment, and storage of urine.
5. CONCLUSIONS
We found that ucfDNA was severely degraded in urine and that broken‐down fragments of urinary cellular DNA were presumably released into the urine, which resulted in an increase of ucfDNA concentration without any protection for the original ucfDNA. Using UCTs to preserve urine, the original proportion and integrity of ucfDNA can be maintained and the urinary cells can be stabilized to minimize the release of cellular DNA and degradation for up to 7 days. Even under simulated long‐term shipping conditions, the ucfDNA stability was very high. The limitation of our study was the lack of a direct experimental comparison between UCTs and EDTA tubes to evaluate the preserving effect, which deserved further detailed investigation.
Supporting information
ACKNOWLEDGMENTS
We thank the College of Biological and Environmental Engineering of Changsha University for providing the ABI QuantStudio 3 Real‐time PCR System. We also thank Novogene (Beijing, China) for providing the X Ten sequencing service.
Li P, Ning J, Luo X, et al. New method to preserve the original proportion and integrity of urinary cell‐free DNA. J Clin Lab Anal. 2019;33:e22668 10.1002/jcla.22668
Li and Ning contributed equally to this work.
Contributor Information
Long Wang, Email: doctorwanglong@163.com.
Yu Wang, Email: wangyu@upsbio.com.
REFERENCES
- 1. Wan JCM, Massie C, Garcia‐Corbacho J, et al. Liquid biopsies come of age: towards implementation of circulating tumour DNA. Nat Rev Cancer. 2017;17(4):223‐238. [DOI] [PubMed] [Google Scholar]
- 2. Ward DG, Bryan RT. Liquid biopsies for bladder cancer. Transl Androl Urol. 2017;6(2):331‐335. [DOI] [PMC free article] [PubMed] [Google Scholar]
- 3. Togneri FS, Ward DG, Foster JM, et al. Genomic complexity of urothelial bladder cancer revealed in urinary cfDNA. Eur J Hum Genet. 2016;24(8):1167‐1174. [DOI] [PMC free article] [PubMed] [Google Scholar]
- 4. Zancan M, Galdi F, Di Tonno F, et al. Evaluation of cell‐free DNA in urine as a marker for bladder cancer diagnosis. Int J Biol Markers. 2009;24(3):147‐155. [DOI] [PubMed] [Google Scholar]
- 5. Brisuda A, Pazourkova E, Soukup V, et al. Urinary cell‐free DNA quantification as non‐invasive biomarker in patients with bladder cancer. Urol Int. 2016;96(1):25‐31. [DOI] [PubMed] [Google Scholar]
- 6. Casadio V, Calistri D, Tebaldi M, et al. Urine cell‐free DNA integrity as a marker for early bladder cancer diagnosis: preliminary data. Urol Oncol. 2013;31(8):1744‐1750. [DOI] [PubMed] [Google Scholar]
- 7. De Almeida EF, Abdalla TE, Arrym TP, et al. Plasma and urine DNA levels are related to microscopic hematuria in patients with bladder urothelial carcinoma. Clin Biochem. 2016;49(16–17):1274‐1277. [DOI] [PubMed] [Google Scholar]
- 8. Chang HW, Tsui KH, Shen LC, et al. Urinary cell‐free DNA as a potential tumor marker for bladder cancer. Int J Biol Markers. 2007;22(4):287‐294. [DOI] [PubMed] [Google Scholar]
- 9. Bryzgunova OE, Laktionov PP. Extracellular nucleic acids in urine: sources, structure, diagnostic potential. Acta Naturae. 2015;7(3):48‐54. [PMC free article] [PubMed] [Google Scholar]
- 10. Lin SY, Linehan JA, Wilson TG, et al. Emerging utility of urinary cell‐free nucleic acid biomarkers for prostate, bladder, and renal cancers. Eur Urol Focus. 2017;3(2–3):265‐272. [DOI] [PubMed] [Google Scholar]
- 11. Russo IJ, Ju Y, Gordon NS, et al. Toward personalised liquid biopsies for urothelial carcinoma: characterisation of ddPCR and urinary cfDNA for the detection of the TERT 228 G>A/T mutation. Bladder Cancer. 2018;4(1):41‐48. [DOI] [PMC free article] [PubMed] [Google Scholar]
- 12. Wang Z, Bi SS, Wang L. Re: Validation of a DNA Methylation‐Mutation Urine Assay to Select Patients with Hematuria for Cystoscopy: K. E. M. van Kessel, W. Beukers, I. Lurkin, A. Ziel‐van der Made, K. A. van der Keur, J. L. Boormans, L. Dyrskjot, M. Marquez, T. F. Orntoft, F. X. Real, U. Segersten, N. Malats, P.‐U. Malmstrom, W. Van Criekinge and E. C. Zwarthoff J Urol 2017;197:590‐595. J Urol. 2017;197(6):1573. [DOI] [PubMed] [Google Scholar]
- 13. Christensen E, Birkenkamp‐Demtroder K, Nordentoft I, et al. Liquid biopsy analysis of FGFR3 and PIK3CA hotspot mutations for disease surveillance in bladder cancer. Eur Urol. 2017;71(6):961‐969. [DOI] [PubMed] [Google Scholar]
- 14. Szarvas T, Kovalszky I, Bedi K, et al. Deletion analysis of tumor and urinary DNA to detect bladder cancer: urine supernatant versus urine sediment. Oncol Rep. 2007;18(2):405‐409. [PubMed] [Google Scholar]
- 15. Lin SY, Dhillon V, Jain S, et al. A locked nucleic acid clamp‐mediated PCR assay for detection of a p53 codon 249 hotspot mutation in urine. J Mol Diagn. 2011;13(5):474‐484. [DOI] [PMC free article] [PubMed] [Google Scholar]
- 16. Chen S, Zhao J, Cui L, et al. Urinary circulating DNA detection for dynamic tracking of EGFR mutations for NSCLC patients treated with EGFR‐TKIs. Clin Transl Oncol. 2017;19(3):332‐340. [DOI] [PubMed] [Google Scholar]
- 17. Su YH, Wang M, Brenner DE, et al. Detection of mutated K‐ras DNA in urine, plasma, and serum of patients with colorectal carcinoma or adenomatous polyps. Ann N Y Acad Sci. 2008;1137:197‐206. [DOI] [PMC free article] [PubMed] [Google Scholar]
- 18. Su YH, Song J, Wang ZL, et al. Removal of high‐molecular‐weight DNA by carboxylated magnetic beads enhances the detection of mutated K‐ras DNA in urine. Ann N Y Acad Sci. 2008;1137:82‐91. [DOI] [PMC free article] [PubMed] [Google Scholar]
- 19. Song BP, Jain S, Lin SY, et al. Detection of hypermethylated vimentin in urine of patients with colorectal cancer. J Mol Diagn. 2012;14(2):112‐119. [DOI] [PMC free article] [PubMed] [Google Scholar]
- 20. Liu Z, Liu W. Association of urinary and plasma DNA in early breast cancer patients and its links to disease relapse. Clin Transl Oncol. 2018;20:1053‐1060. [DOI] [PubMed] [Google Scholar]
- 21. Botezatu I, Serdyuk O, Potapova G, et al. Genetic analysis of DNA excreted in urine: a new approach for detecting specific genomic DNA sequences from cells dying in an organism. Clin Chem. 2000;46(8 Pt 1):1078‐1084. [PubMed] [Google Scholar]
- 22. Moreira VG, Garcia BP, Martin JMB, et al. Cell‐free DNA as a noninvasive acute rejection marker in renal transplantation. Clin Chem. 2009;55(11):1958‐1966. [DOI] [PubMed] [Google Scholar]
- 23. Garcia Moreira V, Prieto Garcia B, De La Cera Martinez T, et al. Elevated transrenal DNA (cell‐free urine DNA) in patients with urinary tract infection compared to healthy controls. Clin Biochem. 2009;42(7–8):729‐731. [DOI] [PubMed] [Google Scholar]
- 24. Cheng THT, Jiang P, Tam JCW, et al. Genomewide bisulfite sequencing reveals the origin and time‐dependent fragmentation of urinary cfDNA. Clin Biochem. 2017;50(9):496‐501. [DOI] [PubMed] [Google Scholar]
- 25. Tsui NB, Jiang P, Chow KC, et al. High resolution size analysis of fetal DNA in the urine of pregnant women by paired‐end massively parallel sequencing. PLoS ONE. 2012;7(10):e48319. [DOI] [PMC free article] [PubMed] [Google Scholar]
- 26. Su YH, Wang M, Brenner DE, et al. Human urine contains small, 150 to 250 nucleotide‐sized, soluble DNA derived from the circulation and may be useful in the detection of colorectal cancer. J Mol Diagn. 2004;6(2):101‐107. [DOI] [PMC free article] [PubMed] [Google Scholar]
- 27. Wang X, Meng Q, Wang C, et al. Investigation of transrenal KRAS mutation in late stage NSCLC patients correlates to disease progression. Biomarkers. 2017;22(7):654‐660. [DOI] [PubMed] [Google Scholar]
- 28. Shan Z, Zhou ZW, Chen H, et al. PCR‐ready human DNA extraction from urine samples using magnetic nanoparticles. J Chromatogr B Analyt Technol Biomed Life Sci. 2012;881‐882:63‐68. [DOI] [PubMed] [Google Scholar]
- 29. Takano S, Hu QJ, Amamoto T, et al. Extraction of cell‐free DNA from urine, using polylysine‐coated silica particles. Anal Bioanal Chem. 2017;409(16):4021‐4025. [DOI] [PubMed] [Google Scholar]
- 30. Fujii T, Barzi A, Sartore‐Bianchi A, et al. Mutation‐enrichment next‐generation sequencing for quantitative detection of KRAS mutations in urine cell‐free DNA from patients with advanced cancers. Clin Cancer Res. 2017;23(14):3657‐3666. [DOI] [PMC free article] [PubMed] [Google Scholar]
- 31. Kim YH, Yan C, Lee IS, et al. Value of urinary topoisomerase‐IIA cell‐free DNA for diagnosis of bladder cancer. Investig Clin Urol. 2016;57(2):106‐112. [DOI] [PMC free article] [PubMed] [Google Scholar]
- 32. Bryzgunova OE, Skvortsova TE, Kolesnikova EV, et al. Isolation and comparative study of cell‐free nucleic acids from human urine. Ann N Y Acad Sci. 2006;1075:334‐340. [DOI] [PubMed] [Google Scholar]
- 33. Lu T, Li J. Clinical applications of urinary cell‐free DNA in cancer: current insights and promising future. Am J Cancer Res. 2017;7(11):2318‐2332. [PMC free article] [PubMed] [Google Scholar]
- 34. Yao W, Mei C, Nan X, et al. Evaluation and comparison of in vitro degradation kinetics of DNA in serum, urine and saliva: a qualitative study. Gene. 2016;590(1):142‐148. [DOI] [PubMed] [Google Scholar]
- 35. Zhang J, Tong KL, Li PK, et al. Presence of donor‐ and recipient‐derived DNA in cell‐free urine samples of renal transplantation recipients: urinary DNA chimerism. Clin Chem. 1999;45(10):1741‐1746. [PubMed] [Google Scholar]
- 36. Ying L, Zhong XY, Kang AJ, et al. Inability to detect cell free fetal DNA in the urine of normal pregnant women nor in those affected by preeclampsia associated HELLP syndrome. J Soc Gynecol Investig. 2003;10(8):503‐508. [DOI] [PubMed] [Google Scholar]
Associated Data
This section collects any data citations, data availability statements, or supplementary materials included in this article.
Supplementary Materials


