

Background:
The purpose of this study was to explore the role of perinatal vitamin-D intake on the development and characterization of hyperkyphosis in a porcine model.
Methods:
The spines of 16 pigs were assessed at 9, 13, and 17 weeks of age with radiography and at 17 weeks with computed tomography (CT), magnetic resonance imaging (MRI), histology, and bone-density testing. An additional 169 pigs exposed to 1 of 3 maternal dietary vitamin-D levels from conception through the entire lactation period were fed 1 of 4 nursery diets supplying different levels of vitamin D, calcium, and phosphorus. When the animals were 13 weeks of age, upright lateral spinal radiography was performed with use of a custom porcine lift and sagittal Cobb angles were measured in triplicate to determine the degree of kyphosis in each pig.
Results:
The experimental animals had significantly greater kyphotic sagittal Cobb angles at all time points when compared with the control animals. These hyperkyphotic deformities demonstrated no significant differences in Hounsfield units, contained a slightly lower ash content (46.7% ± 1.1% compared with 50.9% ± 1.6%; p < 0.001), and demonstrated more physeal irregularities. Linear mixed model analysis of the measured kyphosis demonstrated that maternal diet had a greater effect on sagittal Cobb angle than did nursery diet and that postnatal supplementation did not completely eliminate the risk of hyperkyphosis.
Conclusions:
Maternal diets deficient in vitamin D increased the development of hyperkyphosis in offspring in this model.
Clinical Relevance:
This study demonstrates that decreased maternal dietary vitamin-D intake during pregnancy increases the risk of spinal deformity in offspring. In addition, these data show the feasibility of generating a large-animal spinal-deformity model through dietary manipulation alone.
Genetic1-7, biomechanical8-10, and environmental11-13 factors have been implicated in the pathogenesis of spinal deformities. Low maternal folate is perhaps the most well-known environmental factor found to be linked to spinal deformities in offspring14,15. The roles of bone density and vitamin D in the pathogenesis and progression of spinal deformities have been the focus of many studies16-23. While the results of earlier studies were conflicting24-29, more recent work has demonstrated that low vitamin D11,12, differences in vitamin-D receptors30,31, and lower bone densities16-18,21-23,32 are associated with spinal deformity and curve progression.
Recently, a hyperkyphotic porcine model was discovered through dietary manipulation alone33. Pigs that were born to mothers fed a low vitamin-D diet and that were fed a deficient nursery diet developed a visually apparent kyphotic deformity (Fig. 1). The purpose of the current study was to follow up on these previous findings by characterizing the spinal deformity using medical imaging modalities in a new cohort of animals and confirming whether deficient prenatal (maternal) or postnatal (nursery) diets had a greater effect on the development of kyphosis.
Fig. 1.
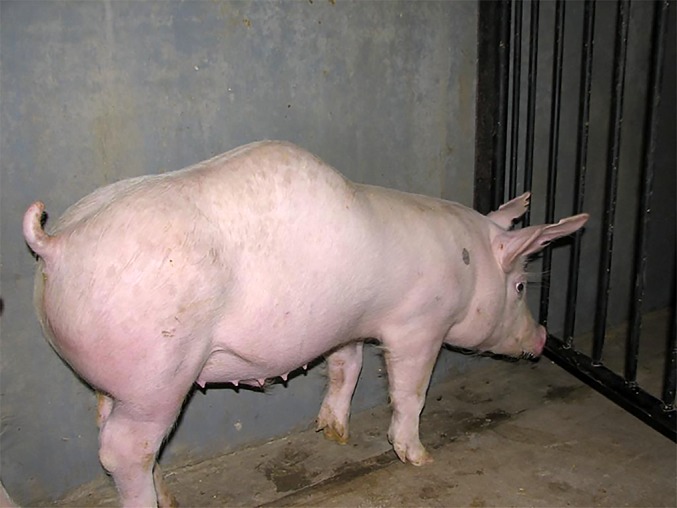
Photograph of a dramatic example of the clinically apparent kyphotic deformity produced in a prior study via dietary manipulation alone at our institution. Of note, the porcine thoracic spine is typically less kyphotic than the human spine is.
Materials and Methods
Study Animals and Diets
The project was approved by our College of Agricultural and Life Sciences Animal Care and Use Committee. This study was performed at the University of Wisconsin Swine Research and Teaching Center, which is an environmentally regulated and completely enclosed facility; this facility allows no exposure of the animals to ultraviolet B (UVB) rays in the range of 280 to 315 nanometers from either natural or supplemental lighting, which prevents vitamin-D synthesis from ultraviolet exposure. Sows used in this study were crossbred (one-half Large White and one-half Landrace), and they were bred with a Line-19 boar; this resulted in crossbred pigs (one-half Line 19, one-quarter Large White, and one-quarter Landrace). Such pigs typically reach puberty at 6 to 7 months of age and skeletal maturity (closure of the physis) between 1 to 4 years of age, depending on the bone assessed34.
Sows were fed 1 of 3 maternal vitamin-D diet levels (0, 325, or 1,750-IU D3/kg) from breeding through the entire lactation period (23 to 25 days). Pigs were then fed 1 of 4 nursery diets supplemented with different levels of vitamin D (0 or 280-IU D3/kg) and high or low calcium and phosphorus levels. Calcium and phosphorus concentrations were achieved by altering the additions of monocalcium phosphate and limestone ingredients to the diets. These diets were labeled Sow Diets 1, 2, and 3 and Nursery Diets 1, 2, 3, and 4, respectively (Table I). From 7 to 17 weeks of age, all pigs were fed standard Swine Research and Training Center diets with supplemental vitamin D (280-IU D3/kg). Of note, littermates of the pigs in the current study were randomly selected and removed from these cohorts for tissue analysis, the results of which are described in a separate manuscript35.
TABLE I.
Overview of the 3 Sow Diets and 4 Nursery Diets Used in This Study
| Vitamin D (IU D3/kg) | Calcium* | Phosphorus* | |
| Sow Diet 1 | 0 | 93% | 100% |
| Sow Diet 2 | 325 | 93% | 100% |
| Sow Diet 3 | 1,750 | 93% | 100% |
| Nursery Diet 1 | 0 | 75% | 95% |
| Nursery Diet 2 | 0 | 150% | 120% |
| Nursery Diet 3 | 280 | 75% | 95% |
| Nursery Diet 4 | 280 | 150% | 120% |
Values are given as a percentage of the daily requirement.
Characterization of the Deformity
Sixteen pigs from 9 sows were visually identified as either hyperkyphotic or nonkyphotic at 9 weeks of age. The 9 hyperkyphotic pigs had received deficient diets33 (7 pigs from Sow Diet 1/Nursery Diet 1 and 2 from Sow Diet 1/Nursery Diet 2), and the 7 visually normal pigs had received supplemented diets (3 pigs from Sow Diet 2/Nursery Diet 4, 2 from Sow Diet 3/Nursery Diet 3, and 2 from Sow Diet 3/Nursery Diet 4); all 16 were selected at 9 weeks of age and were assessed longitudinally at 9, 13, and 17 weeks of age with radiography. Standing lateral radiography was performed at 9 and 13 weeks of age. At 17 weeks of age, the pigs were held upright with use of a custom-designed motorized lift because of their large size (Fig. 2). This lift caused the pigs to straddle a bar between their limbs. The bar was elevated to keep the pigs’ hooves off the ground, facilitating radiography without sedation. For the purpose of this study, images acquired using the lift are termed upright, as opposed to standing. The largest kyphotic sagittal Cobb angle through the thoracolumbar spine (the visual center of the clinical deformity) was then measured 3 separate times using the images for each animal.
Fig. 2.

Photographs of the custom motorized lift used to hold the pigs in an upright position for radiography. The animal straddled the bar (left image) in the chute while the entire apparatus was elevated to lift the hooves off the ground and maintain the animal’s thorax in a horizontal but upright (quadruped) position (right image).
We hypothesized that a substantial progressive spinal deformity would be present in the hyperkyphotic cohort. Thus, after measuring maximum Cobb angles of the hyperkyphotic and control vertebrae at each of the 3 time points (9, 13, and 17 weeks), a cross-sectional analysis was conducted for each time point separately. For each time point, a linear mixed model was fit. A random-effect term was included for each individual pig to account for the replications. Pig grouping (control or hyperkyphotic) was included as the only fixed effect. For each week, the first estimate was the Cobb angle for the control group. The second estimate was the offset from the control group to the kyphotic group; to get a point estimate for the kyphotic group, the values of the baseline control group and offset were added. Longitudinal analysis was conducted to assess changes in spinal curvature over time. Since the week-17 measurements were conducted with the pigs in a lift, those values were not directly comparable with the week-9 and week-13 measurements. A mixed linear regression model was used excluding the lift measurements. A random-effect term was included for each individual pig to account for the replications. Pig grouping, week number, and the interaction between those 2 variables were included as the fixed effects. A significant interaction term indicated that the Cobb angles changed differently over time for the control and hyperkyphotic pigs.
After radiography at 17 weeks of age, the 16 additional animals were killed and their spinal columns were removed. With the paraspinal musculature and costovertebral joints maintained, each specimen then underwent computed tomography (CT) and magnetic resonance imaging (MRI). From the CT scans (Discovery 750HD; GE Healthcare), maximum Cobb angles in the coronal and sagittal planes throughout the thoracolumbar spine were performed. The average x-ray attenuation in Hounsfield units (HUs) of the apical vertebrae was used to estimate the relative bone density between the hyperkyphotic and control animals36. P values of <0.05 were considered significant. The spines were also scanned using a 3-T MRI scanner (MR750; GE Healthcare). Disc morphology was graded by a single reader according to the validated method described by Pfirrmann et al.37. The disc with the worst (highest) Pfirrmann grade was recorded for each animal.
The central midsagittal plane of the apical segments of 1 hyperkyphotic and 1 control pig was prepared for histology. The tissue was fixed in 10% neutral buffered formalin, decalcified in 22% neutral buffered formic acid, embedded in paraffin, sectioned, stained with hematoxylin and eosin as well as Gomori trichrome, and then read by a board-certified veterinary pathologist.
Bone mineral content was expressed as percent ash. Spinal segments of 4 hyperkyphotic and 4 control animals were used to measure absolute differences in bone mineral content. Apical vertebrae were cleaned of soft tissues, extracted in diethyl ether for 7 days to remove fat, dried at 105°C, and then weighed to determine the dry, fat-free weight. The ash weight of each vertebral body was recorded after overnight combustion in a muffle furnace at 700°C.
Given the method of model production, we hypothesized that the HU value and percent ash would be lower in the spines of kyphotic pigs. A linear model was used to compare the average Cobb angles, HUs, and percent ash as measured with CT scans between the kyphotic and control spines. Again, p values of <0.05 were considered significant.
Influence of Diet on the Deformity
An additional 169 animals (produced from 22 sows) were used to determine the influence of diet on the deformity. When the animals were 13 weeks of age, upright lateral spinal radiographs were obtained of the 169 pigs using the custom motorized porcine lift. Three separate measurements of the sagittal Cobb angles from these images were then used to determine the mean kyphosis for each sample.
From previous work in this model33, we hypothesized that the maternal diet would have greater influence on the subsequent development of hyperkyphosis. To determine the effects of sow and nursery diets on the Cobb angle, a linear mixed effects model was fit. Random-effect terms were included for individual pigs to account for the replications and for sows to account for variability between litters. Sow and nursery diets were included as fixed effects. Multiple comparison tests with Tukey contrasts were then conducted to compare sow diets. As normative data for the sagittal alignment of a pig’s spine do not exist, to our knowledge, we attempted to define normal and hyperkyphosis in our model in the hope of making these findings more clinically relevant. Normal spines were defined as those with sagittal Cobb angles within 2 standard deviations of the mean kyphosis of the maximally supplemented treatment group (animals that received Sow Diet 3/Nursery Diet 4), whereas hyperkyphotic spines had mean sagittal Cobb angles >2 standard deviations greater than the mean kyphosis of the supplemented group.
Results
Characterization of the Deformity
The hyperkyphotic cohort consisted of 9 pigs (5 males and 4 females) and 7 controls (3 males and 4 females). Significant differences in sagittal Cobb angles were found between the control and hyperkyphotic pigs at all 3 time points (Fig. 3 and Table II). Longitudinally, the control pigs started with a smaller Cobb angle in week 9, and the angle decreased by week 13. Hyperkyphotic pigs started with a much larger Cobb angle in week 9, and the angle increased by week 13. The confidence interval (CI) for the interaction term did not include 0; the slopes of the lines were significantly different (Fig. 4). The mean sagittal Cobb angles (and standard deviations) for the control and hyperkyphotic pigs were 23.4° ± 12.1° and 50.3° ± 7.2° at 9 weeks, 13.4° ± 9.3° and 60.6° ± 11.2° at 13 weeks, and 18.8° ± 6.1° and 36.9° ± 14.4° at 17 weeks, respectively.
Fig. 3.
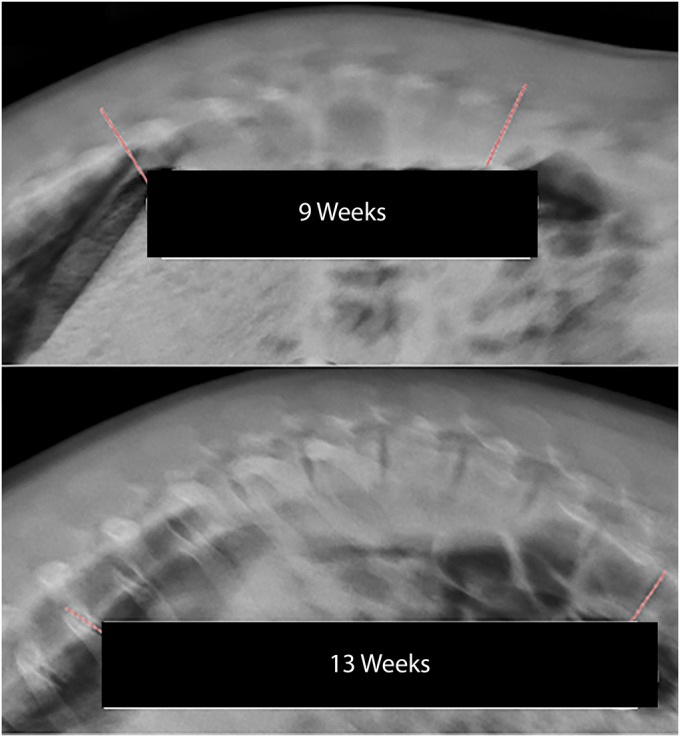
Standing radiographs of a hyperkyphotic pig at 9 and 13 weeks of age.
Fig. 4.

Predictions for control and kyphotic pigs over time. Control pigs maintained lower Cobb angles, while kyphotic pigs’ measurements increased. The pale dashed (teal and orange) shadowed lines represent the observed measurements, while the solid (teal and orange) lines represent the predicted curves over time.
TABLE II.
Linear Mixed Model Results for Mean Sagittal Cobb Angles Between Cohorts*
| Estimated Cobb Angle (95% CI) | |
| Week 9 | |
| Hyperkyphotic (n = 9) | 50.3° |
| Control (n = 7) | 23.4° (16.9° to 30.8°) |
| Difference† | 26.9° (16.9° to 35.7°) |
| Week 13 | |
| Hyperkyphotic (n = 9) | 60.6° |
| Control (n = 7) | 13.4° (5.7° to 21.0°) |
| Difference† | 47.2° (37.3° to 58.3°) |
| Week 17 | |
| Hyperkyphotic (n = 9) | 36.9° |
| Control (n = 7) | 18.8° (10.6° to 26.8°) |
| Difference† | 18.1° (6.2° to 31.0°) |
The results of 3 linear mixed models are included in the table. The values are based on radiographic measurements and are given as the mean, with or without the 95% CI in parentheses. For weeks 9, 13, and 17, the estimated Cobb angle from the modeling is provided for the hyperkyphotic cohort, the control group, and the difference between them (the offset from the control group to the hyperkyphotic cohort).
None of the 95% CIs for the offsets include 0, which indicates that there was a difference in Cobb angles between groups for all 3 weeks.
No significant coronal-plane deformity was found in either cohort; however, differences in kyphosis were readily apparent (Fig. 5). Apical vertebral HUs were similar between hyperkyphotic spines (mean, 377.4; 95% CI, 350.2 to 404.6) and control spines (mean, 380.9; 95% CI, 350.0 to 411.7) (p = 0.86; Table III). Disc morphology was similar between the cohorts. All discs except 1 in each cohort were given a Pfirrmann grade of 2; those 2 other discs were graded as 3.
Fig. 5.
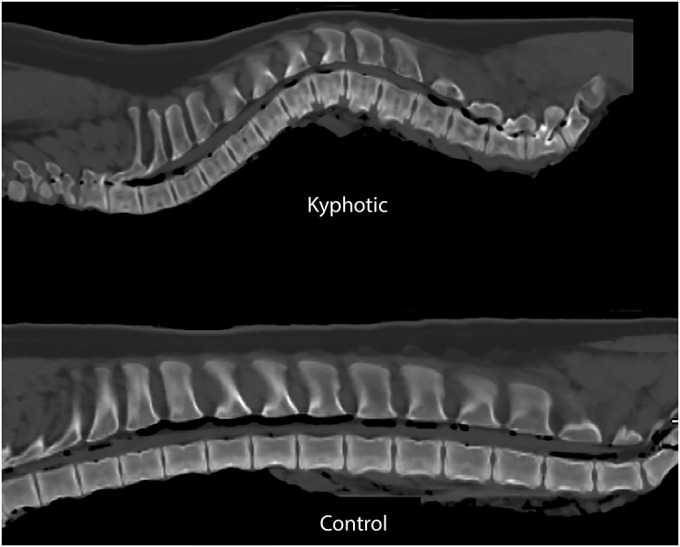
Midsagittal CT scans of the explanted control and kyphotic spines. The vertebral body fracture in the control spine was a result of the process used during euthanasia. Spines were positioned supine during this imaging.
TABLE III.
Differences Between Control and Hyperkyphotic Pigs in Coronal Cobb Angle, Sagittal Cobb Angle, Apical Hounsfield Units, and Percent Ash
| Measurement | Control (N = 7)* | Hyperkyphotic (N = 9)* | Difference* | P Value |
| CT | ||||
| Coronal Cobb angle | 6.3° (2.8° to 9.8°) | 4.6° (1.5° to 7.6°) | −1.7° (−6.4° to 2.9°) | 0.44 |
| Sagittal Cobb angle | 17.5° (10.1° to 24.8°) | 37.8° (31.4° to 44.3°) | 20.4° (10.6° to 30.1°) | 0.001 |
| Hounsfield units at apex | 380.9 (350.0 to 411.7) | 377.4 (350.2 to 404.6) | −3.5 (−44.6 to 37.7) | 0.86 |
| Ash† | 50.9% (50.2% to 51.7%) | 46.7% (46.0% to 47.5%) | −4.2% (−5.2% to −3.2%) | <0.001 |
The values are given as the mean, with the 95% CI in parentheses.
Percent ash was calculated from the spines of 4 hyperkyphotic and 4 control animals.
Gross evaluation of apical sagittal cross-sectional samples revealed that the anterior epiphysis in the kyphotic spine appeared less ossified than in the control spines, corresponding with the radiolucent areas observed on imaging (Figs. 6, 7, and 8). Histologic comparison of the samples demonstrated that growth plates in the kyphotic spine were more irregular, with apparent pleating, less organized columns of chondrocyte nuclei, and more hypertrophic chondrocyte nuclei. Neither animal showed any fibrous osteodystrophy. Despite no differences in the HUs of the apical vertebrae, ash content was lower in the kyphotic samples (50.9% ± 1.6% compared with 46.7% ± 1.1%; Table III).
Fig. 6.

Midsagittal histologic evaluation of the apical and matched vertebrae of the control and kyphotic spines (magnification, ×1). In these slides, anterior is to the right, posterior is to the left, proximal is at the top, distal is at the bottom, and the vertebral disc is in the middle. Note that the anterior epiphysis of the kyphotic spine is less ossified and the cartilage is confluent with the physis compared with the control spines. H & E = hematoxylin and eosin.
Fig. 7.

Trichrome-stained images centered on the anterior epiphysis of the control (Fig. 7-A) and the kyphotic (Fig. 7-B) vertebrae (magnification, ×2). In these images, the metaphyseal bone is at the bottom, the disc space is at the top, the epiphyseal (secondary) ossification center is at the left, and the fibers from the anulus are in the upper right. Note the relatively increased area of unossified cartilage of the anterior epiphysis in the kyphotic sample (Fig. 7-B). um = micrometer.
Fig. 8.

Trichrome-stained histologic sections of the control (Figs. 8-A and 8-C) and kyphotic (Figs. 8-B and 8-D) vertebrae. The secondary center of ossification is at the top and the metaphyseal bone is at the bottom in these examples. Increased pleating of the physis in the kyphotic sample (Fig. 8-B; magnification, ×2) is clearly demonstrated when compared with the control (Fig. 8-A; magnification, ×2). Similarly, the regular columnar organization of the physeal chondrocytes (Fig. 8-C; magnification, ×10) becomes less organized in the kyphotic spine (Fig. 8-D; magnification, ×10).
Influence of Diet on the Deformity
Seventy-eight females and 91 males comprised the 169 pigs used to determine the influence of diet on the deformity. Perinatal diets deficient in vitamin D were found to produce offspring with increased spinal kyphosis (Table IV). While the nursery diet had some effect on mean kyphosis, maternal diet had a stronger influence. The effect of Sow Diet 1 was found to be significantly different from that of Sow Diet 3, but no difference was found for pigs receiving Sow Diet 2 in comparison with pigs in the control group. The estimated difference in measurements between pigs receiving Nursery Diet 1 and pigs in the control group was significant (Table V). The estimated difference in measurements between pigs receiving Sow Diets 1 and 2 was −9.466°, which was significant (p = 0.0013; 95% CI, −12.994° to −5.938°).
TABLE IV.
Mean Cobb Angles and Sample Sizes for Each Combination of Nursery and Sow Diets
| Nursery Diet 1 | Nursery Diet 2 | Nursery Diet 3 | Nursery Diet 4 | Total | |
| Cobb angle | |||||
| Sow Diet 1 | 43.9° | 39.6° | 34.2° | 33.2° | 37.7° |
| Sow Diet 2 | 27.4° | 29.2° | 29.6° | 26.7° | 28.2° |
| Sow Diet 3 | 24.0° | 22.7° | 22.6° | 23.8° | 23.3° |
| Mean | 31.0° | 29.6° | 28.0° | 27.4° | 29.0° |
| Sample size | |||||
| Sow Diet 1* | 13 | 12 | 12 | 13 | 50 |
| Sow Diet 2* | 14 | 9 | 12 | 14 | 49 |
| Sow Diet 3* | 17 | 17 | 17 | 18 | 69 |
| Total | 44 | 38 | 41 | 45 | 168 |
The values are given as the number of non-missing samples per treatment group, which is not necessarily the number of pigs (for example, Cobb-angle data are missing for one pig that received Sow Diet 1/Nursery Diet 4).
TABLE V.
Linear Mixed Model Output*
| Model Coefficients | Estimate |
| Control | 21.5° (17.6° to 25.9°) |
| Sow Diet 1 | 14.1° (8.4° to 19.3°) |
| Sow Diet 2 | 4.6° (−0.1° to 10.3°) |
| Nursery Diet 1 | 4.1° (0.4° to 7.6°) |
| Nursery Diet 2 | 2.6° (−1.1° to 6.0°) |
| Nursery Diet 3 | 0.5° (−3.5° to 3.9°) |
The model output includes the estimates for each coefficient, with the 95% bootstrap CI for that estimate in parentheses. The first coefficient (“Control”) represents the expected Cobb angle of a pig receiving Sow Diet 3/Nursery Diet 4 (the control group). The remaining 5 coefficients estimate the differences between the other groups and the control. A significant difference is indicated by a 95% CI that does not contain 0. Sow Diet 1 was found to be significantly different from Sow Diet 3, but no difference was found between Sow Diet 2 and the control. Nursery Diet 1 was significantly different from the control. However, no differences were found between Nursery Diet 4 and Nursery Diets 2 and 3.
The mean Cobb angle (and standard deviation) for the maximally supplemented cohort (animals receiving Sow Diet 3/Nursery Diet 4) was 23.82° ± 6.28°. Thus, Cobb angles of >36.37° (mean + 2 standard deviations) were hyperkyphotic. A visual representation of the sagittal Cobb angles and the cutoffs used for defining kyphosis is shown in Figure 9. The percentages of hyperkyphotic pigs in each dietary cohort are shown in Table VI. Of note, 77% (10) of the 13 offspring with the most deficient (maternal and nursery) diet demonstrated kyphosis, whereas only 6% (1) of the 17 offspring born to sows fed a supplemented diet, regardless of the nursery diet, developed kyphosis.
Fig. 9.

Graphical representation of the Cobb angles measured in this study. Values outside of the dashed lines indicate angles that are 2 standard deviations from the mean sagittal Cobb angle of the most supplemented diet. For the purposes of this study, we labeled values greater than the normal range as kyphotic.
TABLE VI.
Percent of Hyperkyphotic Pigs for Each Treatment Group*
| Nursery Diet 1 | Nursery Diet 2 | Nursery Diet 3 | Nursery Diet 4 | |
| Sow Diet 1 | 76.9 | 66.7 | 41.7 | 35.7 |
| Sow Diet 2 | 14.3 | 11.1 | 16.7 | 21.4 |
| Sow Diet 3 | 5.9 | 0 | 0 | 0 |
No hyperkyphosis was found in pigs fed Sow Diet 3 and Nursery Diets 2, 3, or 4.
Discussion
The findings of this study are important because they quantitatively confirm the qualitative (visual) results previously reported33. Through objective radiographic measurements, our data confirm that decreased maternal dietary vitamin-D intake increases the risk of spinal deformity in offspring in the porcine model. In contrast to the previous study, the current study evaluated 3 different sow diets (as opposed to 2), used a more deficient maternal vitamin-D diet (0 compared with 40-IU D3/kg), used a larger sample size, and switched pigs to the normal standard herd diet after 7 weeks of age. These small differences in methodology and, more importantly, the use of more sensitive (radiographic) curve assessment led to a much higher prevalence of kyphosis in the deficient group in the current study (77%) than in the previous study (32%).
A review of the current literature reveals that large-animal spinal-deformity models either employ an inverse approach38-48, whereby the effectiveness of a fusionless technique is determined by its ability to create a deformity, or use a 2-step approach49-55, in which a deformity is surgically created and then surgically corrected. None of the models currently in use have a natively deformed spine on which to study various treatment options56. Since these current models require an index surgical intervention to initiate a deformity, the animals must undergo an initial surgical procedure, recover from that procedure, and be housed in a biomedical facility while the animal grows and the deformity is realized. Only then can these models be used for education or investigation. Thus, routine use of the current models is limited because they are both cost and labor intensive. As the deformity produced in this manuscript occurred through dietary manipulation, many of these issues are resolved.
While the exact etiology of Scheuermann disease remains unknown, previous studies have suggested genetic1,2,4,57 and environmental58-61 causes. The best genetic evidence for pathogenesis relies on twin studies; however, our findings add a confounding variable to these studies, as both twins would be exposed to the same maternal dietary influences, making separation of genetic from environmental causes more difficult. As the animals in this study were quadrupeds, the mechanical influence of gravity was lessened. This could explain the absence of Schmorl nodes and could also account for the slightly lower overall kyphotic angle compared with the classic kyphosis criteria of Sørensen61. The lack of Schmorl nodes in the porcine model may also be explained by the presence of an intact and ossified secondary center of ossification extending across the entire vertebral end plate in the pig, which is not found in human vertebral end plates. This additional ossified layer in the pig may protect against the intravertebral disc herniations (Schmorl nodes) that are observed in humans with Scheuermann disease. Furthermore, the lack of a completely ossified epiphysis in the human spine calls into question the clinical importance of the decreased anterior ossification observed in the hyperkyphotic vertebral epiphysis. While this finding and other histologic differences were found between the control and hyperkyphotic pigs, further work is necessary to understand whether similar processes occur in humans with this condition. The validity of our kyphotic model to mimic pathogenesis in humans may be further questioned given that the percent ash (mineral content) of the kyphotic spine was slightly less than that of the control spine while the HUs were similar. Currently, the literature is divided on whether bone density is diminished in Scheuermann disease24-29. However, multiple studies have demonstrated decreased bone density in patients with scoliosis16-19,21-23,32. Similarly, recent studies of vitamin-D deficiency suggest a role for low vitamin-D levels11,12 and abnormal vitamin-D receptors30,31 in the pathogenesis of scoliosis; therefore, we feel that it is reasonable to consider that maternal vitamin-D levels may contribute in the development of kyphosis in humans. Thus, whether the current model accurately models Scheuermann disease may be debated, and future investigations must be conducted to corroborate or refute these findings in humans.
The greatest limitation of this study is the production of the deformity in a quadruped rather than in an upright animal. Validity concerns regarding a quadruped model could be raised, as the effects of gravity on the spine are thought to be an important factor in deformity progression. However, a recent review reported only quadrupeds (pigs, mini-pigs, lambs, and calves56) as commonly accepted large-animal spine models. While the porcine model does have anatomic differences when compared with humans, the porcine thoracolumbar spine has been shown to qualitatively approximate the human spine62. Although no model with these quadrupeds can completely mimic the axial spinal loading caused by gravity on the upright human spine, the rhythmic contractions of the longitudinal paraspinal muscles of such animals appear to exert an axial load as great as or greater than gravity does on the human spine63. Furthermore, another limitation of the current study was the use of our porcine lift for the older, larger pigs in our model-validation experiments. Ideally these pigs would have been imaged in the exact same manner as the younger pigs were or vice versa. Our use of the porcine lift may account for the apparent curve resolution that occurred between 13 and 17 weeks. Use of this lift may have also extended the spine during the radiographic process. Similarly, the portable digital cassette that was used was of insufficient length to accommodate the entire spine, especially in the older, larger pigs. However, the deformed regions were imaged and several images were obtained in an attempt to capture the entire deformity. As the sagittal Cobb angles obtained from the CT scans were very similar to those obtained from lateral radiography in the 17-week-old pigs, we doubt that this limitation affected the outcomes of the study.
In summary, this study demonstrates that maternal vitamin D influences the development of kyphosis in offspring. In addition to serving as a model to study the pathogenesis of kyphotic spinal deformities, this model may provide a useful large animal model spinal-deformity platform on which to study implants and techniques for the correction of spinal deformities.
Footnotes
Investigation performed at the University of Wisconsin-Madison, Madison, Wisconsin
A commentary by Ian A. Stokes, PhD, is linked to the online version of this article at jbjs.org.
Disclosure: This project was funded through a POSNA (Pediatric Orthopaedic Society of North America) Biomet Spine Research Grant, the Hatch Fund, and unrestricted gift funds for swine-nutrition research from Zinpro. The Disclosure of Potential Conflicts of Interest forms are provided with the online version of the article. (http://links.lww.com/JBJS/E627).
References
- 1.Damborg F, Engell V, Andersen M, Kyvik KO, Thomsen K. Prevalence, concordance, and heritability of Scheuermann kyphosis based on a study of twins. J Bone Joint Surg Am. 2006. October;88(10):2133-6. [DOI] [PubMed] [Google Scholar]
- 2.Damborg F, Engell V, Nielsen J, Kyvik KO, Andersen MO, Thomsen K. Genetic epidemiology of Scheuermann’s disease. Acta Orthop. 2011. October;82(5):602-5. [DOI] [PMC free article] [PubMed] [Google Scholar]
- 3.Grauers A, Einarsdottir E, Gerdhem P. Genetics and pathogenesis of idiopathic scoliosis. Scoliosis Spinal Disord. 2016. November 28;11:45. [DOI] [PMC free article] [PubMed] [Google Scholar]
- 4.Halal F, Gledhill RB, Fraser C. Dominant inheritance of Scheuermann’s juvenile kyphosis. Am J Dis Child. 1978. November;132(11):1105-7. [DOI] [PubMed] [Google Scholar]
- 5.Wise CA, Gao X, Shoemaker S, Gordon D, Herring JA. Understanding genetic factors in idiopathic scoliosis, a complex disease of childhood. Curr Genomics. 2008. March;9(1):51-9. [DOI] [PMC free article] [PubMed] [Google Scholar]
- 6.Yau MS, Demissie S, Zhou Y, Anderson DE, Lorbergs AL, Kiel DP, Allaire BT, Yang L, Cupples LA, Travison TG, Bouxsein ML, Karasik D, Samelson EJ. Heritability of thoracic spine curvature and genetic correlations with other spine traits: the Framingham study. J Bone Miner Res. 2016. December;31(12):2077-84. [DOI] [PMC free article] [PubMed] [Google Scholar]
- 7.Yee A, Song YQ, Chan D, Cheung KM. Understanding the basis of genetic studies: adolescent idiopathic scoliosis as an example. Spine Deform. 2014. January;2(1):1-9. [DOI] [PubMed] [Google Scholar]
- 8.Dickson RA. The etiology and pathogenesis of idiopathic scoliosis. Acta Orthop Belg. 1992;58(Suppl 1):21-5. [PubMed] [Google Scholar]
- 9.Millner PA, Dickson RA. Idiopathic scoliosis: biomechanics and biology. Eur Spine J. 1996;5(6):362-73. [DOI] [PubMed] [Google Scholar]
- 10.Palazzo C, Sailhan F, Revel M. Scheuermann’s disease: an update. Joint Bone Spine. 2014. May;81(3):209-14. [DOI] [PubMed] [Google Scholar]
- 11.Balioglu MB, Aydin C, Kargin D, Albayrak A, Atici Y, Tas SK, Kaygusuz MA. Vitamin-D measurement in patients with adolescent idiopathic scoliosis. J Pediatr Orthop B. 2017. January;26(1):48-52. [DOI] [PubMed] [Google Scholar]
- 12.Goździalska A, Jaśkiewicz J, Knapik-Czajka M, Drąg J, Gawlik M, Cieśla M, Kulis A, Zarzycki D, Lipik E. Association of calcium and phosphate balance, vitamin D, PTH, and calcitonin in patients with adolescent idiopathic scoliosis. Spine (Phila Pa 1976). 2016. April;41(8):693-7. [DOI] [PubMed] [Google Scholar]
- 13.Li Z, Shen J, Wu WK, Wang X, Liang J, Qiu G, Liu J. Vitamin A deficiency induces congenital spinal deformities in rats. PLoS One. 2012;7(10):e46565. [DOI] [PMC free article] [PubMed] [Google Scholar]
- 14.Emery AE. Folates and fetal central-nervous-system malformations. Lancet. 1977. March 26;1(8013):703. [DOI] [PubMed] [Google Scholar]
- 15.Seller MJ. An essay on research into the causation and prevention of spina bifida. Z Kinderchir. 1981. December;34(4):306-14. [DOI] [PubMed] [Google Scholar]
- 16.Cheng JC, Guo X. Osteopenia in adolescent idiopathic scoliosis. A primary problem or secondary to the spinal deformity? Spine (Phila Pa 1976). 1997. August 1;22(15):1716-21. [DOI] [PubMed] [Google Scholar]
- 17.Cheng JC, Guo X, Sher AH. Persistent osteopenia in adolescent idiopathic scoliosis. A longitudinal follow up study. Spine (Phila Pa 1976). 1999. June 15;24(12):1218-22. [DOI] [PubMed] [Google Scholar]
- 18.Cook SD, Harding AF, Morgan EL, Nicholson RJ, Thomas KA, Whitecloud TS, Ratner ES. Trabecular bone mineral density in idiopathic scoliosis. J Pediatr Orthop. 1987. Mar-Apr;7(2):168-74. [DOI] [PubMed] [Google Scholar]
- 19.Hung VW, Qin L, Cheung CS, Lam TP, Ng BK, Tse YK, Guo X, Lee KM, Cheng JC. Osteopenia: a new prognostic factor of curve progression in adolescent idiopathic scoliosis. J Bone Joint Surg Am. 2005. December;87(12):2709-16. [DOI] [PubMed] [Google Scholar]
- 20.Thomas KA, Cook SD, Skalley TC, Renshaw SV, Makuch RS, Gross M, Whitecloud TS, 3rd, Bennett JT. Lumbar spine and femoral neck bone mineral density in idiopathic scoliosis: a follow-up study. J Pediatr Orthop. 1992. Mar-Apr;12(2):235-40. [DOI] [PubMed] [Google Scholar]
- 21.Yip BH, Yu FW, Wang Z, Hung VW, Lam TP, Ng BK, Zhu F, Cheng JC. Prognostic value of bone mineral density on curve progression: a longitudinal cohort study of 513 girls with adolescent idiopathic scoliosis. Sci Rep. 2016. December 19;6:39220. [DOI] [PMC free article] [PubMed] [Google Scholar]
- 22.Yu WS, Chan KY, Yu FW, Ng BK, Lee KM, Qin L, Lam TP, Cheng JC. Bone structural and mechanical indices in adolescent idiopathic scoliosis evaluated by high-resolution peripheral quantitative computed tomography (HR-pQCT). Bone. 2014. April;61:109-15. [DOI] [PubMed] [Google Scholar]
- 23.Yu WS, Chan KY, Yu FW, Yeung HY, Ng BK, Lee KM, Lam TP, Cheng JC. Abnormal bone quality versus low bone mineral density in adolescent idiopathic scoliosis: a case-control study with in vivo high-resolution peripheral quantitative computed tomography. Spine J. 2013. November;13(11):1493-9. [DOI] [PubMed] [Google Scholar]
- 24.Armbrecht G, Felsenberg D, Ganswindt M, Lunt M, Kaptoge SK, Abendroth K, Aroso A, Banzer D, Bhalla AK, Dequeker J, Eastell R, Hoszowski K, Lyritis G, Delmas PD, Masaryk P, Miazgowski T, Cannata J, Nuti R, Oei L, Poor G, Redlund-Johnell I, Reid DM, Reisinger W, Schatz H, Todd CJ, Woolf AD, Javaid K, Rivadeneira F, Silman AJ, Cooper C, O’Neill TW, Reeve J; European Vertebral Osteoporosis Study and European Prospective Osteoporosis Study Groups. Vertebral Scheuermann’s disease in Europe: prevalence, geographic variation and radiological correlates in men and women aged 50 and over. Osteoporos Int. 2015. October;26(10):2509-19. [DOI] [PubMed] [Google Scholar]
- 25.Ashton LA, Stephen J, Nabavi-Tabrizi A, Bleasel J, Briody J. Osteoporosis: a possible aetiological factor in the development of Scheuermann’s disease. J Orthop Surg (Hong Kong). 2001. June;9(1):15-7. [DOI] [PubMed] [Google Scholar]
- 26.Bradford DS, Brown DM, Moe JH, Winter RB, Jowsey J. Scheuermann’s kyphosis: a form of osteoporosis? Clin Orthop Relat Res. 1976. Jul-Aug;118:10-5. [PubMed] [Google Scholar]
- 27.Gilsanz V, Gibbens DT, Carlson M, King J. Vertebral bone density in Scheuermann disease. J Bone Joint Surg Am. 1989. July;71(6):894-7. [PubMed] [Google Scholar]
- 28.Lopez RA, Burke SW, Levine DB, Schneider R. Osteoporosis in Scheuermann’s disease. Spine (Phila Pa 1976). 1988. October;13(10):1099-103. [DOI] [PubMed] [Google Scholar]
- 29.Viola S, Péter F, György I, Szécsényi N L. [Alkaline phosphatase level and bone density in Scheuermann’s disease and in adolescent idiopathic scoliosis]. Orv Hetil. 2000. April 23;141(17):905-9. Hungarian. [PubMed] [Google Scholar]
- 30.Colombini A, Brayda-Bruno M, Lombardi G, Croiset SJ, Ceriani C, Buligan C, Barbina M, Banfi G, Cauci S. BsmI, ApaI and TaqI polymorphisms in the vitamin D receptor gene (VDR) and association with lumbar spine pathologies: an Italian case-control study. PLoS One. 2016. May 5;11(5):e0155004. [DOI] [PMC free article] [PubMed] [Google Scholar]
- 31.Wang Y, Cui ZQ, Luo TB, Liu L. Correlations of VDR and VDBP genetic polymorphisms with susceptibility to adolescent idiopathic scoliosis and efficacy of brace treatment. Genomics. 2016. December;108(5-6):194-200. [DOI] [PubMed] [Google Scholar]
- 32.Li XF, Li H, Liu ZD, Dai LY. Low bone mineral status in adolescent idiopathic scoliosis. Eur Spine J. 2008. November;17(11):1431-40. [DOI] [PMC free article] [PubMed] [Google Scholar]
- 33.Rortvedt LA, Crenshaw TD. Expression of kyphosis in young pigs is induced by a reduction of supplemental vitamin D in maternal diets and vitamin D, Ca, and P concentrations in nursery diets. J Anim Sci. 2012. December;90(13):4905-15. [DOI] [PubMed] [Google Scholar]
- 34.Crenshaw TD, Schneider DK, Carlson CS, Parker JB, Sonderman JP, Ward TL, Wilson ME. Tissue mineral concentrations and osteochondrosis lesions in prolific sows across parities 0 through 7. J Anim Sci. 2013. March;91(3):1255-69. [DOI] [PubMed] [Google Scholar]
- 35.Amundson LAH, Hernandez LL, Crenshaw TD. Serum and tissue 25-OH vitamin D3 concentrations do not predict bone abnormalities and molecular markers of vitamin D metabolism in the hypovitaminosis D kyphotic pig model. Br J Nutr. 2017. July;118(1):30-40. [DOI] [PubMed] [Google Scholar]
- 36.Schreiber JJ, Anderson PA, Rosas HG, Buchholz AL, Au AG. Hounsfield units for assessing bone mineral density and strength: a tool for osteoporosis management. J Bone Joint Surg Am. 2011. June 1;93(11):1057-63. [DOI] [PubMed] [Google Scholar]
- 37.Pfirrmann CW, Metzdorf A, Zanetti M, Hodler J, Boos N. Magnetic resonance classification of lumbar intervertebral disc degeneration. Spine (Phila Pa 1976). 2001. September 1;26(17):1873-8. [DOI] [PubMed] [Google Scholar]
- 38.Zhang H, Sucato DJ. Neurocentral synchondrosis screws to create and correct experimental deformity: a pilot study. Clin Orthop Relat Res. 2011. May;469(5):1383-90. [DOI] [PMC free article] [PubMed] [Google Scholar]
- 39.Caballero A, Barrios C, Burgos J, Hevia E, Correa C. Vertebral growth modulation by hemicircumferential electrocoagulation: an experimental study in pigs. Eur Spine J. 2011. August;20(Suppl 3):367-75. [DOI] [PMC free article] [PubMed] [Google Scholar]
- 40.Driscoll M, Aubin CE, Moreau A, Wakula Y, Sarwark JF, Parent S. Spinal growth modulation using a novel intravertebral epiphyseal device in an immature porcine model. Eur Spine J. 2012. January;21(1):138-44. [DOI] [PMC free article] [PubMed] [Google Scholar]
- 41.Newton PO, Upasani VV, Farnsworth CL, Oka R, Chambers RC, Dwek J, Kim JR, Perry A, Mahar AT. Spinal growth modulation with use of a tether in an immature porcine model. J Bone Joint Surg Am. 2008. December;90(12):2695-706. [DOI] [PubMed] [Google Scholar]
- 42.Zhang H, Sucato DJ. Unilateral pedicle screw epiphysiodesis of the neurocentral synchondrosis. Production of idiopathic-like scoliosis in an immature animal model. J Bone Joint Surg Am. 2008. November;90(11):2460-9. [DOI] [PubMed] [Google Scholar]
- 43.Newton PO, Farnsworth CL, Faro FD, Mahar AT, Odell TR, Mohamad F, Breisch E, Fricka K, Upasani VV, Amiel D. Spinal growth modulation with an anterolateral flexible tether in an immature bovine model: disc health and motion preservation. Spine (Phila Pa 1976). 2008. April 1;33(7):724-33. [DOI] [PubMed] [Google Scholar]
- 44.Newton PO, Farnsworth CL, Upasani VV, Chambers RC, Varley E, Tsutsui S. Effects of intraoperative tensioning of an anterolateral spinal tether on spinal growth modulation in a porcine model. Spine (Phila Pa 1976). 2011. January 15;36(2):109-17. [DOI] [PubMed] [Google Scholar]
- 45.Newton PO, Faro FD, Farnsworth CL, Shapiro GS, Mohamad F, Parent S, Fricka K. Multilevel spinal growth modulation with an anterolateral flexible tether in an immature bovine model. Spine (Phila Pa 1976). 2005. December 1;30(23):2608-13. [DOI] [PubMed] [Google Scholar]
- 46.Wall EJ, Bylski-Austrow DI, Kolata RJ, Crawford AH. Endoscopic mechanical spinal hemiepiphysiodesis modifies spine growth. Spine (Phila Pa 1976). 2005. May 15;30(10):1148-53. [DOI] [PubMed] [Google Scholar]
- 47.Zhang H, Sucato DJ, Nurenberg P, McClung A. Morphometric analysis of neurocentral synchondrosis using magnetic resonance imaging in the normal skeletally immature spine. Spine (Phila Pa 1976). 2010. January 1;35(1):76-82. [DOI] [PubMed] [Google Scholar]
- 48.Nachlas IW, Borden JN. Experimental scoliosis; the role of the epiphysis. Surg Gynecol Obstet. 1950. June;90(6):672-80. [PubMed] [Google Scholar]
- 49.Patel A, Schwab F, Lafage R, Lafage V, Farcy JP. Does removing the spinal tether in a porcine scoliosis model result in persistent deformity? A pilot study. Clin Orthop Relat Res. 2011. May;469(5):1368-74. [DOI] [PMC free article] [PubMed] [Google Scholar]
- 50.Braun JT, Hines JL, Akyuz E, Vallera C, Ogilvie JW. Relative versus absolute modulation of growth in the fusionless treatment of experimental scoliosis. Spine (Phila Pa 1976). 2006. July 15;31(16):1776-82. [DOI] [PubMed] [Google Scholar]
- 51.Braun JT, Hoffman M, Akyuz E, Ogilvie JW, Brodke DS, Bachus KN. Mechanical modulation of vertebral growth in the fusionless treatment of progressive scoliosis in an experimental model. Spine (Phila Pa 1976). 2006. May 20;31(12):1314-20. [DOI] [PubMed] [Google Scholar]
- 52.Braun JT, Ogilvie JW, Akyuz E, Brodke DS, Bachus KN. Creation of an experimental idiopathic-type scoliosis in an immature goat model using a flexible posterior asymmetric tether. Spine (Phila Pa 1976). 2006. June 1;31(13):1410-4. [DOI] [PubMed] [Google Scholar]
- 53.Braun JT, Ogilvie JW, Akyuz E, Brodke DS, Bachus KN, Stefko RM. Experimental scoliosis in an immature goat model: a method that creates idiopathic-type deformity with minimal violation of the spinal elements along the curve. Spine (Phila Pa 1976). 2003. October 1;28(19):2198-203. [DOI] [PubMed] [Google Scholar]
- 54.Patel A, Schwab F, Lafage V, Patel A, Obeidat MM, Farcy JP. Computed tomographic validation of the porcine model for thoracic scoliosis. Spine (Phila Pa 1976). 2010. January 1;35(1):18-25. [DOI] [PubMed] [Google Scholar]
- 55.Zhang YG, Zheng GQ, Zhang XS, Wang Y. Scoliosis model created by pedicle screw tethering in immature goats: the feasibility, reliability, and complications. Spine (Phila Pa 1976). 2009. October 1;34(21):2305-10. [DOI] [PubMed] [Google Scholar]
- 56.Roth AK, Bogie R, Jacobs E, Arts JJ, van Rhijn LW. Large animal models in fusionless scoliosis correction research: a literature review. Spine J. 2013. June;13(6):675-88. [DOI] [PubMed] [Google Scholar]
- 57.McKenzie L, Sillence D. Familial Scheuermann disease: a genetic and linkage study. J Med Genet. 1992. January;29(1):41-5. [DOI] [PMC free article] [PubMed] [Google Scholar]
- 58.Ali RM, Green DW, Patel TC. Scheuermann’s kyphosis. Curr Opin Pediatr. 1999. February;11(1):70-5. [DOI] [PubMed] [Google Scholar]
- 59.Lowe TG. Scheuermann disease. J Bone Joint Surg Am. 1990. July;72(6):940-5. [PubMed] [Google Scholar]
- 60.Scheuermann HW. Kyfosis dorsalis juvenalis. Ugeskr Laeger. 1920;82:385-93. [Google Scholar]
- 61.Sørensen KH. Scheuermann’s juvenile kyphosis: clinical appearances, radiography, aetiology, and prognosis. Copenhagen: Munksgaard; 1964. [Google Scholar]
- 62.Wilke HJ, Geppert J, Kienle A. Biomechanical in vitro evaluation of the complete porcine spine in comparison with data of the human spine. Eur Spine J. 2011. November;20(11):1859-68. [DOI] [PMC free article] [PubMed] [Google Scholar]
- 63.Smit TH. The use of a quadruped as an in vivo model for the study of the spine - biomechanical considerations. Eur Spine J. 2002. April;11(2):137-44. [DOI] [PMC free article] [PubMed] [Google Scholar]