Abstract
Objective
To develop a prediction method for femoral head collapse by using patient‐specific finite element analysis of osteonecrosis of the femoral head (ONFH).
Methods
The retrospective study recruited 40 patients with ARCO stage‐II ONFH (40 pre‐collapse hips). Patients were divided into two groups according to the 1‐year follow‐up outcomes: patient group without femoral head collapse (noncollapse group, n = 20) and patient group with collapse (collapse group, n = 20). CT scans of the hip were performed for all patients once they joined the study. Patient‐specific finite element models were generated based on these original CT images following the same procedures: segmenting the necrotic lesion and viable proximal femur, meshing the computational models, assigning different material properties according to the Hounsfield unit distribution, simulating the stress loading of the slow walking gait, and measuring the distribution of the von Mises stress. Receiver operating characteristic (ROC) curve analysis was used to evaluate the predictive performance of the maximum level of the von Mises stress. The optimal cut‐off value was selected based on the Youden index and the corresponding predictive accuracy was reported as well.
Results
The mean level of the maximum von Mises stress in the collapse group was 2.955 ± 0.539 MPa, whereas the mean stress level in the noncollapse group was 1.923 ± 0.793 MPa (P < 0.01). ROC analysis of the maximum von Mises stress found that the area under the ROC curve was 0.842 (95% CI: 0.717–0.968, P < 0.01). The maximum Youden index was 0.60, which corresponded to two optimal cut‐off values: 2.7801 MPa (sensitivity: 0.70; specificity: 0.90; predictive accuracy: 80.00%; LR+: 7), and 2.7027 MPa (sensitivity: 0.75; specificity: 0.85; predictive accuracy: 77.50%; LR+: 5).
Conclusion
Finite element analysis is a potential method for femoral head collapse prediction among pre‐collapse ONFH patients. The maximum level of the von Mises stress on the weight‐bearing surface of the femoral head could be a good biomechanical marker to classify the collapse risk. The collapse prediction method based on patient‐specific finite element analysis is, thus, suitable to apply to clinical practice, but further testing on a larger dataset is desirable.
Keywords: Osteonecrosis of the femoral head, Femoral head collapse prediction, Finite element analysis, Diagnostic test
Introduction
Osteonecrosis of the femoral head (ONFH) is a notorious orthopaedic disorder that can cause lifelong disability. It mainly affects young to middle‐aged adults. No effective and standard treatment regimens for the disease currently exist. Currently, total hip arthroplasty (THA) is not the first‐choice treatment option, while revision procedures and implant longevity are still tricky problems because life expectancy is increasing and the mean age of patients undergoing primary THA is continuing to decrease1. The treatment goal for patients with pre‐collapse ONFH is to preserve the femoral head2, and these treatment regimens, which are commonly known as hip‐preserving treatments, have long been a hot but controversial research topic. Hip‐preserving treatments can be mainly classified into two types: the conservative treatments and the hip‐preserving procedures. Although various pharmacological treatments have been used for treatment of pre‐collapse conditions, experts still hold different views on the effect of conservative treatments3, 4. As for the hip‐preserving procedures, several different types of surgical procedures have been developed. Among these, some are minimally invasive procedures and others are open surgical procedures, but both good and bad outcomes have been reported3, 5, 6. Nevertheless, experts agree that success in preventing collapse is the key to success in preserving the femoral head.
Undoubtedly, treatment decisions based on collapse risk are critical in clinical practice. For the reason that collapse prevention is the major goal, joint‐preserving procedures should be indicated strictly to patients with an increased collapse risk. In contrast, for almost every patient, it is recommended that weight‐bearing be restricted with two crutches once ONFH is confirmed. Previous papers have reported diverse durations of crutch‐assisted weight‐bearing, including 3 months7, 4 months8 and 6 months9. Deciding which grades of weight‐bearing to choose and how long this weight‐bearing continues also mainly depends on the chance of femoral head collapse.
Treatment decisions for ONFH are usually made based on disease stage and necrotic lesion size. Once a patient is diagnosed with ONFH, a CT scan must be ordered to investigate whether a collapse has occurred. To prevent collapse, joint‐preserving procedures are recommended for almost all patients with pre‐collapse ONFH. However, according to results of previous natural history studies, femoral head collapse did not occur in all pre‐collapse patients. Nam et al. reported that only 59% of hips became collapsed during a follow‐up period of 5–15 years when left untreated10. Kubo reported a collapse rate of 54.0% among 113 asymptomatic hips during a follow‐up period of 2.0–11.8 years11. Zhao reported that only 42.73% of hips progressed to femoral head collapse during 7‐year follow‐up12. This can, thus, raise the question of whether hip‐preserving procedures are still necessary for all patients with a pre‐collapse condition. This can also cause selection bias because collapse risks among the patient participants may not be equally balanced and objectively represented in previous studies. Therefore, results and conclusions of previous published trials should be reconsidered carefully.
Risk estimation of femoral head collapse remains problematic. Although various risk factors have been identified to be closely related to femoral head collapse, most factors are not able to be controlled, and some risk factors do not change throughout the disease progression. For example, the location and size of necrotic lesions are known to be an important risk factor for femoral head collapse. Interestingly, the boundary line separating the necrotic and viable portion is established at the onset of ONFH, shown as the low‐signal band on T1‐weighted MRI. The low‐signal band remains unchanged through the whole process, but the necrotic lesion inside the boundary is believed to go through a series of pathological process, including the ischemic phase, the repairing phase, and the sclerotic phase. The problem with this current collapse prediction method is that the location and size of necrotic lesions do not change; as a result, the chance of collapse will remain the same.
The hypothesis behind most hip‐preserving treatments is that the chance of collapse can be altered, or decreased, if treated appropriately. As reported in recent literature, the chance of femoral head collapse changes with the location, size, and disease stage of the necrotic lesion, and the trigger mechanism of femoral head collapse is stress concentration. In addition, the bone density, which is a visualized reflection of material properties inside the necrotic lesion, changes with disease progression. CT scans of the hips can provide more detailed information about the bone tissue and bone structure than standard X‐rays and MRI, thus providing more information related to diseases of the bone. In the current study, we attempted to develop a collapse prediction method by simulating the location, size, and material properties of a patient‐specific ONFH lesion using the finite element analysis of CT images.
Patients and Methods
This retrospective study was conducted in Wangjing Hospital, China Academy of Chinese Medical Sciences. The study was approved by Wangjing Hospital Ethics Committee (No. WJEC‐KT‐2016‐007‐P002) and written informed consent was obtained from every participant.
Participant Selection
Between January 2014 and December 2016, we recruited 40 pre‐collapse patients with ONFH, and they were divided into either the collapse group (n = 20) or the noncollapse group (n = 20) according to whether femoral head collapse was observed within 1‐year follow up. The diagnosis of ONFH was made based on plain radiographs and MRI according to Zhao and Hu (2012)13. The inclusion criteria for patients consisted of: (i) presence of the ARCO international classification14 stage‐II at the first visit to our hospital; (ii) follow‐up time of at least 1 year; and (iii) presence of a definite sclerotic boundary on the initial CT images obtained in our hospital. The diagnosis of collapse was made based on ARCO stage‐III ONFH criterion. Because the occurrence of femoral head collapse is recognized as stage‐III ONFH, the crescent sign on the X‐ray and subchondral fracture on CT were used to exclude those patients with a post‐collapse (stage‐III) condition. The other exclusion criteria were as follows: (i) post‐traumatic osteonecrosis; (ii) congenital hip disease; (iii) a history of previous surgery on the affected limb; (iv) patients under 18 years of age; and (v) pregnancy.
A CT scan of the hip was performed at patients’ first visit to Wangjing Hospital. Patient‐specific finite element models (FEM) of these participants were generated based on these CT images. All patients received non‐surgical management, including traditional Chinese medicine (TCM) herbal medication (Jianpihuogu Formula)15, 16, 17 for 180 days and restricted weight bearing with two crutches for 1 year. Table 1 shows baseline data for the 40 participants. The mean age was 44.87 ± 13.34 years (19–69 years), and there were 21 men and 19 women. Patients were well‐balanced between groups at baseline with respect to age, sex, and risk factors (P > 0.05).
Table 1.
Baseline characteristics of study participants
| Characteristics | 40 patients (40 hips) |
|---|---|
| Age (years; mean ± SD [range]) | 44.87 ± 13.34 (19–69) |
| Sex (male/female) | 21/19 |
| Risk factors | |
| Corticosteroid use | 17 |
| Alcohol abuse | 15 |
| Idiopathic | 8 |
Finite Element Analysis
The steps of the simulation study were identical to the finite element methods described in our previous paper18. All patient‐specified FEM were generated following the same procedures and the level of maximum von Mises stress of each patient was used for further receiver operating characteristic (ROC) curve analysis. All hips of the patients were scanned by multislice CT (120 kVp, 300 mA, slice thickness: 1.00 mm, GE Medical Systems, USA). The computational study is based on a sophisticated modeling process outlined below.
Outer Shape Segmentation
The CT data of affected hips were used to develop the triangular surface models. CT DICOM images (Fig. 1A) were imported into MIMICS 17.0 (Materialise, Belgium) and the outer shape of the proximal femur and the necrotic lesion were extracted using manual segmentation techniques. A uniform threshold value was used to segment the proximal femur on all images, and any discontinuous edges were semiautomatically filled by the analyst for masking purposes. The subchondral cystic area surrounded by a definite sclerotic boundary was defined as the necrotic lesion so that the segmentation of the necrotic region from unaffected osseous tissue was done according to this sclerotic boundary on each image slice (Fig. 2A).
Figure 1.
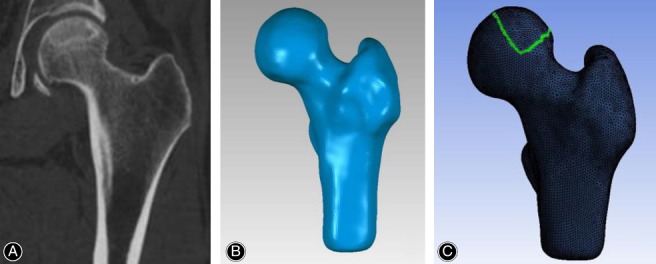
Proximal femur modeling. (A) Coronal CT image. (B) 3D solid model. (C) Finite element mesh.
Figure 2.
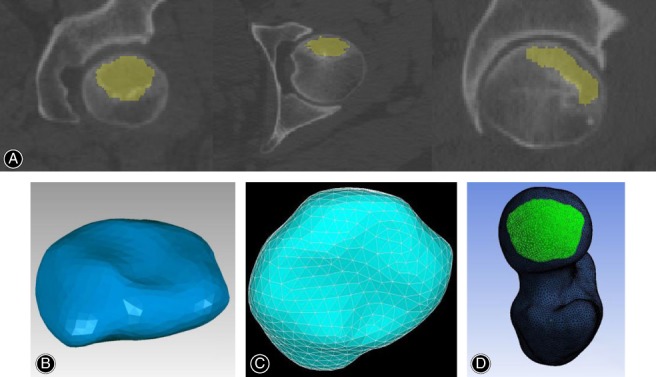
Finite element modeling of the necrotic lesion and contact area setting. (A) Segmentation of the necrotic lesion. (B) 3D solid model. (C) Finite element mesh. (D) Weight‐bearing area setting.
3D Model Reconstruction
The necrotic lesion and the proximal femur (included the necrotic portion) were reconstructed as two independent models in MIMICS. The separate models were exported to Geomagic Studio 2012 (Geomagic, USA) to remove surface artefacts for better computational handling. To create an independent model of the proximal femur without the necrotic lesion portion (viable bone tissue), the Boolean command tool of the Geomagic Studio was used to remove the necrotic portion inside the entire femoral head model.
Finite Element Mesh Generation and Material Property Assignment
The geometrical models saved as STL files were transferred into ANSYS Mechanical APDL (ANSYS, USA) and extended to finite element mesh automatically with 10‐node tetrahedral elements (Figs. 1C and 2C). The Hounsfield unit of the CT data was computed and projected onto these models. The Hounsfield unit distribution was translated into the bone mineral density (p in g/cm3) and the elastic modulus (E [MPa]) using the linear formulas described in our previous paper17.
Loading Conditions and Biomechanical Evaluation
Boundary conditions were applied to simulate the gait pattern of slow walking, and the distal end of the femur model was restrained. A load of 250% of body weight was applied on the weight‐bearing area of femoral head surface (Fig. 2D) for each model. After creation of the FEM, the stress analyses were performed using the finite element solver. To investigate the biomechanical alteration, the von Mises stress on the femoral head surface was calculated.
The von Mises Stress
The von Mises stress is often used in design work to determine whether an isotropic and ductile specimen will yield when subjected to a given loading condition. As for bioengineering studies, particularly in FEM study, the von Mises stress is a value used to determine if a given material will yield or fracture. Previous FEM studies on ONFH had reported different values of the von Mises stress when analyzing whether the femoral head would collapse under various loading conditions. Unfortunately, there is no consensus on the reference value of the von Mises stress for collapse prediction. To investigate the performance of this parameter in predicting femoral head collapse, the level of the maximum von Mises stress of all FEM was used for further comparison and ROC analysis in this study.
Statistical Analysis
Receiver operating characteristic curve analysis was used in this study to measure the collapse prediction performance of the maximum von Mises stress. The prediction performance was categorized according to the area under an ROC curve: fail (0.50–0.60), poor (0.60–0.70), fair (0.70–0.80), good (0.80–0.90), and excellent (0.90–1.00). The Youden index was used to choose the optimal cut‐off value. Predictive accuracy, positive predictive value (PPV), negative predictive value (NPV), likelihood ratio for a positive result [LR(+)], and likelihood ratio for a negative result [LR(−)] were also calculated and reported.
Results
Stress Distribution
The mean level of the maximum von Mises stress was 1.923 ± 0.793 MPa and 2.955 ± 0.540 MPa in the noncollapse group and the collapse group, respectively. The maximum von Mises stresses were significantly greater in the collapse group than those in the noncollapse group (P < 0.01, Fig. 3). Theoretically, the femoral head will fracture if the maximum value of von Mises stress induced in the FEM is more than the strength of the femoral head. These results supported the hypothesis that increased von Mises stress is closely associated with femoral head collapse. In addition, the data also suggested that alternation in stress distribution occurs long before the presence of femoral head collapse.
Figure 3.
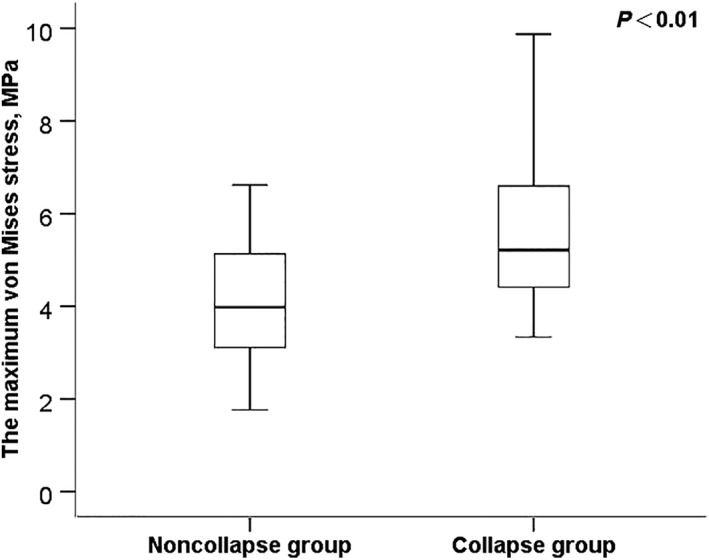
Comparison of the maximum levels of the von Mises stress by group.
Receiver Operating Characteristic Curve Analysis
The ROC curve is shown in Fig. 4 with an area under the curve of 0.842 (95% CI: 0.717–0.968, P < 0.01). Thus, the predictive performance of the maximum von Mises stress could be considered of good clinical significance. The maximum Youden index was 0.60 (Table 2), which corresponded to two optimal cut‐off values: 2.7027 MPa and 2.7801 MPa.
Figure 4.
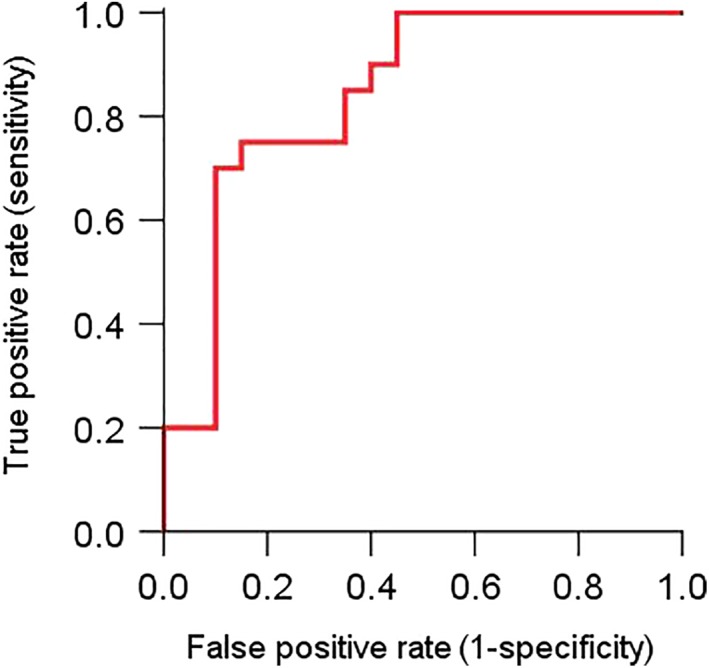
Receiver operating characteristic (ROC) curve of the maximum von Mises stress (the red curve).
Table 2.
Different cut‐off values and corresponding Youden indexes
| Cut‐off value | Sensitivity | 1 ‐ Specificity | Youden index |
|---|---|---|---|
| 2.7028 | 0.75 | 0.15 | 0.60 |
| 2.7801 | 0.70 | 0.10 | 0.60 |
| 1.9228 | 1.00 | 0.45 | 0.55 |
| 2.6699 | 0.75 | 0.20 | 0.55 |
| 2.8366 | 0.65 | 0.10 | 0.55 |
| 2.7210 | 0.70 | 0.15 | 0.55 |
| 1.7146 | 1.00 | 0.50 | 0.50 |
| 2.1681 | 0.90 | 0.40 | 0.50 |
| 2.3544 | 0.85 | 0.35 | 0.50 |
| 2.6054 | 0.75 | 0.25 | 0.50 |
| 2.8981 | 0.60 | 0.10 | 0.50 |
| 2.0474 | 0.95 | 0.45 | 0.50 |
| 2.4425 | 0.80 | 0.35 | 0.45 |
| 2.9626 | 0.55 | 0.10 | 0.45 |
| 2.1149 | 0.90 | 0.45 | 0.45 |
| 2.5264 | 0.75 | 0.30 | 0.45 |
| 1.5777 | 1.00 | 0.55 | 0.45 |
| 2.2212 | 0.85 | 0.40 | 0.45 |
| 1.4843 | 1.00 | 0.60 | 0.40 |
| 2.4651 | 0.75 | 0.35 | 0.40 |
| 3.0045 | 0.50 | 0.10 | 0.40 |
| 1.4060 | 1.00 | 0.65 | 0.35 |
| 3.0352 | 0.45 | 0.10 | 0.35 |
| 1.3280 | 1.00 | 0.70 | 0.30 |
| 3.0721 | 0.40 | 0.10 | 0.30 |
| 1.2377 | 1.00 | 0.75 | 0.25 |
| 3.1602 | 0.35 | 0.10 | 0.25 |
| 3.4432 | 0.20 | 0.00 | 0.20 |
| 3.2182 | 0.30 | 0.10 | 0.20 |
| 1.1773 | 1.00 | 0.80 | 0.20 |
| 1.0874 | 1.00 | 0.85 | 0.15 |
| 3.3347 | 0.20 | 0.05 | 0.15 |
| 3.2227 | 0.25 | 0.10 | 0.15 |
| 3.5154 | 0.15 | 0.00 | 0.15 |
| 3.2398 | 0.20 | 0.10 | 0.10 |
| 3.6932 | 0.10 | 0.00 | 0.10 |
| 1.0193 | 1.00 | 0.90 | 0.10 |
| 0.8998 | 1.00 | 0.95 | 0.05 |
| 3.8934 | 0.05 | 0.00 | 0.05 |
| −0.2170 | 1.00 | 1.00 | 0.00 |
| 4.9615 | 0.00 | 0.00 | 0.00 |
Collapse Risk Evaluation Model
Figures 5 and 6 were the scatter diagrams of the patients with the two optimal cut‐off rules. According to these prediction methods, a patient would be identified to have an increased risk of femoral head collapse if his/her level of the maximum von Mises stress was greater than the cut‐off value. In contrast, a patient whose maximum von Mises stress was less than the cut‐off value would be considered as having a decreased risk of femoral head collapse.
Figure 5.
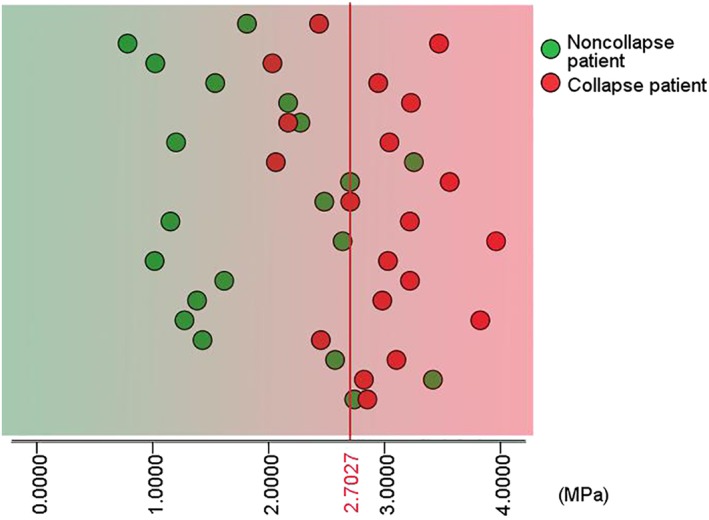
Patient scatter diagram with a cut‐off value of 2.7027 MPa.
Figure 6.
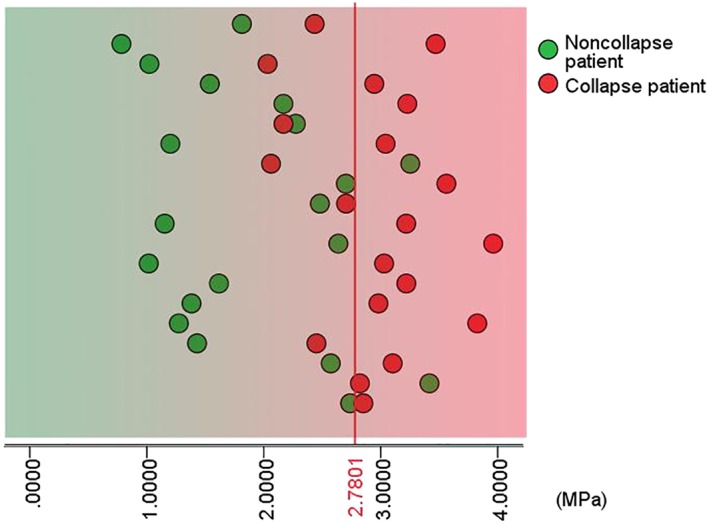
Patient scatter diagram with a cut‐off value of 2.7801 MPa.
Predictive Accuracy Evaluation
Measures of predictive accuracy are shown in Table 3. The results of predictive accuracy (80.00% vs 77.50%, respectively) were very close between these selected values. However, predictive accuracy can be heavily influenced by the proportion of positive cases, meaning that results from our study could easily be inconsistent with those from other studies with a different proportion of collapse cases in the participant population.
Table 3.
Measures of predictive accuracy of different cut‐off values of the maximum von Mises stress
| Cut‐off value (MPa) | 2.7027 MPa | 2.7801 MPa |
|---|---|---|
| Predictive accuracy (%) | 77.50 (31/40) | 80.00 (32/40) |
| Positive predictive value (PPV, %) | 78.94 (15/19) | 87.50 (14/16) |
| Negative predictive value (NPV, %) | 76.19 (16/21) | 75.00 (18/24) |
| Likelihood ratio for a positive result (LR+) | 5 | 7 |
| Likelihood ratio for a negative result (LR‐) | 0.29 | 0.33 |
Likelihood ratio (LR) is regarded as a better parameter for assessing the value of performing a diagnostic test. LR does not depend on the disease prevalence in examined groups, so the LR from one study are applicable to some other clinical settings. In this study, the level of 2.7801 MPa had greater LR(+) when compared to the level of 2.7027 MPa. The LR(+) was 7.00, corresponding to the cut‐off value of 2.7801 MPa and the LR(+) of 2.7027 MPa was 5.00. This meant that femoral head collapse would be 7 or 5 times as likely to be seen in ONFH patients with a positive result, as opposed to ONFH patients with a negative result.
Discussion
Before developing a precise prediction model for femoral head collapse, the parameters that should be included in the model must be determined. The necrotic lesion sizes and femoral head collapse risk are often directly proportional. Ha reported that greater modified Kerboul angles lead to higher risk of femoral head collapse19. Cherian found that the index of necrotic extent, the modified index of necrotic extent, and estimation of the percentage of involvement of the femoral head were reproducible and reliable methods to quantify the necrotic lesion sizes, which could also help identify hips at greatest risk of collapse20.
The collapse risk also depends on the stage of ONFH and the location of the necrotic lesion. Karasuyama suggested that stress concentration along the lateral sclerotic boundary triggered the subchondral fracture and finally induced the femoral head collapse21. Kubo reported different collapse rates of 0%, 23%, and 81%, respectively, corresponding to different locations of lateral sclerotic boundary at the medial one‐third, the middle third, and the lateral one‐third of the weight‐bearing portion of the acetabulum, and he found that the anterior sclerotic boundary could also have an impact on the risk of collapse11. Utsunomya generated patient‐specific FEM from 51 patients with ONFH, and he reported that stress was equally distributed on the femoral head surface in all FEM of ARCO Stage I hips, but stress was concentrated at the lateral boundary of the femoral head surface in all FEM of both ARCO Stages II and III hips, which is in accordance with the low‐intensity band on T1‐weighted MRI images, sclerotic changes on CT images and subchondral fractures on micro‐CT images22. In this theory, the onset time of femoral head collapse begins at the repairing phase.
Given the risk of femoral head collapse varies with size, location, and disease stage of necrotic lesions, and stress concentration is the key mechanism, the collapse risk of every single patient is different. It is of critical importance to estimate the patient‐specific risk of femoral head collapse before deciding which hip‐preserving treatment regimen to select. Whether the collapse risk has decreased is what concerns both the doctors and patients most during the follow‐up period of a certain treatment regimen. Therefore, a patient‐specific collapse risk estimation method, which can take into consideration the size, location, stage, and stress distribution, is urgently needed.
Finite element analysis has been used to study the collapse biomechanics of ONFH since the 1980s23 Recently, simulation models created by finite element methods based on either healthy participants or ONFH patients have been commonly used for biomechanism research on ONFH. However, to the best of our knowledge, this was the first time that the stress results from finite element analysis were used for femoral head collapse prediction. We generated patient‐specific FEM based on original CT images and we found that the level of the maximum von Mises stress in the collapse group was statistically greater than the maximum stress level in the noncollapse group. The ROC analysis result showed that the maximum level of von Mises stress was good at predicting femoral head collapse. The stress level of 2.7801 MPa was selected as the optimal cut‐off value because the corresponding Youden index was the greatest and the predictive accuracy was the most satisfactory.
Limitations
Patient participants in this study were divided into two groups based on the 1‐year follow‐up outcomes of whether femoral head collapse occurred or not. This represented a major limitation because there was a possibility that femoral head collapse might occur to patients of the noncollapse group in future follow up. Another major limitation was that all patients in this study had TCM treatment and crutches‐assisted weight‐bearing; this might also have had an effect on the outcomes. However, we thought the impact of conservative treatment was well‐balanced between the groups. The final limitation was that the current study was only a retrospective study. A prospective study with a larger number of cases is needed for further validation of our prediction method.
Conclusion
In sum, patient‐specific finite element model analysis is a potential method to estimate the individual risk of femoral head collapse and the maximum von Mises stress is a good indicator for collapse risk classification.
Grant Sources: This study was supported by grants from the National Natural Science Foundation of China (No. 81373801), the Beijing Municipal Natural Science Foundation of China (No. 7142170), and the research and development project 10 drugs for 10 diseases) to support and safeguard the G20, Beijing Municipal Commission of Science and Technology.
Disclosure: The authors declare that they have no conflicts of interest.
Informed Consent: Informed consent was obtained from all individual participants included in the study.
References
- 1. Issa K, Pivec R, Kapadia BH, et al Osteonecrosis of the femoral head: the total hip replacement solution. Bone Joint J, 2013, 95: 46‐50. [DOI] [PubMed] [Google Scholar]
- 2. Steinberg ME, Oh SC, Khoury V, Udupa JK, Steinberg DR. Lesion size measurement in femoral head necrosis. Int Orthop, 2018, 42: 1585–1591. [DOI] [PubMed] [Google Scholar]
- 3. Lee YJ, Cui Q, Koo KH. Is there a role of pharmacological treatments in the prevention or treatment of osteonecrosis of the femoral head?: a systematic review. J Bone Metab, 2019, 26: 13–18. [DOI] [PMC free article] [PubMed] [Google Scholar]
- 4. Pritchett JW. Statin therapy decreases the risk of osteonecrosis in patients receiving steroids. Clin Orthop Relat Res, 2001, 386: 173–178. [DOI] [PubMed] [Google Scholar]
- 5. Yuan HF, Guo CA, Yan ZQ. The use of bisphosphonate in the treatment of osteonecrosis of the femoral head: a meta‐analysis of randomized control trials. Osteoporos Int, 2016, 27: 295–299. [DOI] [PubMed] [Google Scholar]
- 6. Alves EM, Angrisani AT, Santiago MB. The use of extracorporeal shock waves in the treatment of osteonecrosis of the femoral head: a systematic review. Clin Rheumatol, 2009, 28: 1247–1251. [DOI] [PubMed] [Google Scholar]
- 7. Tabatabaee RM, Saberi S, Parvizi J, Mortazavi SMJ, Farzan M. Combining concentrated autologous bone marrow stem cells injection with Core decompression improves outcome for patients with early‐stage osteonecrosis of the femoral head: a comparative study. J Arthroplasty, 2015, 30: 11–15. [DOI] [PubMed] [Google Scholar]
- 8. Fuchs B, Knothe U, Hertel R, Ganz R. Femoral osteotomy and iliac graft vascularization for femoral head osteonecrosis. Clin Orthop Relat Res, 2003, 412: 84–93. [DOI] [PubMed] [Google Scholar]
- 9. Cao L, Guo C, Chen J, Chen Z, Yan Z. Free vascularized fibular grafting improves vascularity compared with Core decompression in femoral head osteonecrosis: a randomized clinical trial. Clin Orthop Relat Res, 2017, 475: 2230–2240. [DOI] [PMC free article] [PubMed] [Google Scholar]
- 10. Nam KW, Kim YL, Yoo JJ, Koo KH, Yoon KS, Kim HJ. Fate of untreated asymptomatic osteonecrosis of the femoral head. J Bone Joint Surg Am, 2008, 90: 477–484. [DOI] [PubMed] [Google Scholar]
- 11. Kubo Y, Motomura G, Ikemura S, et al The effect of the anterior boundary of necrotic lesion on the occurrence of collapse in osteonecrosis of the femoral head. Int Orthop, 2018, 42: 1449–1455. [DOI] [PubMed] [Google Scholar]
- 12. Zhao FC, Guo KJ, Li ZR. Osteonecrosis of the femoral head in SARS patients: seven years later. Eur J Orthop Surg Traumatol, 2013, 23: 671–677. [DOI] [PubMed] [Google Scholar]
- 13. Zhao DW, Hu YC. Chinese experts’ consensus on the diagnosis and treatment of osteonecrosis of the femoral head in adults. Orthop Surg, 2012, 4: 125–130. [DOI] [PMC free article] [PubMed] [Google Scholar]
- 14. Gardeniers JWM. Report of the Committee of Staging and Nomenclature. ARCO News Lett, 1993, 5: 79–82. [Google Scholar]
- 15. Chen WH, Kong XY, Wan R, et al Effects of Huogu I Formula on correlated factors of bone regeneration in chickens with steroid‐induced necrosis of femoral head. Chin J Integr Med, 2012, 18: 378–384. [DOI] [PubMed] [Google Scholar]
- 16. Jiang Y, Liu D, Kong X, Xu Y, Chen W, Lin N. Huogu I formula prevents steroid‐induced osteonecrosis in rats by down‐regulating PPARgamma expression and activating wnt/LRP5/ beta‐catenin signaling. J Tradit Chin Med, 2014, 34: 342–350. [DOI] [PubMed] [Google Scholar]
- 17. Kong XY, Wang RT, Tian N, Li L, Lin N, Chen WH. Effect of Huogu II Formula (II) with medicinal guide Radix Achyranthis Bidentatae on bone marrow stem cells directional homing to necrosis area after osteonecrosis of the femoral head in rabbit. Chin J Integr Med, 2012, 18: 761–768. [DOI] [PubMed] [Google Scholar]
- 18. Tang Q, He H, Yue Y, et al Mechanical evaluation of osteonecrosis of femoral head pre and post‐medical treatment: patient‐specific computations. Neurosci Biomed Eng, 2017, 5: 94–100. [Google Scholar]
- 19. Ha YC, Jung WH, Kim JR, et al Prediction of collapse in femoral head osteonecrosis: a modified Kerboul method with use of magnetic resonance images. J Bone Joint Surg Am, 2006, 88: 35–40. [DOI] [PubMed] [Google Scholar]
- 20. Cherian SF, Laorr A, Saleh KJ, et al Quantifying the extent of femoral head involvement in osteonecrosis. J Bone Joint Surg Am, 2003, 85: 309–315. [DOI] [PubMed] [Google Scholar]
- 21. Karasuyama K, Yamamoto T, Motomura G, Sonoda K, Kubo Y, Iwamoto Y. The role of sclerotic changes in the starting mechanisms of collapse: a histomorphometric and FEM study on the femoral head of osteonecrosis. Bone, 2015, 81: 644–648. [DOI] [PubMed] [Google Scholar]
- 22. Utsunomiya T, Motomura G, Ikemura S, et al Effects of sclerotic changes on stress concentration in early‐stage osteonecrosis: a patient‐specific, 3D finite element analysis. J Orthop Res, 2018, 36: 3169–3177. [DOI] [PubMed] [Google Scholar]
- 23. Brown TD, Mutschler TA, Ferguson AB. A non‐linear finite element analysis of some early collapse processes in femoral head osteonecrosis. J Biomech, 1982, 15: 705–715. [DOI] [PubMed] [Google Scholar]


