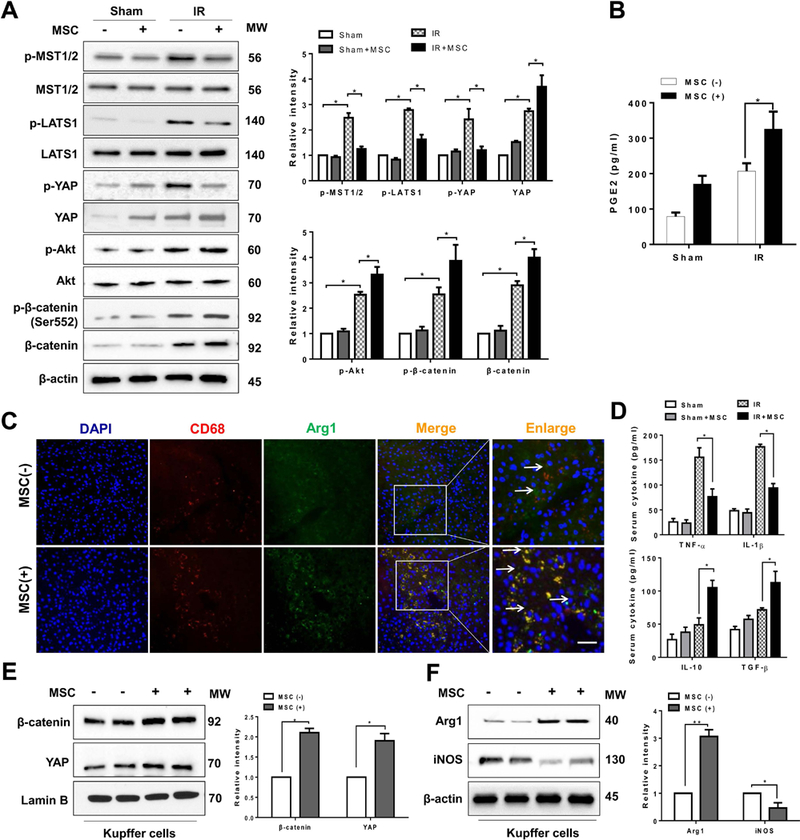
Figure 2. MSCs regulate Hippo signaling/β-catenin activation and control macrophage polarization in IR-stressed livers.

(A) Immunoblot-assisted analysis and relative density ratio of p-MST½, MST½, p-LATS1, LATS1, p-YAP, YAP, p-Akt, Akt, p-β-catenin, and β-catenin in IR-stressed livers with or without MSC treatment. Representative of three experiments. (B) ELISA analysis of PGE2 levels in animal serum (n=3–4 samples/group). (C) Representative immunofluorescence staining for the macrophage marker CD68 (red) and arginase-1 (Arg1, green) co-localization in IR-stressed livers (n=3–4 mice/group). DAPI was used to visualize nuclei (blue). Arrow indicated CD68 and Arg1 double positive macrophages (yellow). Scale bars, 20μm. (D) ELISA analysis of TNF-α, IL-1β, IL-10, and TGF-β levels in animal serum (n=3–4 samples/group). Immunoblot-assisted analysis and relative density ratio of nuclear YAP and β-catenin (E), and Arg1 and iNOS (F) in liver Kupffer cells. Representative of three experiments. All data represent the mean±SD. *p<0.05, **p<0.01.
