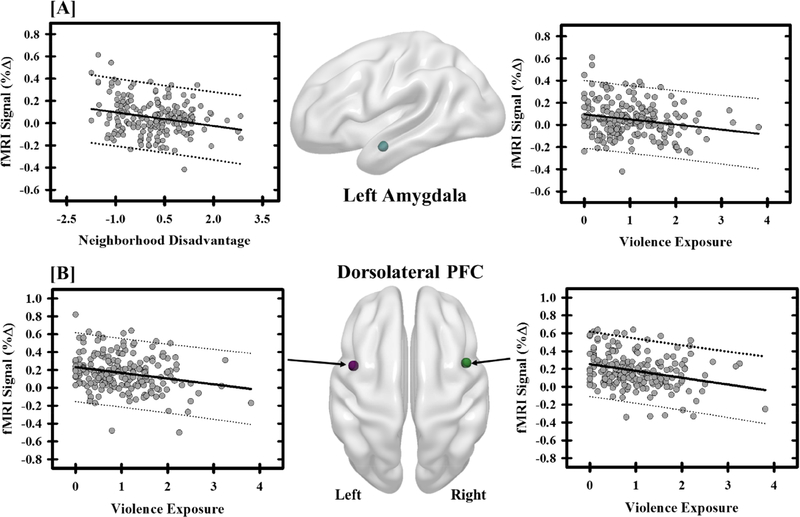
Figure 3.
Negative life experiences influence threat-elicited brain activity. The fMRI signal response (% change) within the amygdala showed negative relationships with neighborhood disadvantage and violence exposure (a). Specifically, participants with more neighborhood disadvantage and violence exposure showed diminished amygdala activity. Negative relationships were also observed between violence exposure and the fMRI signal response to threat within the dorsolateral prefrontal cortex (PFC) (b). Graphs depict the mean fMRI signal response (% change) and negative life experience (i.e., neighborhood disadvantage and violence exposure) for each participant (grey dots). The solid black line reflects the line of best fit, and the dashed lines represent the prediction bands.

