

Abstract
Empirical testing of chemicals for drug efficacy costs many billions of dollars every year. The ability to predict the action of molecules in silico would greatly increase the speed and decrease the cost of prioritizing drug leads. Here, we asked whether drug function, defined as MeSH “therapeutic use” classes, can be predicted from only a chemical structure. We evaluated two chemical-structure-derived drug classification methods, chemical images with convolutional neural networks and molecular fingerprints with random forests, both of which outperformed previous predictions that used drug-induced transcriptomic changes as chemical representations. This suggests that the structure of a chemical contains at least as much information about its therapeutic use as the transcriptional cellular response to that chemical. Furthermore, because training data based on chemical structure is not limited to a small set of molecules for which transcriptomic measurements are available, our strategy can leverage more training data to significantly improve predictive accuracy to 83–88%. Finally, we explore use of these models for prediction of side effects and drug-repurposing opportunities and demonstrate the effectiveness of this modeling strategy for multilabel classification.
Introduction
Development of molecules with new or improved properties is needed in many industries, including energy, agriculture, and medicine. However, the number of possible molecules to explore, also referred to as chemical space, is exceedingly large.1,2 Even when chemical space is limited to compounds that conform to “Lipinski’s rule of five”,3 which applies to the subtask of drug development, there are still as many as 1060 possible chemical structures.4 Regardless of the available chemical diversity, the pace of new drug approvals has steadily decreased, leaving room for new approaches that can improve the current process.
A promising approach for discovering new drug molecules is machine learning,5,6 which includes so-called deep learning using deep neural networks (DNNs).7 Many studies describe methods for embedding molecules into a latent space and engineering molecules with desirable properties.8−10 Reinforcement learning has been applied with paired DNNs to design molecules with desired properties, such as solubility or transcription factor inhibition.11 A framework for benchmarking model predictions is available.12 One study used a generative adversarial neural network architecture to generate molecules that should induce specific transcriptomic states.13 There are many ways to represent molecules for machine learning. Many papers use SMILES strings14−16 as molecular inputs for embedding, but there is a trend toward the use of molecular graphs.17−19
A general weakness of DNNs is that they perform best with large amounts of training data (100 000 to millions of examples, e.g., ImageNet20). However, DNNs can be used for problems with small training data sets through transfer learning, where networks are trained on a large data set for one problem and adapted for a related problem that has less training data.21−23 For example, transfer learning has been applied to classification of fewer than 6000 medical ultrasound images,24 only 2000 oceanfront images,25 or fewer than 1000 cellular images,26 even though these networks were pretrained on images of completely different objects.
One type of DNN for structured data such as sequences and images, the convolutional neural network (CNN), has enabled major advances in image-processing tasks in diverse fields. In chemistry, several papers have described excellent performance resulting from the use of two-dimensional images of chemicals with CNNs. This approach has been used effectively to predict chemical toxicity27 with regard to the 12 biological toxicity endpoints in the Tox21 challenge.28 CNNs for chemical images have also been described as a general-purpose molecule property prediction tool despite their lack of explicit chemistry knowledge.29 These authors found that augmenting the same deep-learning architecture with only three additional chemical properties further improved model performance,30 suggesting that chemical images alone may not entirely capture the important characteristics of a chemical. Finally, images and CNNs have been used to predict drug–protein interactions and outperformed models trained on flattened versions of the images, which cannot exploit the spatial structure.31
The various ways to measure and represent molecules lead to a philosophical question about the nature of chemicals,32 and the related fundamental question of whether a single representation can completely describe a chemical entity (reviewed in ref (9)). As described above, several chemical-structure-derived embeddings are often used for cheminformatics, such as chemical images or circular molecular fingerprints. Alternatively, molecules can be represented by an analytical measurement33 or by their influence on biological systems (e.g., transcriptomic or morphological changes).34,35 There are open questions regarding the relative utility of these various chemical representation strategies for different predictive tasks relevant to drug development.
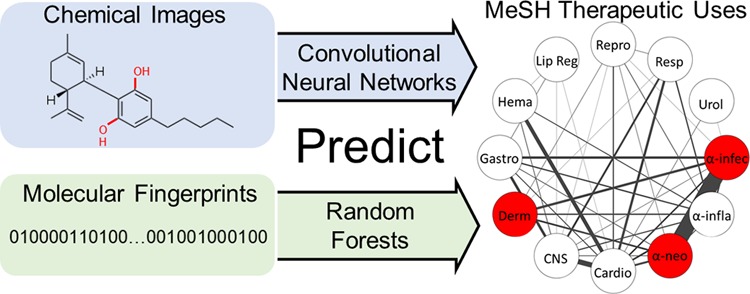
In this paper, we use machine learning and chemical-structure-derived molecule representations to predict specific medical subheading (MeSH) “therapeutic uses” classes.36 We first performed the same classification task with the same set of 676 molecules previously selected by Aliper et al.34 In contrast to our chemical-structure-derived models, Aliper et al. used molecule-induced transcriptome changes from the LINCS project37 as a proxy molecule representation. We employed two strategies: (1) chemical images with CNNs and (2) Morgan fingerprints (MFPs)38 with random forests (RFs)39 (Figure 1). We chose to use the CNN with images because of extensive precedent for the effectiveness of this pair, and we chose to use MFP with RF because we and others have seen excellent performance of this representation-model pair.40 Our goal was to assess whether drug function classifier models trained with readily available chemical structure inputs can outperform models trained with empirical measures of drug effects. Our results support the effectiveness of chemical-structure-based models. Both classification models trained with chemical-structure-derived features greatly outperform the previous benchmark based on drug-induced transcriptomic changes. Furthermore, because we require only a chemical structure, the models can be greatly improved by training on more than 6000 additional compounds that do not have associated transcriptomic data. Our main contribution is that chemical structures alone are effective predictors of therapeutic use classes.
Figure 1.

Structure-based drug classification pipelines. Chemicals from 12 medical subheadings (MeSH) therapeutic use classifications were converted to either two-dimensional color molecule images or Morgan molecular fingerprints. Molecule images were used to train a convolutional neural network (IMG + CNN) classifier, and fingerprints were used to train a random forest (MFP + RF) classifier. The models were used separately to predict classes of drugs using stratified cross-validation.
Methods
All Python code for the CNN and RF models and the preprocessed data sets are available from https://github.com/jgmeyerucsd/drug-class. The release version 0.1 of the repository including all Python code and data has also been archived at Zenodo (https://doi.org/10.5281/zenodo.3385194).
Data
A primary goal of this work was to compare empirically derived chemical features, such as the transcriptome-based model from Aliper et al.,34 with chemical-structure-derived representations. Therefore, in the first evaluation, we emulated their framing of the prediction task, which is to predict 1 of 12 MeSH therapeutic use classes of chemicals. The specific version of the data used by Aliper et al., including training/validation groups, is unavailable. Therefore, our exact training and validation sets are different. To make the fairest-possible comparison, we constructed a data set following the same guidelines as Aliper et al.
Molecules were selected from PubChem41 on October 2nd, 2018 according to their MeSH therapeutic uses classification (chemicals and drugs category > chemical actions and uses > pharmacologic actions > therapeutic uses). Although there are 20 high-level categories, we used only the 12 classes described previously.34 Molecules in these 12 classes were downloaded in a spreadsheet containing their compound identification numbers (CIDs). A total of 11 929 CIDs were converted to SMILES strings using the Python package pubchempy (https://github.com/mcs07/PubChemPy). SMILES strings with a length of more than 400 or membership to more than 1 of 12 MeSH therapeutic classes were excluded, leaving 8372 SMILES. For this analysis, chemicals in multiple classes were excluded as described previously to enable direct comparison.34 This final list was filtered to remove multiple versions of molecules that differ by only accompanying salts. The final filtered total was 6955 molecules. The distribution of molecules among classes is given in Table 1. This set of all molecules was divided into five folds stratified based on the class for cross-validation.
Table 1. Summary of Examples across Data Classes and Task Subgroups.
| MeSH therapeutic uses | # Aliper et al. | # total | task subgroups |
|---|---|---|---|
| antineoplastic | 111 | 1177 | 3, 5, 12 |
| cardiovascular | 125 | 788 | 3, 5, 12 |
| central nervous system (CNS) | 172 | 1139 | 3, 5, 12 |
| anti-infective | 141 | 2398 | 5, 12 |
| gastrointestinal | 30 | 258 | 5, 12 |
| anti-inflammatory | 19 | 373 | 12 |
| dermatological | 6 | 116 | 12 |
| hematologic | 17 | 267 | 12 |
| lipid regulating | 19 | 164 | 12 |
| reproductive control | 16 | 148 | 12 |
| respiratory system | 11 | 101 | 12 |
| urological | 9 | 26 | 12 |
SMILES strings were converted into three-color (RGB) images with size 500 × 500 pixels or 1024 bit Morgan fingerprints using the Python package RDKit.42 Images generated by RDKit always fit the entire molecule structure, so molecules of different sizes are not problematic. All images used for training and validation are available on GitHub. Molecule classes were then split into three subgroups for model training and prediction: 3-, 5-, or 12-class prediction tasks according to the groupings described previously by Aliper et al. (Table 1).
For the comparison with Aliper et al.’s results, we took the list of molecules in their Table S1 (Supporting Information) and retrieved SMILES strings from PubChem using pubchempy. Images were generated as described above. During the removal of salts from their original set of 678 molecules, we found that two drugs, one from the anti-infective class and one from the CNS class, were the same molecules with different salt pairs. The copies of these two duplicate molecules were removed. The numbers of chemicals in this smaller data set are given in Table 1. This set of 676 molecules was split into 10 folds stratified based on class membership to mimic the methods or Aliper et al. as closely as possible. However, the dermatological and urological classes have less than 10 molecules and therefore are missing validation examples in some folds. For those folds missing validation examples, the receiver operator characteristic area under the curve (ROC AUC) and average precision metrics were not computed.
Images with Convolutional Neural Networks (IMG + CNN): Single Label
Molecule images with RGB channels were resized to 150 × 150 pixels and used for retraining and validation of a CNN with predetermined weights from resnext101_6443 implemented using fastai and pytorch.44 The loss function used was binary cross entropy, and the output layer was logsoftmax. A cyclic cosine annealing learning rate was used during training,45 which decreases from the initial setting toward 0 over a number of epochs. The number of epochs needed to decay the learning rate to the final value was doubled every cycle. An example of the learning rate versus batch is shown in Figure S1 along with the corresponding training loss.
To determine the best hyperparameters for all CNN models and data subsets, we first performed hyperparameter optimization on the small set of 676 compounds. Hyperparameter optimization was done with nested 10-fold cross-validation using class-stratified folds. Varied hyperparameters were as follows: (1) dropout proportions of 20, 40, or 60%, (2) retraining all weights or only the output layer weights, and (3) the initial learning rates for cosine annealing ([5 × 10⁻⁵, 5 × 10⁻⁴, and 5 × 10⁻³] or [1 × 10⁻⁴, 1 × 10⁻³, and 1 × 10⁻²] for early, middle, and output layers, respectively). Fixed training hyperparameters were the batch size of 25, seven cycles of cosine annealing learning rate with decay rate decreased by half each cycle (totaling 127 epochs), and data augmentation with random zooms of up to 10% and random horizontal or vertical image flips. Average accuracy values from each of the hyperparameter groups tested during the inner loops of nested cross-validation are given in Table S1. Based on the results of this hyperparameter search, the hyperparameters that most often resulted in the best accuracy on the inner loop fold were used for training all other models, including CNNs trained on the larger set of 6955 compounds. The tested learning rates had a minimal effect on accuracy. The largest effect on accuracy resulted from retraining all weights instead of training only the output weights. These best hyperparameters from the grid were (1) 40% dropout, (2) retraining all weights, and (3) the higher learning rate set of [1 × 10⁻⁴, 1 × 10⁻³, and 1 × 10⁻²] for early, middle, and output neuron layer groups, respectively.
Molecular Fingerprints with Random Forests (MFP + RF)
Random forests39 are ensembles of decision trees, where each tree is learned on a subsample of data points and features (in this case, bits in a molecular fingerprint). Benchmarking studies often include MFP + RF models because they are easy to train and have strong performance on a variety of computational chemistry tasks.12,40,46−50 The random forest model was implemented with scikit-learn.51 Separate hyperparameter grid searches (216 combinations, Table 2) were performed for the 676 and 6955 compound analyses in a nested cross-validation setting. For each outer loop, the best set of hyperparameters was selected based on the inner loop cross-validation accuracy. These hyperparameters were then used to train on all of the inner loop compounds and assess performance on the outer loop validation set.
Table 2. Hyperparameter Values for the Random Forest Classifier That Were Explored by Grid Search.
| parameter | values |
|---|---|
| # estimators | 50, 250, 1000, 4000, 8000, 16 000 |
| max features | none, sqrt, Log 2 |
| min sample leaf | 1, 10, 100, 1000 |
| class weight | none, balanced subsample, balanced |
Comparison of Druglike Properties
CIDs were used to download molecular weight, XLog P, HBondAcceptorCount, HBondDonorCount, and IsomericSMILES values using pubchempy. Compounds were then filtered to include nonredundant IsomericSMILES values and only drugs with a single-class label (Table S2). XLog P values are computed52 rather than measured and were not available for all queried compounds (Table S3). Violin plots were created using ggplot2 (https://ggplot2.tidyverse.org/). For each quantitative feature, a Welch’s analysis of variance (ANOVA) and Games-Howell posthoc test (R package userfriendlyscience, https://cran.r-project.org/web/packages/userfriendlyscience/index.html) were used to compare differences between chemical features between drug class groups. This test was selected because it does not assume a normal distribution, even variance, or equal sample sizes between groups.53 Adjusted p-values from the Games-Howell posthoc test are reported in Table S4. Drug-class-level distribution and pairwise relations of chemical features were further visualized with Seaborn (https://seaborn.pydata.org/).
Single-Label Classification Models: Training, Comparison, and Evaluation
Training data for 676 molecules with transcriptomic measurements available was split into 10 folds for cross-validation, and the training data for all 6955 available annotated molecules in the 12 MeSH classes was split into 5-folds. When referring to model performance and metrics, all values are from the held-out folds referred to as validation folds, and metrics are the average performance of the validation folds unless otherwise specified. Although it is often recommended to use chemical-structure-based clustering or more advanced techniques54 to create cross-validation folds, we randomly split molecules into folds. We checked the chemical similarity of our five folds of the larger data set using ChemTreeMap55 and found the folds to be randomly distributed in chemical space (Figure S2). Therefore, the validation fold molecules are within the applicability domain56,57 of the trained models. Consequently, the evaluation could overestimate the performance of models on new molecules outside this applicability domain.
Trained models were evaluated using the following metrics from scikit-learn 0.20.3: accuracy, balanced accuracy, Matthew’s correlation coefficient (MCC), ROC AUC, and average precision score. The classification accuracy of the five validation sets was used as the primary model comparison metric. Class-specific prediction accuracy of the models was compared using confusion matrices for a single representative validation fold. We also compared our prediction accuracy with the accuracy previously reported by Aliper et al.34 However, it should be clearly noted that although we used the same molecules, the exact training and validation sets were unavailable, so the accuracies are not perfectly comparable.
IMG + CNN: Multilabel Classification
The set of all molecules including those with multiple class memberships (8336 molecules assigned a total of 9885 classes, an average of 1.2 classes per molecule) was used to train additional convolutional neural networks for multilabel classification using the fastai package. The data was split into five folds based on pairwise class co-occurrence using the iterative class splitter from the skmultilearn package.58 A Jupyter notebook containing the code used to train the models is available on the GitHub repository under multiclass_data/multiclass_5foldCV.ipynb. Resnet50 was used as the pretrained model and weights, and 40% dropout was used with image data augmentation. Training images were 256 × 256 and were processed in batches of 40. All weights were retrained for each CNN model for 127 epochs (the same number as for a single class) using the updated one-cycle policy.59
The multilabel classification was evaluated by computing thresholded accuracy and Fβ (β of 2.0, the fastai default) using a default score cutoff of 0.5. ROC AUC and average precision scores were also computed as described for the single-label classification models using the weighted average. Finally, a network of the class relationships was computed using the pairwise co-occurrence of classes using the networkx (https://networkx.github.io/) and igraph (https://igraph.org/python/) Python packages according to the skmultilearn tutorial (http://scikit.ml/labelrelations.html). Network graphs were visualized with their edge width proportional to the strength of the node relationship as defined by the number of co-occurrences of the classes.
Results
Classification with a Small Benchmark Data Set
Two chemical-structure-derived representations were used for training and classification with two different model architectures: (1) IMG + CNN or (2) MFP + RF (Figure 1). Molecules were split into three subtask sets as described previously.34 Each subtask set contained 408, 579, or 676 molecules for the 3-, 5-, and 12-class problems, respectively. Table 3 gives a summary of the validation set accuracy for the models described here in comparison with results from Aliper et al. who used a multilayer perceptron DNN or support vector machine (SVM) with gene expression changes as the model input. For 5- and 12-class subtasks, MFP + RF performed best, achieving 64.1% accuracy on the 12-class prediction task, representing an improvement over the expression-based DNN that achieved only 54.6% accuracy. The IMG + CNN model produced accuracy similar to the MFP + RF for the 3-class subtask but achieved about 4% points worse accuracy on the 5- and 12-class problems. However, IMG + CNN models still significantly outperformed the previous gene-expression-based models in all cases. Accuracy can be inflated when the class labels are not evenly distributed (Table 1). Balanced accuracy and MCC are more robust with skewed classes but were not reported for the gene-expression-based models. For the IMG + CNN and MFP + RF, these values are lower than the accuracy but good overall.
Table 3. Average Metrics for Each of 10 Hold-Out Folds from Cross-Validation Using 676 Molecules from Aliper et al. Annotated with Only One of the 12 MeSH Classesa.
| problem group | metric | SVM1 | DNN2 | IMG + CNN3 | MFP + RF4 |
|---|---|---|---|---|---|
| 3-class | accuracy | 0.53 | 0.701 | 0.747 ± 0.0657 | 0.742 ± 0.0692 |
| balanced accuracy | 0.739 ± 0.0644 | 0.715 ± 0.0766 | |||
| MCC | 0.619 ± 0.102 | 0.612 ± 0.106 | |||
| ROC AUC | 0.870 ± 0.0412 | 0.894 ± 0.0417 | |||
| ave. precision score | 0.806 ± 0.0592 | 0.847 ± 0.0588 | |||
| 5-class | accuracy | 0.417 | 0.596 | 0.653 ± 0.0451 | 0.694 ± 0.0497 |
| balanced accuracy | 0.620 ± 0.0509 | 0.635 ± 0.0661 | |||
| MCC | 0.549 ± 0.0599 | 0.606 ± 0.0660 | |||
| ROC AUC | 0.867 ± 0.0322 | 0.892 ± 0.0284 | |||
| ave. precision score | 0.735 ± 0.0568 | 0.791 ± 0.0471 | |||
| 12-class | accuracy | 0.366 | 0.546 | 0.608 ± 0.0500 | 0.641 ± 0.0331 |
| balanced accuracy | 0.507 ± 0.107 | 0.504 ± 0.0522 | |||
| MCC | 0.525 ± 0.0620 | 0.572 ± 0.0388 | |||
| ROC AUCb | 0.863 ± 0.209 | 0.896 ± 0.0200 | |||
| ave. precision scoreb | 0.672 ± 0.0303 | 0.751 ± 0.0205 |
Values for the gene-expression-based models are from Aliper et al. who used different training and validation folds for 10-fold cross-validation with a 1support vector machine (SVM) or 2multilayer perceptron deep neural network (DNN) based on pathway activation scores. Values from this paper using 3molecule images input to a convolutional neural network (IMG + CNN) or 4Morgan molecular fingerprints as the input to the random forest (MFP + RF). Values for 3,4 are the mean of the validation folds ± standard deviation.
Receiver operator characteristic area under the curve (ROC AUC) and average precision score were computed as the weighted average of scores across classes and only computed for the first six validation sets of the 12-class problem due to fewer than 10 examples in the dermatological and urological classes.
Classification with All Annotated Chemicals
A major limitation of using empirical chemical features generated from biological experiments, such as gene expression, is that time and financial costs of experiments limit the size of the training data. For the drug function prediction task, there are roughly 10× more molecules available annotated with the 12 MeSH classes than the number of molecules with transcriptomic data. To highlight the value of using a chemical-based representation instead of an empirical representation, we trained additional models with all available 6955 chemical structures. The use of more training data was greatly beneficial to both representation-model pairs resulting in accuracies of 83–88% and ROC AUC values of more than 0.969 (Table 4). ROC curves for predictions from the IMG + CNN model are shown in Figure 2, and curves for the MFP + RF are shown in Figure S3. With this larger training data set, the five-fold cross-validation evaluation metrics are quite similar for the IMG + CNN and MFP + RF models. The MFP + RF model has a slight advantage over the IMG + CNN model when using the metrics that consider the complete rankings of chemicals by predicted class probabilities (ROC AUC and average precision).
Table 4. Average Metrics for Each of Five Validation Folds from Cross-Validation Using the Full Set of 6955 Molecules Annotated with Only One of the 12 MeSH Classes.
| problem group | metric | IMG + CNN | MFP + RF |
|---|---|---|---|
| 3-class | accuracy | 0.884 ± 0.0108 | 0.882 ± 0.0142 |
| balanced accuracy | 0.879 ± 0.0143 | 0.870 ± 0.0162 | |
| MCC | 0.823 ± 0.0168 | 0.822 ± 0.0217 | |
| ROC AUC | 0.970 ± 0.0063 | 0.978 ± 0.00382 | |
| ave. precision score | 0.950 ± 0.0108 | 0.978 ± 0.00382 | |
| 5-class | accuracy | 0.863 ± 0.0104 | 0.871 ± 0.00700 |
| balanced accuracy | 0.828 ± 0.0167 | 0.822 ± 0.0183 | |
| MCC | 0.811 ± 0.0140 | 0.821 ± 0.00969 | |
| ROC AUC | 0.972 ± 0.0046 | 0.981 ± 0.00284 | |
| ave. precision score | 0.933 ± 0.0093 | 0.950 ± 0.00582 | |
| 12-class | accuracy | 0.834 ± 0.0084 | 0.838 ± 0.00677 |
| balanced accuracy | 0.735 ± 0.0258 | 0.719 ± 0.0248 | |
| MCC | 0.793 ± 0.0105 | 0.797 ± 0.00831 | |
| ROC AUCa | 0.969 ± 0.0026 | 0.977 ± 0.00227 | |
| ave. precision scorea | 0.900 ± 0.0073 | 0.918 ± 0.00392 |
Receiver operator characteristic area under the curve (ROC AUC) and average precision score were computed as the weighted average of scores across classes.
Figure 2.
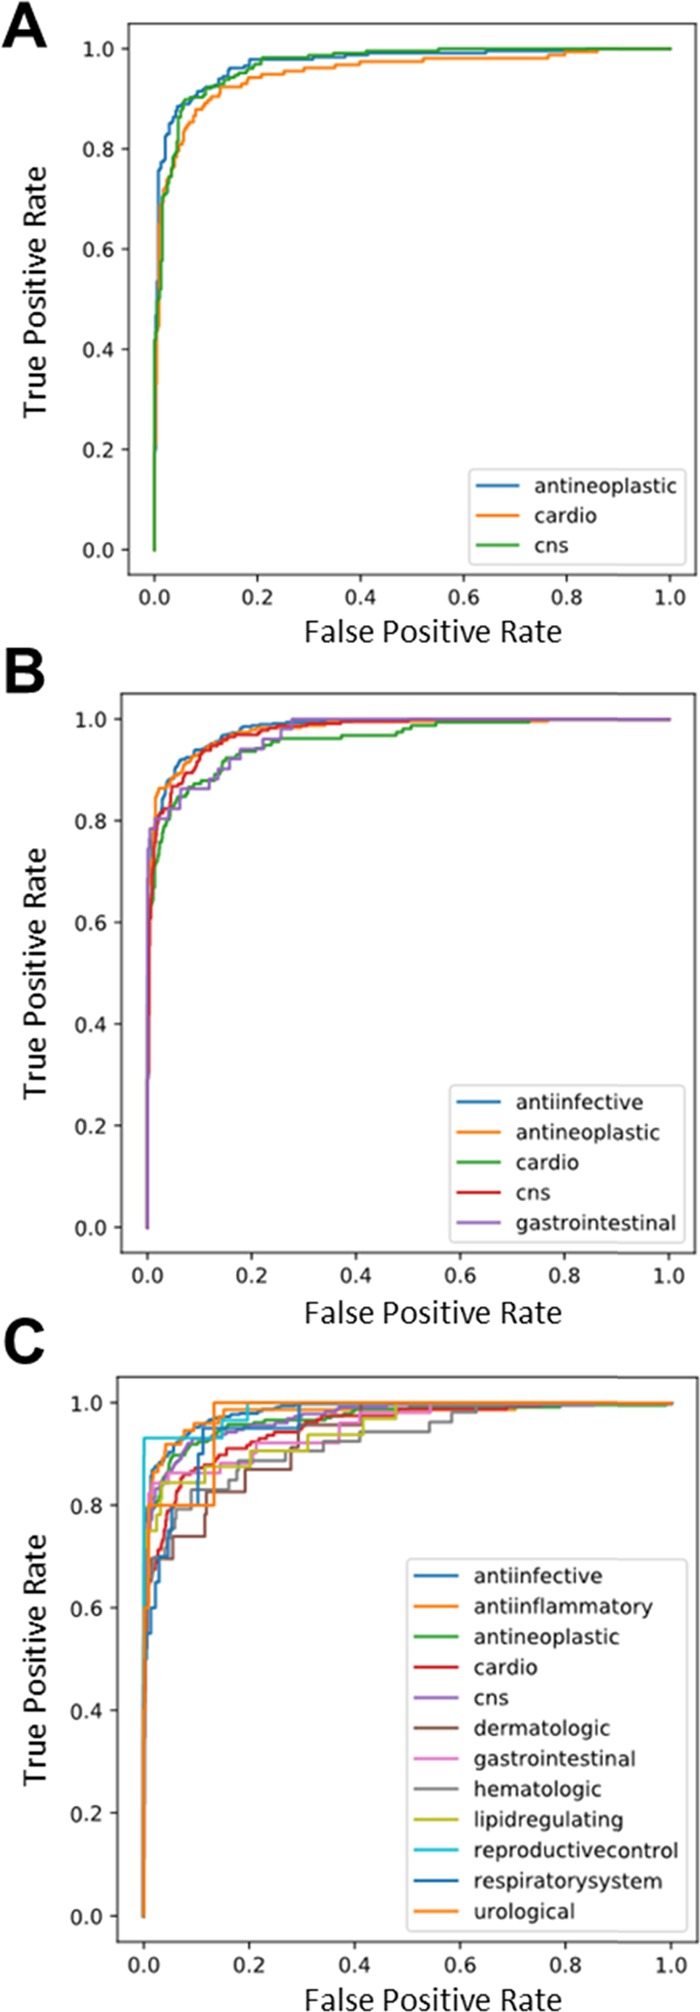
Receiver operator characteristic curves from the IMG + CNN model predictions on the fifth validation set of the (A) 3-, (B) 5-, and (C) 12-class data sets. Performance on this example fold is representative of the performance on all five folds shown in Table 4.
Model and Representation Comparisons
Given the unequal stratification among examples within classes in the training and validation sets, the per-class performance of both models was compared on one representative validation fold. Confusion matrices enable this comparison by showing the fraction of predicted classes for each true class. Confusion matrices from IMG + CNN model predictions for each subtask revealed differences in class-wise prediction accuracy (Figure 3). In the 3-class subtask, the prediction performance was similar among the three groups. The most difficult class to predict was cardiovascular drugs; 13% of cardiovascular drugs were predicted incorrectly as CNS drugs (Figure 3A). In the 5-class subtask, which includes the 3-class drugs and gastrointestinal and anti-infective drugs, classification accuracy was generally worse than the 3-class subtask (Figure 3B). The proportion of correct predictions roughly followed the number of examples available with anti-infective drugs predicted at high correctness (93%). Gastrointestinal drugs are the smallest class but are predicted more correctly (78%) than cardiovascular drugs (76%). In the 12-class prediction task, the correctness for anti-infective molecules remained the highest (92%), and smaller classes were generally predicted less accurately (Figure 3C). The smallest class, “urological agent”, which contains only 26 molecules, was rarely predicted correctly in the validation set (40%). The difference in class sizes likely contributes to this deficiency, and we did not directly control for this during training. Cardiovascular drugs were consistently confused for CNS drugs across all three subtasks.
Figure 3.

Confusion matrices from IMG + CNN classifiers showing the proportion of each predicted class (x axis) for molecules in each true class (y axis). Results are from the (A) 3-, (B) 5-, and (C) 12-class task subgroups. Each matrix shows the predictions from the fifth validation set using IMG + CNN models trained on the large single-class data set.
The same confusion matrix analysis of per-class validation set predictions for results from the MFP + RF models showed overall similar percentages of correct predictions within 5% points (Figure S4). An interesting observation is that the MFP + RF made different general errors than the IMG + CNN model, suggesting that these models learn different features. MFP + RF more often overpredicted drugs as anti-infective, which may explain the 97% correct predictions for that class. For example, the RF and CNN predicted 11 and 0%, respectively, of hematological drugs as anti-infective. There were also class-specific performance differences. MFP + RF models were better at predicting CNS agents correctly (MFP + RF: 90% vs IMG + CNN: 85%) and dermatologic agents (MFP + RF: 57% vs IMG + CNN: 52%), but the IMG + CNN models were better at predicting cardiovascular agents (MFP + RF: 68% vs IMG + CNN: 73%). Overall, these class-wise analyses of model predictions with confusion matrixes revealed interesting differences in model performance.
Chemical Insight into Learned Molecule Properties
Druglike properties of a compound are related to its chemical features such as molecular weight, lipophilicity, and the number of hydrogen bond donors and acceptors (e.g., quantitative structure activity relationships). Lipinski’s rule of five famously states that a druglike compound should have no more than five hydrogen bond donors, 10 hydrogen bond acceptors, a log P greater than 5 (related to hydrophobicity), and a molecular weight under 500.3 These properties are directly or indirectly encoded in the image- and fingerprint-based representations of chemical structure we used to train models.
To make inferences about what chemical properties our models may have learned, we computed molecular weight, Xlog P, and hydrogen bond donors and acceptors for our all single-class molecules and compared their distributions with one-way ANOVA and Games-Howell posthoc testing (Figures 4 and S5; Tables S2 and S4). Our IMG + CNN model often confused respiratory drugs with cardiovascular drugs (30%, Figure 3), and the chemical property analysis revealed that this drug class was indistinguishable from cardiovascular drugs with regard to the four computed properties (Table S4, row 51, adjusted p-value = 1). The similarity of these properties may explain the confusion. Conversely, respiratory drugs are indistinguishable from gastrointestinal drugs across Lipinski’s properties, but both models can easily distinguish these two classes. This suggests that there are important structural features of drugs learned by the classifiers that fall beyond the conventional framework of how chemists understand druglike chemical properties.
Figure 4.

Class-level distribution of Lipinski’s druglike properties: (A) molecular weight, (B) Xlog P, (C) hydrogen bond acceptor count, and (D) hydrogen bond donor count.
Other connections between statistically significant differences in molecular properties and model confusion are less interpretable. Dermatologic drugs were often confused for anti-infective (17%) and gastrointestinal drugs (9%) despite all properties showing significant differences (adjusted p-values < 3.6 × 10⁻³). However, the MFP + RF model often confused dermatologic drugs for CNS agents (Figure S4), which is a mistake that the IMG + CNN model never makes (0%). This pair of chemical classes is statistically different in only the number of hydrogen bond donors. Thus, it is possible that the RF is underweighting this difference, whereas the IMG + CNN model has learned to use it.
Drug-Repurposing Opportunities and Mechanism of Action from Misclassification
Misclassification of drugs can be interpreted in at least two ways: (1) the model has not learned enough to accurately predict the true class, or (2) the model has learned something new about the drugs and classes. Although the latter is more interesting, the former is the safer and more likely interpretation. However, cases where the model is wrong might present opportunities for drug repurposing. In addition, we hypothesize that those incorrect predictions might be useful for understanding drug mechanisms. For example, among the six molecules in the urological drug validation set, the IMG + CNN model misclassified trospium as a central nervous system (CNS) agent. This is not surprising, however, because trospium is known mechanistically as a muscarinic antagonist,60 which is a common function of CNS drugs. In fact, the structure of trospium is similar to another muscarinic antagonist used to treat Parkinson’s disease, benztropine61 (Figure 5).
Figure 5.

Example of a misclassified drug that reveals the mechanism and repurposing opportunities. (A) Structure of trospium, a urological drug known to act as a cholinergic muscarinic antagonist, which was classified by the model as a CNS agent. (B) Structure of benztropine, a muscarinic antagonist used to treat Parkinson’s disease.
Multilabel Classification
The same strategy of structure-based drug molecule function prediction was also extended to multilabel classification, where more than one MeSH therapeutic uses class can be predicted for each chemical structure. When not filtered for molecules present only in a single class, there are a total of 8336 molecules assigned to these 12 MeSH therapeutic uses classes; each molecule has an average of 1.2 class labels. We trained a separate IMG + CNN model to learn these drug classes in the multilabel setting and evaluated the accuracy, Fβ score, ROC AUC, and average precision score (Table 5). This multilabel prediction model achieved excellent performance in all computed metrics, but the ROC AUC and average precision scores show that the multilabel prediction task is more challenging than the single-label version (Table 4). This demonstrates the feasibility of extending our structure-based therapeutic use prediction models for multifunction prediction.
Table 5. Multilabel Classification of the 8336 Molecules with an Average of 1.2 Classes Assigned to Each Moleculea.
Multilabel predictions were evaluated locally by examining specific examples. Examples of multiclass molecules that were predicted perfectly are shown in Figure 6. Each of these molecules was correctly classified as anti-infective despite very diverse chemical constituents. Hypocrellin is a round, nearly planar compound with a significant aromatic electron system and several types of oxygen functional groups, including methyl ethers, hydroxyls, and ketones (Figure 6A). Sulfasalazine is often used as a first-line rheumatoid arthritis treatment and is a long compound with multiple unique functional groups, including azobenzene (Figure 6B). Acemannan is a mucopolysaccharide from aloe vera leaves (Figure 6C). Hypocrellin and acemannan were also correctly labeled as antineoplastic drugs, and both sulfasalazine and acemannan were recognized as gastrointestinal drugs. These examples show that the model has learned to associate diverse chemistries with drug functions.
Figure 6.

Examples of correctly predicted multiclass molecules. (A) Hypocrellin is classified as anti-infective, antineoplastic, and dermatologic. (B) Sulfasalazine is classified as anti-infective, anti-inflammatory, and gastrointestinal. (C) Acemannan is classified as anti-infective, antineoplastic, and gastrointestinal.
Multilabel predictions were also evaluated globally with network relationship analysis. True and predicted pairwise drug class memberships were used to generate class connections for drug class networks (Figure 7). Most of the true relationships were recovered in the predicted relationships, but the model underestimated the strength of some relationships in the first validation fold (e.g., hematologic-cardio). The model also predicted that some new connections were missing from the true network, such as between the “respiratory” class and “urological” class. This global network analysis enabled a closer look at new connections between classes in the predicted set that were absent in the true class labels. For example, PubChem CID 121878 is classified as a cardiovascular drug, but the multiclass model predicts that this drug also functions on the respiratory system. PubChem suggests that this molecule is chemically related to cromakalim (Figure S6), which is a potassium channel modulating vasodilator known to act as a brochodilator.62
Figure 7.
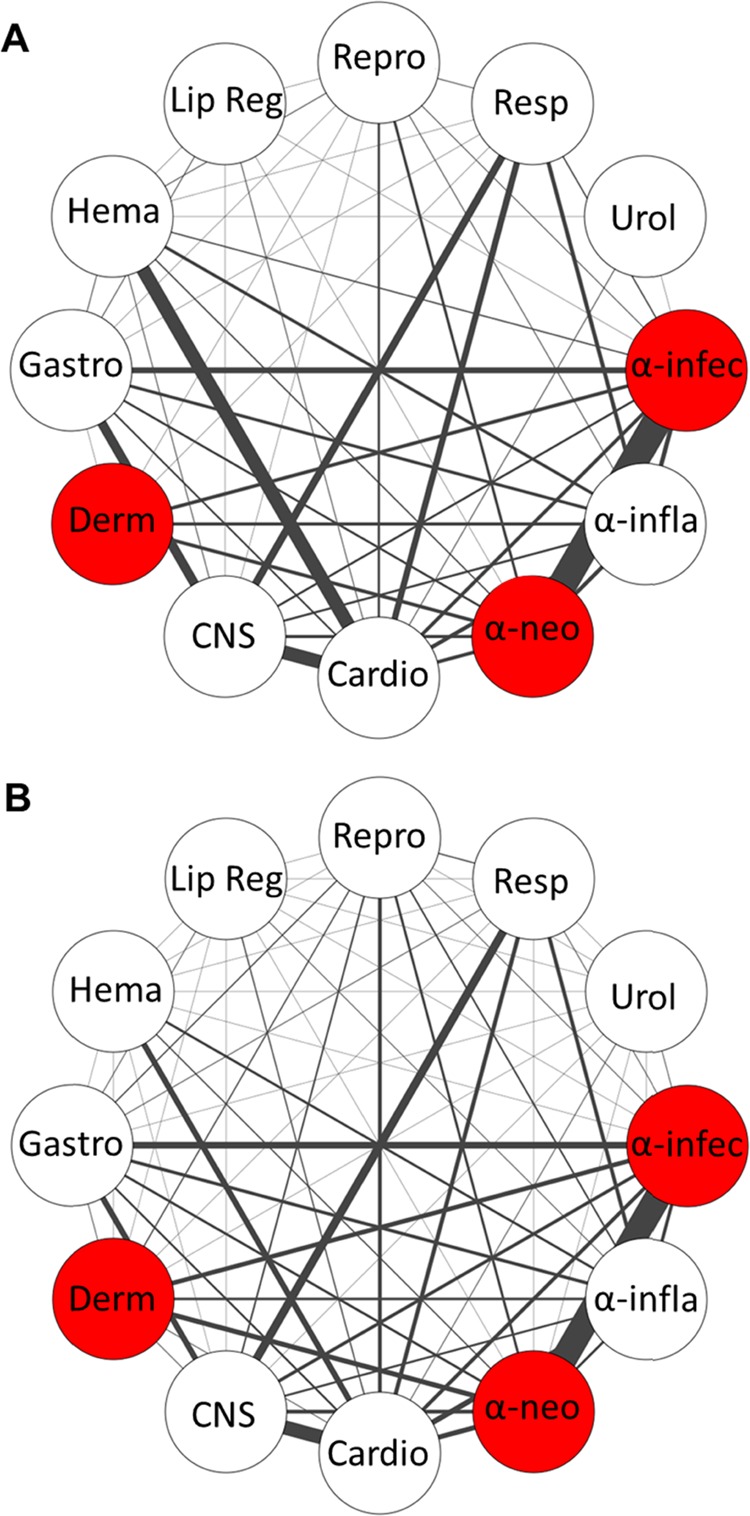
Analysis of multilabel drug classification using the IMG + CNN model. A network of relationships was computed from the (A) true class labels or (B) predicted class labels of the first validation fold. The width of each edge denotes the strength or frequency of co-occurrence. Red nodes indicate class grouping determined by their co-occurrence.
Other examples are less obvious based on expert interpretation of the chemical structure. For example, model predictions on validation fold 5 suggest a weak connection between “reproductive control” and “hematologic” classes (Figure S7B) that is absent from the true class labels (Figure S7A). Closer inspection of the class predictions reveals that this was due to prediction of menadione (vitamin K3) as “reproductive control” in addition to its true label of hematologic. Although there is no obvious structural similarity between menadione (Figure S7C) and common reproductive control agents like estrogen (Figure S7D), a literature search reveals several connections that validate this prediction. Menadione is believed to activate extracellular signal-regulated kinases (ERK) and prevent inhibition of EGFR.63 Estrogen, a reproductive control agent, also activates ERK signaling through transactivation of upstream EGFR.64 In addition, both excess vitamin K and estrogen alter the risk of venous thrombosis.65,66 Thus, the model has uncovered a functional relationship that is not apparent from a comparison of these two molecular structures. Altogether, these global analyses of drug function relationships helped reveal opportunities for drug repurposing.
Discussion
Here, we report two drug classification models that greatly exceed a previous benchmark on the same prediction task. Our models use molecular structures directly as inputs, whereas the previous study used alterations of the transcriptome as a proxy for molecules. The results presented here suggest that the experimental measurement of the influence of a molecule in biological systems may not be needed to accurately predict some types of chemical properties, such as annotated drug classes. However, we do not believe this necessarily means that direct empirical measure of the system is useless. Rather, additional research is required to determine which types of chemical prediction tasks require information about the biological state induced by chemicals and what type of biological state information is most useful (e.g., omic data, cellular morphology, etc.). There is likely room to improve effect-based models that would outperform molecular-structure-derived models, especially on more complex prediction tasks.
Because the models presented here do not require empirical measurements of effects of chemicals, they can be broadly applied to predict drug classes after training; images and MFPs can be generated directly from the chemical structure for any chemical. A major limitation of the Aliper et al. featurization, or any empirically determined featurization, is that it requires new experiments for each new compound. This restricted the total data set of Aliper et al. to only 676 drugs for which transcriptomic data was available, thereby fundamentally limiting the utility of prediction to fewer compounds. Therefore, there must be a substantial improvement in predictive performance to justify the extra cost of using experimentally derived features in a virtual screening or chemical prediction setting. We propose that future studies on chemical prediction tasks that use empirically determined featurizations also use models that consider only chemical structure features as a baseline.
Although there are several chemistry problems where DNNs outperform other shallow machine-learning methods,49,67,68 here the MFP + RF performed best with the small data set of 676 molecules in the 5- and 12-class predictions. However, in the 3-class task with the small data set and all of the tasks with the large data set, the two models produced accuracies that were nearly indistinguishable. Because the performance of our two models was similar on the larger data set, our results suggest that the CNN has more difficulty learning many classes from a small amount of data. This highlights that, in general, more complex models should be benchmarked against strong standard machine-learning methods, especially when training data is limited.
Much can be learned about chemical function from the cases where we find misclassification of chemical structures. We show cases where this can be rationalized by chemical properties of the molecules and cases where these properties that we often use to define the character of a chemical cannot explain the classification performance. In the latter case, this may mean that our models have learned something about chemistry that may not be recognized by chemists. Still, the class-specific differences in molecular properties are interesting to compare. Furthermore, when the models misclassify a structure, we can interpret this both as suggestive of a shared drug mechanism and as an opportunity for drug repurposing. Drug repurposing is an especially important aspect of this work because the application of an already approved drug is much less costly than de novo approval of a new chemical.
Finally, we show how these models can be used for multilabel classification of drugs with multiple known functions and explore how incorrect predictions from multilabel classification can be used for drug repurposing. Our initial experiments followed the setting from Aliper et al. that excluded chemicals with multiple therapeutic uses, but we also extend the concept to a multilabel prediction model. The results show that our strategy is effective for the more complex multiclass prediction and that true relationships between drug classes are learned and recovered even with a relatively small data set of less than 10 000 molecules. We give examples of how these models learn to associate diverse chemistries with the same predicted function. In addition, we give examples where the literature supports misclassification, suggesting that these models may be useful in predicting off-target effects and repurposing opportunities. Taken together, our multilabel classification results prove the feasibility of this strategy with relatively simple modern deep-learning packages.
Previous studies have demonstrated prediction of other types of drug classifications, for example, anatomical therapeutic chemical (ATC) codes (https://www.whocc.no/atc/structure_and_principles/).69−72 Several types of models and chemical featurizations have been explored for ATC code prediction. Future work could apply the strategies described here for MeSH terms to predict ATC codes.
Acknowledgments
We thank Dr. Amanda Momenzadeh for help with clinical interpretation of the drug misclassification results. This work was supported by grants from the NIH NIGMS (P41 GM108538 and R35 GM118110 to J.J.C.). J.G.M. was supported by an NIH T15 fellowship (T15 LM007359). S.L. was supported by the University of Wisconsin-Madison Office of the Vice Chancellor for Research and Graduate Education with funding from the Wisconsin Alumni Research Foundation. This research was performed using the computational resources and assistance of the UW-Madison Center for High Throughput Computing in the Department of Computer Sciences.
Supporting Information Available
The Supporting Information is available free of charge on the ACS Publications website at DOI: 10.1021/acs.jcim.9b00236.
Example of the cosine annealing learning rate strategy; ChemTreeMap; receiver operator characteristic plots from the random forest models; confusion matrices from MFP + RF classification; distributions and correlations of molecule properties; structures of the molecule with PubChem CID 121878 and cromakalim; network analysis of pairwise class relationships from multiclass predictions (Figures S1–S7) (PDF)
Nested cross validation results from the hyperparameter search for the IMG + CNN using the 12-class 676 molecule dataset (XLSX)
Filtered set of molecules and their computed druglike properties (XLSX)
Proportion of molecules used for drug property calculation in each class with Xlog P values available (XLSX)
Adjusted p-values from the Games-Howell posthoc test comparing drug properties for each class with one-way ANOVA (XLSX)
Author Contributions
Conceptualization, J.G.M. and A.G. Methodology, J.G.M., S.L., and A.G. Software, J.G.M., S.L., I.J.M., and A.G. Validation, J.G.M. and S.L. Formal analysis, J.G.M., S.L., and I.J.M. Investigation, J.G.M., S.L., and I.J.M. Resources, J.J.C. and A.G. Data curation, J.G.M. Writing: original draft, J.G.M. Writing: review and editing, J.G.M. and A.G. Visualization, J.G.M., S.L., and I.J.M. Supervision, J.G.M., J.J.C., and A.G. Project administration, J.G.M. and A.G. Funding acquisition, J.G.M., J.J.C., and A.G.
The authors declare no competing financial interest.
Supplementary Material
References
- Lipinski C.; Hopkins A. Navigating chemical space for biology and medicine. Nature 2004, 432, 855. 10.1038/nature03193. [DOI] [PubMed] [Google Scholar]
- Ruddigkeit L.; van Deursen R.; Blum L. C.; Reymond J.-L. Enumeration of 166 Billion Organic Small Molecules in the Chemical Universe Database GDB-17. J. Chem. Inf. Model. 2012, 52, 2864–2875. 10.1021/ci300415d. [DOI] [PubMed] [Google Scholar]
- Lipinski C. A.; Lombardo F.; Dominy B. W.; Feeney P. J. Experimental and computational approaches to estimate solubility and permeability in drug discovery and development settings. Adv. Drug Delivery Rev. 2001, 46, 3–26. 10.1016/S0169-409X(00)00129-0. [DOI] [PubMed] [Google Scholar]
- Polishchuk P. G.; Madzhidov T. I.; Varnek A. Estimation of the size of drug-like chemical space based on GDB-17 data. J. Comput.-Aided Mol. Des. 2013, 27, 675–679. 10.1007/s10822-013-9672-4. [DOI] [PubMed] [Google Scholar]
- Goh G. B.; Hodas N. O.; Vishnu A. Deep learning for computational chemistry. J. Comput. Chem. 2017, 38, 1291–1307. 10.1002/jcc.24764. [DOI] [PubMed] [Google Scholar]
- Chen H.; Engkvist O.; Wang Y.; Olivecrona M.; Blaschke T. The rise of deep learning in drug discovery. Drug Discovery Today 2018, 23, 1241–1250. 10.1016/j.drudis.2018.01.039. [DOI] [PubMed] [Google Scholar]
- LeCun Y.; Bengio Y.; Hinton G. Deep learning. Nature 2015, 521, 436. 10.1038/nature14539. [DOI] [PubMed] [Google Scholar]
- Gómez-Bombarelli R.; Wei J. N.; Duvenaud D.; Hernández-Lobato J. M.; Sánchez-Lengeling B.; Sheberla D.; Aguilera-Iparraguirre J.; Hirzel T. D.; Adams R. P.; Aspuru-Guzik A. Automatic Chemical Design Using a Data-Driven Continuous Representation of Molecules. ACS Cent. Sci. 2018, 4, 268–276. 10.1021/acscentsci.7b00572. [DOI] [PMC free article] [PubMed] [Google Scholar]
- Sanchez-Lengeling B.; Aspuru-Guzik A. Inverse molecular design using machine learning: Generative models for matter engineering. Science 2018, 361, 360. 10.1126/science.aat2663. [DOI] [PubMed] [Google Scholar]
- Winter R.; Montanari F.; Noé F.; Clevert D.-A. Learning continuous and data-driven molecular descriptors by translating equivalent chemical representations. Chem. Sci. 2019, 10, 1692–1701. 10.1039/C8SC04175J. [DOI] [PMC free article] [PubMed] [Google Scholar]
- Popova M.; Isayev O.; Tropsha A. Deep reinforcement learning for de novo drug design. Sci. Adv. 2018, 4, eaap7885 10.1126/sciadv.aap7885. [DOI] [PMC free article] [PubMed] [Google Scholar]
- Wu Z.; Ramsundar B.; Feinberg E. N.; Gomes J.; Geniesse C.; Pappu A. S.; Leswing K.; Pande V. MoleculeNet: a benchmark for molecular machine learning. Chem. Sci. 2018, 9, 513–530. 10.1039/C7SC02664A. [DOI] [PMC free article] [PubMed] [Google Scholar]
- Mendez-Lucio O.; Baillif B.; Clevert D.-A.; Rouquié D.; Wichard J. De Novo Generation of Hit-like Molecules from Gene Expression Signatures Using Artificial Intelligence. ChemRxiv 2018, 10.26434/chemrxiv.7294388.v1. [DOI] [PMC free article] [PubMed] [Google Scholar]
- Weininger D. SMILES, a chemical language and information system. 1. Introduction to methodology and encoding rules. J. Chem. Inf. Model. 1988, 28, 31–36. 10.1021/ci00057a005. [DOI] [Google Scholar]
- Weininger D.; Weininger A.; Weininger J. L. SMILES. 2. Algorithm for generation of unique SMILES notation. J. Chem. Inf. Model. 1989, 29, 97–101. 10.1021/ci00062a008. [DOI] [Google Scholar]
- Weininger D. SMILES. 3. DEPICT. Graphical depiction of chemical structures. J. Chem. Inf. Model. 1990, 30, 237–243. 10.1021/ci00067a005. [DOI] [Google Scholar]
- Xu Y.; Pei J.; Lai L. Deep Learning Based Regression and Multiclass Models for Acute Oral Toxicity Prediction with Automatic Chemical Feature Extraction. J. Chem. Inf. Model. 2017, 57, 2672–2685. 10.1021/acs.jcim.7b00244. [DOI] [PubMed] [Google Scholar]
- Jin W.; Barzilay R.; Jaakkola T.. Junction Tree Variational Autoencoder for Molecular Graph Generation. 2018, arXiv:1802.04364. arXiv.org e-Print archive. https://arxiv.org/abs/1802.04364.
- Liu K.; Sun X.; Jia L.; Ma J.; Xing H.; Wu J.; Gao H.; Sun Y.; Boulnois F.; Fan J.. Chemi-net: A Graph Convolutional Network for Accurate Drug Property Prediction. 2018, arXiv:1803.06236. arXiv.org e-Print archive. https://arxiv.org/abs/1803.06236. [DOI] [PMC free article] [PubMed]
- Russakovsky O.; Deng J.; Su H.; Krause J.; Satheesh S.; Ma S.; Huang Z.; Karpathy A.; Khosla A.; Bernstein M.; Berg A. C.; Fei-Fei L.. ImageNet Large Scale Visual Recognition Challenge. 2014, arXiv:1409.0575. arXiv.org e-Print archive. https://arxiv.org/abs/1409.0575.
- Brown A. L.; Kane M. J. Preschool children can learn to transfer: Learning to learn and learning from example. Cognit. Psychol. 1988, 20, 493–523. 10.1016/0010-0285(88)90014-X. [DOI] [PubMed] [Google Scholar]
- Hoo-Chang S.; Roth H. R.; Gao M.; Lu L.; Xu Z.; Nogues I.; Yao J.; Mollura D.; Summers R. M. Deep convolutional neural networks for computer-aided detection: CNN architectures, dataset characteristics and transfer learning. IEEE Trans. Med. Imaging 2016, 35, 1285. 10.1109/TMI.2016.2528162. [DOI] [PMC free article] [PubMed] [Google Scholar]
- Ching T.; Himmelstein D. S.; Beaulieu-Jones B. K.; Kalinin A. A.; Do B. T.; Way G. P.; Ferrero E.; Agapow P.-M.; Zietz M.; Hoffman M. M.; Xie W.; Rosen G. L.; Lengerich B. J.; Israeli J.; Lanchantin J.; Woloszynek S.; Carpenter A. E.; Shrikumar A.; Xu J.; Cofer E. M.; Lavender C. A.; Turaga S. C.; Alexandari A. M.; Lu Z.; Harris D. J.; DeCaprio D.; Qi Y.; Kundaje A.; Peng Y.; Wiley L. K.; Segler M. H. S.; Boca S. M.; Swamidass S. J.; Huang A.; Gitter A.; Greene C. S. Opportunities and obstacles for deep learning in biology and medicine. J. R. Soc. Interface 2018, 15, 20170387 10.1098/rsif.2017.0387. [DOI] [PMC free article] [PubMed] [Google Scholar]
- Cheng P. M.; Malhi H. S. Transfer Learning with Convolutional Neural Networks for Classification of Abdominal Ultrasound Images. J. Digital Imaging 2017, 30, 234–243. 10.1007/s10278-016-9929-2. [DOI] [PMC free article] [PubMed] [Google Scholar]
- Lima E.; Sun X.; Dong J.; Wang H.; Yang Y.; Liu L. Learning and Transferring Convolutional Neural Network Knowledge to Ocean Front Recognition. IEEE Geosci. Remote Sens. Lett. 2017, 14, 354–358. 10.1109/LGRS.2016.2643000. [DOI] [Google Scholar]
- Nguyen L. D.; Lin D.; Lin Z.; Cao J.. Deep CNNs for Microscopic Image Classification by Exploiting Transfer Learning and Feature Concatenation, 2018 IEEE International Symposium on Circuits and Systems (ISCAS), 2018; pp 1–5.
- Fernandez M.; Ban F.; Woo G.; Hsing M.; Yamazaki T.; LeBlanc E.; Rennie P. S.; Welch W. J.; Cherkasov A. Toxic Colors: The Use of Deep Learning for Predicting Toxicity of Compounds Merely from Their Graphic Images. J. Chem. Inf. Model. 2018, 58, 1533–1543. 10.1021/acs.jcim.8b00338. [DOI] [PubMed] [Google Scholar]
- Andersen M. E.; Krewski D. Toxicity Testing in the 21st Century: Bringing the Vision to Life. Toxicol. Sci. 2009, 107, 324–330. 10.1093/toxsci/kfn255. [DOI] [PubMed] [Google Scholar]
- Goh G. B.; Siegel C.; Vishnu A.; Hodas N. O.; Baker N.. Chemception: A Deep Neural Network with Minimal Chemistry Knowledge Matches the Performance of Expert-developed QSAR/QSPR Models. 2017, arXiv:1706.06689. arXiv.org e-Print archive. https://arxiv.org/abs/1706.06689.
- Goh G. B.; Siegel C.; Vishnu A.; Hodas N.; Baker N.. How Much Chemistry Does a Deep Neural Network Need to Know to Make Accurate Predictions?, 2018 IEEE Winter Conference on Applications of Computer Vision (WACV), 2018; pp 1340–1349.
- Rifaioglu A. S.; Atalay V.; Martin M. J.; Cetin-Atalay R.; Dogan T. DEEPScreen: High Performance Drug-Target Interaction Prediction with Convolutional Neural Networks Using 2-D Structural Compound Representations. bioRxiv 2018, 10.1101/491365. [DOI] [PMC free article] [PubMed] [Google Scholar]
- Gerwick W. H. The Face of a Molecule. J. Nat. Prod. 2017, 80, 2583–2588. 10.1021/acs.jnatprod.7b00624. [DOI] [PubMed] [Google Scholar]
- Zhang C.; Idelbayev Y.; Roberts N.; Tao Y.; Nannapaneni Y.; Duggan B. M.; Min J.; Lin E. C.; Gerwick E. C.; Cottrell G. W.; Gerwick W. H. Small Molecule Accurate Recognition Technology (SMART) to Enhance Natural Products Research. Sci. Rep. 2017, 7, 14243 10.1038/s41598-017-13923-x. [DOI] [PMC free article] [PubMed] [Google Scholar]
- Aliper A.; Plis S.; Artemov A.; Ulloa A.; Mamoshina P.; Zhavoronkov A. Deep Learning Applications for Predicting Pharmacological Properties of Drugs and Drug Repurposing Using Transcriptomic Data. Mol. Pharmaceutics 2016, 13, 2524–2530. 10.1021/acs.molpharmaceut.6b00248. [DOI] [PMC free article] [PubMed] [Google Scholar]
- Simm J.; Klambauer G.; Arany A.; Steijaert M.; Wegner J. K.; Gustin E.; Chupakhin V.; Chong Y. T.; Vialard J.; Buijnsters P.; Velter I.; Vapirev A.; Singh S.; Carpenter A. E.; Wuyts R.; Hochreiter S.; Moreau Y.; Ceulemans H. Repurposing High-Throughput Image Assays Enables Biological Activity Prediction for Drug Discovery. Cell Chem. Biol. 2018, 25, 611.e3–618.e3. 10.1016/j.chembiol.2018.01.015. [DOI] [PMC free article] [PubMed] [Google Scholar]
- Lowe H. J. Understanding and Using the Medical Subject Headings (MeSH) Vocabulary to Perform Literature Searches. JAMA, J. Am. Med. Assoc. 1994, 271, 1103. 10.1001/jama.1994.03510380059038. [DOI] [PubMed] [Google Scholar]
- Subramanian A.; Narayan R.; Corsello S. M.; Peck D. D.; Natoli T. E.; Lu X.; Gould J.; Davis J. F.; Tubelli A. A.; Asiedu J. K.; Lahr D. L.; Hirschman J. E.; Liu Z.; Donahue M.; Julian B.; Khan M.; Wadden D.; Smith I. C.; Lam D.; Liberzon A.; Toder C.; Bagul M.; Orzechowski M.; Enache O. M.; Piccioni F.; Johnson S. A.; Lyons N. J.; Berger A. H.; Shamji A. F.; Brooks A. N.; Vrcic A.; Flynn C.; Rosains J.; Takeda D. Y.; Hu R.; Davison D.; Lamb J.; Ardlie K.; Hogstrom L.; Greenside P.; Gray N. S.; Clemons P. A.; Silver S.; Wu X.; Zhao W.-N.; Read-Button W.; Wu X.; Haggarty S. J.; Ronco L. V.; Boehm J. S.; Schreiber S. L.; Doench J. G.; Bittker J. A.; Root D. E.; Wong B.; Golub T. R. A Next Generation Connectivity Map: L1000 Platform and the First 1,000,000 Profiles. Cell 2017, 171, 1437.e17–1452.e17. 10.1016/j.cell.2017.10.049. [DOI] [PMC free article] [PubMed] [Google Scholar]
- Rogers D.; Hahn M. Extended-Connectivity Fingerprints. J. Chem. Inf. Model. 2010, 50, 742–754. 10.1021/ci100050t. [DOI] [PubMed] [Google Scholar]
- Breiman L. Random Forests. Mach. Learn. 2001, 45, 5–32. 10.1023/A:1010933404324. [DOI] [Google Scholar]
- Liu S.; Alnammi M.; Ericksen S. S.; Voter A. F.; Ananiev G. E.; Keck J. L.; Hoffmann F. M.; Wildman S. A.; Gitter A. Practical Model Selection for Prospective Virtual Screening. J. Chem. Inf. Model. 2019, 59, 282–293. 10.1021/acs.jcim.8b00363. [DOI] [PMC free article] [PubMed] [Google Scholar]
- Kim S.; Thiessen P. A.; Bolton E. E.; Chen J.; Fu G.; Gindulyte A.; Han L.; He J.; He S.; Shoemaker B. A.; Wang J.; Yu B.; Zhang J.; Bryant S. H. PubChem Substance and Compound databases. Nucleic Acids Res. 2016, 44, D1202–D1213. 10.1093/nar/gkv951. [DOI] [PMC free article] [PubMed] [Google Scholar]
- Landrum G.RDKit: Open-Source Cheminformatics Software, 2016.
- Xie S.; Girshick R.; Dollár P.; Tu Z.; He K.. Aggregated Residual Transformations for Deep Neural Networks. 2016, arXiv:1611.05431. arXiv.org e-Print archive. https://arxiv.org/abs/1611.05431.
- Paszke A.; Gross S.; Chintala S.; Chanan G.; Yang E.; DeVito Z.; Lin Z.; Desmaison A.; Antiga L.; Lerer A.. Automatic Differentiation in PyTorch, NIPS 2017 Workshop Autodiff, 2017.
- Smith L. N.Cyclical Learning Rates for Training Neural Networks. 2015, arXiv:1506.01186. arXiv.org e-Print archive. https://arxiv.org/abs/1506.01186.
- Liu S.; Chandereng T.; Liang Y.. N-Gram Graph, A Novel Molecule Representation. 2018, arXiv:1806.09206. arXiv.org e-Print archive. https://arxiv.org/abs/1806.09206.
- Altae-Tran H.; Ramsundar B.; Pappu A. S.; Pande V. Low Data Drug Discovery with One-Shot Learning. ACS Cent. Sci. 2017, 3, 283–293. 10.1021/acscentsci.6b00367. [DOI] [PMC free article] [PubMed] [Google Scholar]
- Svetnik V.; Liaw A.; Tong C.; Culberson J. C.; Sheridan R. P.; Feuston B. P. Random Forest: A Classification and Regression Tool for Compound Classification and QSAR Modeling. J. Chem. Inf. Comput. Sci. 2003, 43, 1947–1958. 10.1021/ci034160g. [DOI] [PubMed] [Google Scholar]
- Ramsundar B.; Liu B.; Wu Z.; Verras A.; Tudor M.; Sheridan R. P.; Pande V. Is Multitask Deep Learning Practical for Pharma?. J. Chem. Inf. Model. 2017, 57, 2068–2076. 10.1021/acs.jcim.7b00146. [DOI] [PubMed] [Google Scholar]
- Kearnes S.; McCloskey K.; Berndl M.; Pande V.; Riley P. Molecular Graph Convolutions: Moving Beyond Fingerprints. J. Comput.-Aided Mol. Des. 2016, 30, 595–608. 10.1007/s10822-016-9938-8. [DOI] [PMC free article] [PubMed] [Google Scholar]
- Pedregosa F.; Varoquaux G.; Gramfort A.; Michel V.; Thirion B.; Grisel O.; Blondel M.; Prettenhofer P.; Weiss R.; Dubourg V. Scikit-learn: Machine learning in Python. J. Mach. Learn. Res. 2011, 12, 2825–2830. [Google Scholar]
- Wang R.; Fu Y.; Lai L. A New Atom-Additive Method for Calculating Partition Coefficients. J. Chem. Inf. Comput. Sci. 1997, 37, 615–621. 10.1021/ci960169p. [DOI] [Google Scholar]
- Ruxton G. D.; Beauchamp G. Time for some a priori thinking about post hoc testing. Behav. Ecol. 2008, 19, 690–693. 10.1093/beheco/arn020. [DOI] [Google Scholar]
- Wallach I.; Heifets A. Most Ligand-Based Classification Benchmarks Reward Memorization Rather than Generalization. J. Chem. Inf. Model. 2018, 58, 916–932. 10.1021/acs.jcim.7b00403. [DOI] [PubMed] [Google Scholar]
- Lu J.; Carlson H. A. ChemTreeMap: an interactive map of biochemical similarity in molecular datasets. Bioinformatics 2016, btw523 10.1093/bioinformatics/btw523. [DOI] [PMC free article] [PubMed] [Google Scholar]
- Jaworska J.; Nikolova-Jeliazkova N.; Aldenberg T. QSAR Applicability Domain Estimation by Projection of the Training Set in Descriptor Space: A Review. Altern. Lab. Anim. 2005, 33, 445–459. 10.1177/026119290503300508. [DOI] [PubMed] [Google Scholar]
- Tetko I. V.; Sushko I.; Pandey A. K.; Zhu H.; Tropsha A.; Papa E.; Öberg T.; Todeschini R.; Fourches D.; Varnek A. Critical Assessment of QSAR Models of Environmental Toxicity against Tetrahymena pyriformis: Focusing on Applicability Domain and Overfitting by Variable Selection. J. Chem. Inf. Model. 2008, 48, 1733–1746. 10.1021/ci800151m. [DOI] [PubMed] [Google Scholar]
- Szymański P.; Kajdanowicz T.. A Scikit-Based Python Environment for Performing Multi-label Classification. 2017, arXiv:1702.01460. arXiv.org e-Print archive. https://arxiv.org/abs/1702.01460..
- Smith L. N.A Disciplined Approach to Neural Network Hyper-parameters: Part 1 -- Learning Rate, Batch Size, Momentum, and Weight Decay. 2018, arXiv:1803.0982. arXiv.org e-Print archive. https://arxiv.org/abs/1803.09820.
- Biastre K.; Burnakis T. Trospium Chloride Treatment of Overactive Bladder. Ann. Pharmacother. 2009, 43, 283–295. 10.1345/aph.1L160. [DOI] [PubMed] [Google Scholar]
- Gelenberg A. J.; Van Putten T.; Lavori P. W.; Wojcik J. D.; Falk W. E.; Marder S.; Galvin-Nadeau M.; Spring B.; Mohs R. C.; Brotman A. W. Anticholinergic effects on memory: benztropine versus amantadine. J. Clin. Psychopharmacol. 1989, 9, 180–185. 10.1097/00004714-198906000-00004. [DOI] [PubMed] [Google Scholar]
- Arch J. R. S.; Buckle D. R.; Bumstead J.; Clarke G. D.; Taylor J. F.; Taylor S. G. Evaluation of the potassium channel activator cromakalim (BRL 34915) as a bronchodilator in the guinea-pig: comparison with nifedipine. Br. J. Pharmacol. 1988, 95, 763–770. 10.1111/j.1476-5381.1988.tb11702.x. [DOI] [PMC free article] [PubMed] [Google Scholar]
- Abdelmohsen K.; Gerber P. A.; von Montfort C.; Sies H.; Klotz L.-O. Epidermal Growth Factor Receptor Is a Common Mediator of Quinone-induced Signaling Leading to Phosphorylation of Connexin-43: Role of Glutathione and Tyrosine Phosphatases. J. Biol. Chem. 2003, 278, 38360–38367. 10.1074/jbc.M306785200. [DOI] [PubMed] [Google Scholar]
- Filardo E. J.; Quinn J. A.; Bland K. I.; Frackelton A. R. Estrogen-Induced Activation of Erk-1 and Erk-2 Requires the G Protein-Coupled Receptor Homolog, GPR30, and Occurs via Trans-Activation of the Epidermal Growth Factor Receptor through Release of HB-EGF. Mol. Endocrinol. 2000, 14, 1649–1660. 10.1210/mend.14.10.0532. [DOI] [PubMed] [Google Scholar]
- Stephenson J. FDA Orders Estrogen Safety Warnings. JAMA, J. Am. Med. Assoc. 2003, 289, 537. 10.1001/jama.289.5.537. [DOI] [PubMed] [Google Scholar]
- Merli G. J.; Fink J. Vitamin K and Thrombosis. Vitam. Horm. 2008, 78, 265–279. 10.1016/S0083-6729(07)00013-1. [DOI] [PubMed] [Google Scholar]
- Korotcov A.; Tkachenko V.; Russo D. P.; Ekins S. Comparison of Deep Learning With Multiple Machine Learning Methods and Metrics Using Diverse Drug Discovery Data Sets. Mol. Pharmaceutics 2017, 14, 4462–4475. 10.1021/acs.molpharmaceut.7b00578. [DOI] [PMC free article] [PubMed] [Google Scholar]
- Lenselink E. B.; ten Dijke N.; Bongers B.; Papadatos G.; van Vlijmen H. W. T.; Kowalczyk W.; IJzerman A. P.; van Westen G. J. P. Beyond the hype: deep neural networks outperform established methods using a ChEMBL bioactivity benchmark set. J. Cheminf. 2017, 9, 45 10.1186/s13321-017-0232-0. [DOI] [PMC free article] [PubMed] [Google Scholar]
- Gurulingappa H.; Kolářik C.; Hofmann-Apitius M.; Fluck J. Concept-Based Semi-Automatic Classification of Drugs. J. Chem. Inf. Model. 2009, 49, 1986–1992. 10.1021/ci9000844. [DOI] [PubMed] [Google Scholar]
- Dunkel M.; Gunther S.; Ahmed J.; Wittig B.; Preissner R. SuperPred: drug classification and target prediction. Nucleic Acids Res. 2008, 36, W55–W59. 10.1093/nar/gkn307. [DOI] [PMC free article] [PubMed] [Google Scholar]
- Chen L.; Zeng W.-M.; Cai Y.-D.; Feng K.-Y.; Chou K.-C. Predicting Anatomical Therapeutic Chemical (ATC) Classification of Drugs by Integrating Chemical-Chemical Interactions and Similarities. PLoS One 2012, 7, e35254 10.1371/journal.pone.0035254. [DOI] [PMC free article] [PubMed] [Google Scholar]
- Lumini A.; Nanni L. Convolutional Neural Networks for ATC Classification. Curr. Pharm. Des. 2019, 24, 4007–4012. 10.2174/1381612824666181112113438. [DOI] [PubMed] [Google Scholar]
Associated Data
This section collects any data citations, data availability statements, or supplementary materials included in this article.