

Abstract
Introduction:
Excess sugar consumption has been linked with Alzheimer’s disease (AD) pathology in animal models.
Methods:
We examined the cross-sectional association of sugary beverage consumption with neuropsychological (N = 4276) and magnetic resonance imaging (N = 3846) markers of preclinical Alzheimer’s disease and vascular brain injury (VBI) in the community-based Framingham Heart Study. Intake of sugary beverages was estimated using a food frequency questionnaire.
Results:
Relative to consuming less than one sugary beverage per day, higher intake of sugary beverages was associated with lower total brain volume (1–2/day, β ± standard error [SE] = –0.55 ± 0.14 mean percent difference, P = .0002; >2/day, β ± SE = –0.68 ± 0.18, P < .0001), and poorer performance on tests of episodic memory (all P < .01). Daily fruit juice intake was associated with lower total brain volume, hippocampal volume, and poorer episodic memory (all P < .05). Sugary beverage intake was not associated with VBI in a consistent manner across outcomes.
Discussion:
Higher intake of sugary beverages was associated cross-sectionally with markers of pre-clinical AD.
Keywords: Sugar, Diet, Dementia, Alzheimer’s disease, Framingham Heart Study
1. Introduction
Sugar consumption is excessive in Western society [1], contributing to the burden of cardiometabolic disease [2,3]. Consumption of sugary beverages, including sugar-sweetened soft drinks, fruit drinks with added sugar, and 100% fruit juice, are major contributors to excess sugar intake [1]. Studies in animal models suggest that excess sugar intake, including from sugary beverages, leads to the development of Alzheimer’s disease (AD) pathology [4–7]. However, little is known about the long-term effect of sugary beverage intake on the human brain. Examining intake of sugary beverages provides a proxy for excess dietary intake of sugar. Using detailed neuropsychological assessments and brain magnetic resonance imaging (MRI), we examined the cross-sectional association between sugary beverage consumption and phenotypes of preclinical AD and vascular brain injury in the Framingham Heart Study (FHS)—a large, community-based, prospective cohort study from Massachusetts, USA. We hypothesized that higher consumption of sugary beverages would be associated with greater evidence of both subclinical vascular brain injury and preclinical AD.
2. Methods
The FHS commenced in 1948 with the aim to identify factors that contribute to cardiovascular disease [8]. At enrollment, the Original cohort comprised 5209 community-dwelling participants who did not yet have overt signs of cardiovascular disease. Surviving participants continue to be examined approximately every 2 years. In 1971, following a need to study younger adults, the children of the Original cohort and their spouses were invited to form the Offspring cohort [9]. The Offspring cohort enrolled 5124 participants who have been studied across nine quadrennial examination cycles. In 2002, a subset of the grandchildren of the Original cohort (the children of the Offspring cohort) was enrolled into the Third Generation cohort [10]. This cohort comprised 4095 participants at the initial examination and has now been studied twice, with a third examination cycle currently underway. All cohorts are observational with information collected on a wide variety of demographic, medical, and lifestyle indicators. Participants are also under constant surveillance for incident events such as myocardial infarction, stroke, and dementia. For the present study, we examined food frequency questionnaire (FFQ) data collected during examination cycle 7 (1998–2001) for the Offspring cohort and during examination cycle 2 (2008–2011) for the Third Generation cohort. We excluded persons with prevalent dementia, stroke, or other significant neurological disease, those younger than 30 years of age, and participants who reported improbably high or low total energy intakes, suggesting that they had not filled out the FFQ accurately. A comparison of participants included in analysis versus excluded because of prevalent stroke, dementia, or other neurological disease can be seen in Supplementary Table 1.
Participants underwent neuropsychological assessment and a brain MRI an average of 2 years (standard deviation [SD] = 1) from the examination cycle at which the FFQ was administered; most participants completed cognitive assessment and brain MRI on the same day (98%). The study flow diagram is presented in Fig. 1. There were 4276 and 3846 participants available for analysis of the neuropsychological and MRI outcomes, respectively. All participants provided written informed consent, and the study was approved by the institutional review board and Boston University Medical Center.
Fig. 1.
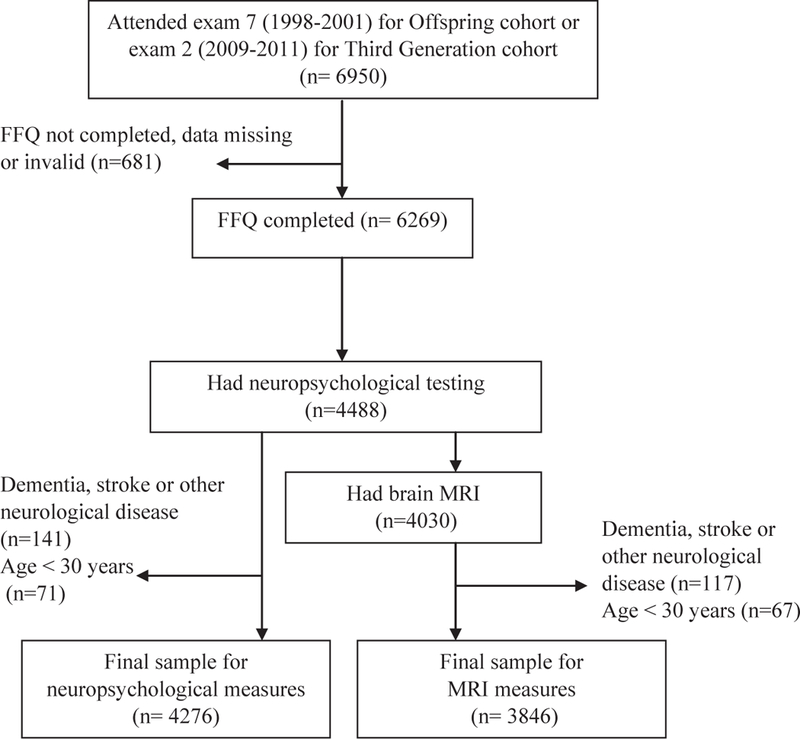
Study flow diagram. Abbreviations: FFQ, food frequency questionnaire; MRI, magnetic resonance imaging.
2.1. Assessment of sugary beverage intake
Participants completed the Harvard semiquantitative FFQ at examination 7 for the Offspring cohort and examination 2 for the Third Generation cohort. This FFQ is designed to measure dietary intake over the past year and has been validated extensively [11–13]. Participants were asked how often they consumed one glass, bottle, or can of each sugary beverage item, on average, across the previous year. Each item was scored according to nine responses spanning from “never or almost never” to “6 + per day.” Participants were presented with three items on sugar-sweetened soft drink (“Coke, Pepsi, or other cola with sugar,” “caffeine-free Coke, Pepsi, or other cola with sugar,” and “other carbonated beverages with sugar”), four items on fruit juice (“apple juice,” “orange juice,” “grapefruit juice,” and “other juice”), one item on sugar-sweetened fruit drinks and three items on diet soft drink (“low-calorie cola with caffeine,” “low-calorie caffeine-free cola,” and “other low-calorie beverages”).
We summed the individual items to create exposure variables reflecting intake of (I) total sugary beverages (excluding diet soft drinks), (II) fruit juice, (III) sugar-sweetened soft drinks (all sugary beverages excluding diet soft drink, fruit juice, and fruit drinks), and (IV) diet soft drinks. For each of the four exposure variables, participant responses were aggregated and new intake categories were created ensuring an adequate number of participants in each intake group for each variable. These new intake categories were based on the distribution of each variable. Total sugary beverage consumption was examined as a three-level variable: <1/day (reference), 1–2/day, and >2/day; fruit juice intake was categorized as a dichotomous variable: <1/day (reference) and ≥1/day. Sugar-sweetened soft drink intake was examined as a three-level variable: 0/week (reference), up to 3/week, and > 3/week. Diet soft drink was also examined as a three-level variable: 0/week (reference), up to 6/week, and ≥1/day. Intake of sugary beverages using the FFQ has been compared against dietary records, with correlation coefficients ranging from 0.84 for cola and 0.74 to 0.76 for fruit juice [14,15]. Moreover, intake of sugary beverages ascertained via the FFQ is reliable when measurements are repeated after 12 months, with correlation coefficients ranging from 0.85 for cola and 0.86 for fruit juice [14,15].
2.2. Structural brain MRI
Total brain volume and hippocampal volume are sensitive to early neurodegeneration [16] and were measured as markers of preclinical AD. Silent brain infarcts and white-matter hyperintensity volume (WMHV) are indicative of cerebral small vessel disease [17] and were measured as sub-clinical markers of vascular brain injury. For the Offspring study participants, we used a Siemens 1-Tesla or 1.5-Tesla field strength machine with a T2-weighted double spin-echo (DSE) coronal imaging sequence in contiguous slices of 4 mm. For the Third Generation participants, we used a 1.5-Tesla Siemens Avanto scanner with three-dimensional T1-weighted coronal spoiled gradient-recalled echo acquisition and fluid-attenuated inversion recovery (FLAIR) sequences. Total brain volume, hippocampal volume, and WMHV were calculated relative to total cranial volume to adjust for differences in head size. Given that intracranial volume signifies the largest brain size achieved during life, total brain volume provides an indicator of global brain atrophy. Hippocampal volume was calculated using a semiautomatic multiatlas segmentation algorithm [18]. The methods used to segment WMHV have been described previously [19]. We harmonized differences in WMHV between the DSE and FLAIR sequences by applying formulae developed from statistical modeling. WMHV was first expressed as a percent of total cranial volume and log transformed to normalize its distribution. The resulting variable, logWMHV-DSE, was converted to predicted FLAIR logWMHV using simple linear conversion models within 5-year age bins. Silent brain infarcts were counted manually in accordance with the STRIVE criteria [17]. Comprehensive details of the imaging methodology, including intrarater reliabilities, are published elsewhere [19–22]. Scans were read blinded to dietary intake scores.
2.3. Neuropsychological testing
Subtle deficits in episodic (verbal) memory can precede the clinical diagnosis of AD dementia by up to a decade [23] and are useful in identifying persons at the highest risk of developing clinical AD [24]. We examined episodic memory, using the tests of Logical Memory Immediate and Delayed from the Wechsler Memory Scales, as markers of preclinical AD. Based on our extensive past work relating vascular risk factors to cognitive function [25,26], we included tasks of Trail Making B minus A (processing speed and executive function), Similarities (verbal abstract reasoning) from the Wechsler Adult Intelligence Scale and Visual Reproductions Delayed (visual memory) from the Wechsler Memory Scales as markers of vascular cognitive impairment. Values of Trails B-A were natural logarithmically transformed to restore normality and then the mathematical sign was reversed, such that higher scores on all tasks indicate superior performance. All neuropsychological tests have adequate reliability and construct validity [27,28]. Further details of the neuropsychological protocol can be seen elsewhere [28].
2.4. Statistical analysis
Statistical models were estimated using SAS Software (SAS Institute, Cary, NC, USA). We used separate multivariable linear (for continuous measures) and logistic (for binary outcomes) regression models to examine the associations between the four dietary exposure variables and the MRI and neuropsychological outcomes. Missing data were excluded from analysis. All models included adjustments for age, sex, total caloric intake, and the time interval between completion of the FFQ and the measurement of the imaging/neuropsychological outcomes. All models involving the neuropsychological outcomes were further adjusted for education, whereas all models involving the MRI outcomes were further adjusted for age squared given that the association between age and brain volume is nonlinear [19]. A second statistical model included additional adjustments for systolic blood pressure, treatment of hypertension, current smoking status, prevalent cardiovascular disease, atrial fibrillation, left ventricular hypertrophy, total cholesterol, high-density lipoprotein cholesterol, prevalent diabetes mellitus, depressive symptoms (Center for Epidemiologic Studies Depression Scale scores ≥16) and waist-to-hip ratio. A third statistical model included the covariates outlined in model one plus intake of saturated fat, trans-fat, and dietary fiber and self-reported physical activity. We performed a sensitivity analysis by repeating statistical analyses (for model 1) after excluding persons with prevalent diabetes or cardiovascular disease. We also performed a sensitivity analysis by adjusting for fasting blood glucose levels in model 2 in place of diabetes status. To provide some clinical context to our results, we expressed some of our main findings in terms of years of brain aging. For this purpose, we regressed each outcome score on age and compared differences in means attributable to the different categories of sugary beverage intake. We considered results statistically significant if a two-sided P < .05.
3. Results
3.1. Cohort demographics
The clinical characteristics of our study sample are displayed in Table 1. Across the sample, the mean total caloric intake was 1942 calories (SD = 670) per day, which is similar to other US cohorts of comparable ages [29]. Total caloric intake and saturated fat, but not trans-fat, tended to be higher with increasing intake of sugary beverages. Total sugary beverages were consumed less than once per day, once to twice per day, and greater than twice per day by 2395 (56%), 1239 (29%), and 641 (15%) participants, respectively. Fruit juice was consumed one or more times per day by 1330 (31%) participants. Most participants reported consuming no sugar-sweetened soft drinks (n = 2326, 54%), with 1359 (32%) participants consuming sugar-sweetened soft drinks up to 3 times per week, and 588 (14%) participants consuming sugar-sweetened soft drinks greater than three times per week. Diet soft drinks were consumed more regularly than sugar-sweetened soft drinks, with 2081 (49%), 1495 (35%), and 698 (16%) participants consuming no diet soft drinks, up to six per week, and one or more per day, respectively. Supplementary Table 2 displays the unadjusted values of the outcome measures, stratified by total sugary beverage intake.
Table 1.
Characteristics of the larger study sample
| Total sugary beverage intake |
||||
|---|---|---|---|---|
| Variable | <1/day (n = 2395) | 1–2/day (n = 1239) | >2/day (n = 641) | Total (N = 4276)* |
| Clinical characteristics | ||||
| Age, years, mean (SD) | 53 (11) | 56 (12) | 54 (12) | 54 (11) |
| Male, n (%) | 936 (39) | 648 (52) | 380 (59) | 1965 (46) |
| Education, n (%) | ||||
| No high school degree | 41 (2) | 25 (2) | 10 (2) | 76 (2) |
| High school degree | 518 (22) | 262 (21) | 128 (20) | 908 (21) |
| Some college | 759 (32) | 365 (29) | 178 (28) | 1303 (31) |
| College graduate | 1073 (45) | 587 (47) | 325 (51) | 1985 (46) |
| Waist/hip ratio, mean (SD) | 0.9 (0.1) | 0.9 (0.1) | 0.9 (0.1) | 0.9 (0.1) |
| Systolic BP, mm Hg, mean (SD) | 120 (17) | 123 (18) | 122 (17) | 121 (17) |
| Hypertension treatment, n (%) | 594 (25) | 326 (26) | 143 (22) | 1063 (25) |
| Fasting blood glucose, mg/dL, mean (SD) | 100.0 (24.5) | 99.7 (20.7) | 98.1 (14.3) | 99.6 (22.2) |
| Total cholesterol, mg/dL, mean (SD) | 194.9 (37.5) | 193.6 (35.1) | 193.6 (38.0) | 194.3 (36.9) |
| HDL cholesterol, mg/dL, mean (SD) | 58.9 (18.1) | 54.9 (16.7) | 52.4 (15.5) | 56.8 (17.5) |
| Diabetes mellitus, n (%) | 218 (9) | 96 (8) | 28 (4) | 342 (8) |
| Atrial fibrillation, n (%) | 43 (2) | 41 (3) | 15 (2) | 99 (2) |
| Prevalent CVD, n (%) | 149 (6) | 92 (7) | 29 (5) | 270 (6) |
| Current smoker, n (%) | 257 (11) | 106 (9) | 71 (11) | 434 (10) |
| PAI, score, median (Q1, Q3) | 36 (32, 39) | 36 (33, 40) | 36 (33,41) | 37 (33, 40) |
| Depression†, n (%) | 204 (9) | 86 (7) | 70 (11) | 360 (8) |
| Dietary variables | ||||
| Total caloric intake, calories/day, mean | 1782 (594) | 2007 (626) | 2413 (767) | 1942 (670) |
| (SD) | ||||
| Saturated fat, g/day, mean (SD) | 22 (10) | 24 (11) | 27 (12) | 23 (11) |
| Trans-fat, g/day, mean (SD) | 3 (1) | 3 (2) | 3 (2) | 2 (1) |
| Dietary fiber, g/day, mean (SD) | 20 (10) | 21 (9) | 22 (9) | 20 (9) |
Abbreviations: SD, standard deviation; BP, blood pressure; CVD, cardiovascular disease; PAI, physical activity index; MRI, magnetic resonance imaging; CESD, Center for Epidemiologic Studies Depression Scale.
Table based on the larger (neuropsychological outcome) sample. MRI outcomes were reported on a subsample of this population (N = 3846) with comparable characteristics.
Defined as CESD scores ≥16.
3.2. Sugar-sweetened beverage consumption and markers of preclinical AD
Greater consumption of total sugary beverages was associated with lower total brain volume and lower scores on Logical Memory Immediate and Delayed Recall (Table 2). There was also a borderline statistically significant association between the highest intake of total sugary beverages and lower hippocampal volume. Adjusted least square means and standard errors are displayed in Fig. 2 (adjusted for model 1 covariates). Relative to no intake, the difference in total brain volume associated with consuming 1–2 or greater than 2 sugary beverages per day was equivalent to 1.6 and 2.0 years of brain aging, respectively. Relative to no intake, the difference in Logical Memory Delayed Recall scores associated with consuming 1–2 or greater than 2 sugary beverages per day was equivalent to 5.8 and 11.0 years of brain aging, respectively.
Table 2.
Sugary beverage intake and markers of preclinical AD
| Total brain volume, % | Hippocampal volume, % | Logical memory, n details recalled immediately | Logical memory, n details recalled after delay | ||||||
|---|---|---|---|---|---|---|---|---|---|
| Exposure | Model | β ± SE | P | β ± SE | P | β ± SE | P | β ± SE | P |
| Total sugary beverages | |||||||||
| <1/day(ref) | 1 | ||||||||
| 1–2/day | −0.55 ± 0.14 | .0002 | 0.00002 ± 0.002 | .99 | −0.41 ± 0.12 | .001 | −0.37 ± 0.12 | .003 | |
| >2/day | −0.68 ± 0.18 | <.0001 | −0.004 ± 0.002 | .06 | −0.67 ± 0.16 | <.0001 | −0.69 ± 0.16 | <.0001 | |
| <1/day (ref) | 2 | ||||||||
| 1–2/day | −0.53 ± 0.14 | .0002 | 0.0004 ± 0.002 | .82 | −0.37 ± 0.12 | .002 | −0.36 ± 0.13 | .005 | |
| >2/day | −0.69 ± 0.18 | .0002 | −0.004 ± 0.002 | .08 | −0.66 ± 0.16 | <.0001 | −0.69 ± 0.17 | <.0001 | |
| <1/day (ref) | 3 | ||||||||
| 1–2/day | −0.47 ± 0.14 | .001 | 0.00001 ± 0.002 | .96 | −0.38 ± 0.12 | .002 | −0.36 ± 0.12 | .005 | |
| >2/day | −0.43 ± 0.19 | .02 | −0.004 ± 0.002 | .11 | −0.59 ± 0.12 | .0004 | −0.61 ± 0.17 | .0004 | |
| Fruit Juice | |||||||||
| <1/day (ref) | 1 | ||||||||
| ≥1/day | −0.53 ± 0.13 | <.0001 | −0.004 ± 0.002 | .01 | −0.41 ± 0.11 | .0003 | −0.39 ± 0.12 | .001 | |
| <1/day (ref) | 2 | ||||||||
| ≥1/day | −0.57 ± 0.13 | <.0001 | −0.004 ± 0.002 | .03 | −0.40 ± 0.12 | .001 | −0.40 ± 0.12 | .001 | |
| <1/day (ref) | 3 | ||||||||
| ≥1/day | −0.57 ± 0.13 | <.0001 | −0.004 ± 0.002 | .02 | −0.35 ± 0.12 | .003 | −0.34 ± 0.12 | .006 | |
| Soft drink with sugar | |||||||||
| 0/week (ref) | 1 | ||||||||
| >0–3/week | −0.37 ± 0.13 | .01 | −0.002 ± 0.002 | .16 | −0.02 ± 0.12 | .84 | −0.02 ± 0.12 | .86 | |
| >3/week | −0.92 ± 0.19 | <.0001 | −0.003 ± 0.002 | .27 | −0.50 ± 0.16 | .002 | −0.32 ± 0.17 | .06 | |
| 0/week (ref) | 2 | ||||||||
| >0–3/week | −0.33 ± 0.14 | .02 | −0.002 ± 0.002 | .22 | −0.01 ± 0.12 | .93 | −0.01 ± 0.12 | .91 | |
| >3/week | −0.82 ± 0.19 | <.0001 | −0.003 ± 0.002 | .26 | −0.44 ± 0.17 | .01 | −0.28 ± 0.17 | .11 | |
| 0/week (ref) | 3 | ||||||||
| >0–3/week | −0.03 ± 0.13 | .82 | −0.001 ± 0.002 | .39 | 0.02 ± 0.12 | .87 | −0.004 ± 0.13 | .97 | |
| >3/week | −0.23 ± 0.19 | .24 | −0.002 ± 0.002 | .53 | −0.44 ± 0.17 | .01 | −0.28 ± 0.18 | .12 | |
Abbreviations: AD, Alzheimer’s disease; Ref, reference category; SE, standard error; CESD, Center for Epidemiologic Studies Depression Scale.
NOTE. Model 1 is adjusted for age, sex, time to outcome assessment, total caloric intake, as well as education (for neuropsychological outcomes) and age squared (for the MRI outcomes). Model 2 included additional adjustments for systolic BP, treatment for hypertension, current smoking status, history of cardiovascular disease, atrial fibrillation, left ventricular hypertrophy, total cholesterol, high-density lipoprotein cholesterol, diabetes mellitus, CESD scores ≥ 16 and waist-to-hip ratio. Model 3 included the covariates outlined in model one plus intake of saturated fat, intake of trans-fat, intake of dietary fiber, and the physical activity index. Samples sizes for the largest statistical model are as follows: total sugary beverages, 2395, 1239, and 641 for <1/day, 1–2/day and >2 per day respectively; fruit juice, 2944 and 1330 for <1/day and ≥1/day; soft drink with sugar, 2326, 1359 and 588 for 0/week, 0–3/week, and >3/week, respectively.
Fig. 2.
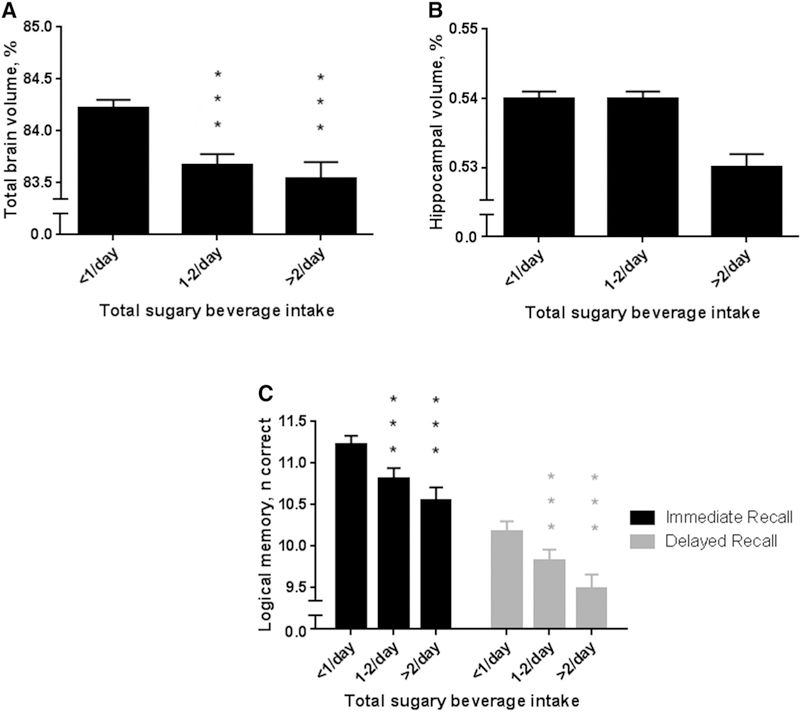
Association between total sugary beverage consumption and (A) total brain volume, (B) hippocampal volume, and (C) Logical Memory. Bars and whiskers represent adjusted least square means and standard error. Means are adjusted for model 1 covariates. Intake of <1/day serves as the reference group. ***P < .001.
One or more servings per day of fruit juice were associated with lower total brain volume, hippocampal volume, and poorer Immediate and Delayed Logical Memory scores. The difference in total brain volume and Logical Memory Delayed scores associated with daily fruit juice intake was equivalent to 1.5 and 3.5 years of brain aging, respectively. Relative to no intake, consuming more than three sugar-sweetened soft drinks per week was associated with lower total brain volume and lower Logical Memory Immediate scores, with differences equivalent to 2.6 (for total brain volume) and 13.0 (for Logical Memory Immediate) years of brain aging, when comparing the highest intake group to the reference group. However, the association between sugar-sweetened soft drinks and total brain volume was no longer significant after adjustment for other dietary factors and physical activity (model 3).
3.3. Consumption of sugary beverages and vascular brain injury
Consuming more than two sugary beverages per day or more than three sugary soft drinks per week was associated with greater WMHV in models 1 and 2 although not model 3 (Table 3). There was also a borderline statistically significant association between greater consumption of soft drinks with sugar and poorer performance on the test of similarities.
Table 3.
Sugary beverage intake and subclinical markers of vascular brain injury
| WMHV, % | Silent brain infarcts, n | Similarities, n correct | Trail Making, B-A score | Visual Reproductions, n correct after delay | |||||||
|---|---|---|---|---|---|---|---|---|---|---|---|
| Exposure | Model | β ± SE | P | OR (95% CI) | P | β ± SE | P | β ± SE | P | β ± SE | P |
| Total sugary beverages | |||||||||||
| <1/day(ref) | 1 | ||||||||||
| 1–2/day | 0.03 ± 0.03 | .32 | 1.18 (0.88, 1.59) | .53 | −0.14 ± 0.11 | .21 | −0.0003 ± 0.01 | .97 | −0.11 ± 0.10 | .27 | |
| >2/day | 0.08 ± 0.04 | .03 | 1.16 (0.78, 1.73) | .74 | −0.17 ± 0.15 | .25 | −0.01 ± 0.01 | .33 | −0.10 ± 0.13 | .45 | |
| <1/day (ref) | 2 | ||||||||||
| 1–2/day | 0.02 ± 0.03 | .41 | 1.19 (0.88, 1.83) | .57 | −0.13 ± 0.11 | .24 | −0.005 ± 0.01 | .52 | −0.13 ± 0.10 | .20 | |
| >2/day | 0.09 ± 0.04 | .03 | 1.22 (0.81, 1.83) | .61 | −0.21 ± 0.15 | .16 | −0.01 ± 0.01 | .36 | −0.16 ± 0.13 | .24 | |
| <1/day (ref) | 3 | ||||||||||
| 1–2/day | −0.03 ± 0.06 | .56 | 1.18 (0.87, 1.59) | .46 | −0.09 ± 0.11 | .42 | 0.002 ± 0.01 | .74 | −0.10 ± 0.11 | .33 | |
| >2/day | 0.02 ± 0.07 | .79 | 1.10 (0.72, 1.70) | .93 | −0.002 ± 0.16 | .99 | −0.004 ± 0.01 | .68 | −0.04 ± 0.14 | .76 | |
| Fruit juice | |||||||||||
| <1/day (ref) | 1 | ||||||||||
| ≥1/day | 0.04 ± 0.03 | .22 | 1.10 (0.83, 1.45) | .52 | −0.05 ± 0.11 | .62 | 0.002 ± 0.01 | .73 | −0.06 ± 0.10 | .51 | |
| <1/day (ref) | 2 | ||||||||||
| ≥1/day | 0.04 ± 0.03 | .18 | 1.12 (0.84, 1.50) | .44 | −0.07 ± 0.11 | .53 | 0.0001 ± 0.01 | .99 | −0.10 ± 0.10 | .32 | |
| <1/day (ref) | 3 | ||||||||||
| ≥1/day | −0.02 ± 0.06 | .66 | 1.09 (0.82, 1.45) | .57 | 0.01 ± 0.11 | .90 | 0.006 ± 0.01 | .39 | −0.02 ± 0.10 | .80 | |
| Soft drink with sugar | |||||||||||
| 0/week (ref) | 1 | ||||||||||
| >0–3/week | 0.001 ± 0.03 | .96 | 1.40 (1.02, 1.92) | .04 | −0.18 ± 0.11 | .09 | 0.001 ± 0.01 | .91 | 0.17 ± 0.10 | .08 | |
| >3/week | 0.12 ± 0.04 | .003 | 1.04 (0.74, 1.47) | .44 | −0.38 ± 0.15 | .01 | −0.01 ± 0.01 | .21 | −0.13 ± 0.14 | .35 | |
| 0/week (ref) | 2 | ||||||||||
| >0–3/week | −0.01 ± 0.03 | .81 | 1.36 (0.98, 1.89) | .05 | −0.22 ± 0.11 | .05 | −0.001 ± 0.01 | .88 | 0.14 ± 0.10 | .16 | |
| >3/week | 0.09 ± 0.04 | .02 | 1.01 (0.70, 1.44) | .38 | −0.41 ± 0.15 | .01 | −0.01 ± 0.01 | .24 | −0.16 ± 0.14 | .25 | |
| 0/week (ref) | 3 | ||||||||||
| >0–3/week | −0.03 ± 0.05 | .54 | 1.35 (0.98, 1.86) | .05 | −0.12 ± 0.11 | .26 | 0.004 ± 0.01 | .57 | 0.19 ± 0.10 | .06 | |
| >3/week | 0.13 ± 0.08 | .09 | 0.99 (0.69, 1.42) | .36 | −0.30 ± 0.16 | .06 | −0.01 ± 0.01 | .57 | −0.09 ± 0.14 | .54 | |
Abbreviations: Ref, reference category; SE, standard error; WMHV, white-matter hyperintensity volume; CESD, Center for Epidemiologic Studies Depression Scale.
NOTE. Model 1 is adjusted for age, sex, time to outcome assessment, total caloric intake, as well as education (for neuropsychological outcomes) and age squared (for the MRI outcomes). Model 2 included additional adjustments for systolic BP, treatment for hypertension, current smoking status, history of cardiovascular disease, atrial fibrillation, left ventricular hypertrophy, total cholesterol, high-density lipoprotein cholesterol, diabetes mellitus, CESD scores ≥16, and waist-to-hip ratio. Model 3 included the covariates outlined in model 1 plus intake of saturated fat, intake of trans-fat, intake of dietary fiber, and the physical activity index. Samples sizes for the largest statistical model are as follows: total sugary beverages, 2395, 1239, and 641 for <1/day, 1–2/day, and >2 per day, respectively; fruit juice, 2944 and 1330 for <1/day and ≥1/day; soft drink with sugar, 2326, 1359, and 588 for 0/week, 0–3/week, and >3/week, respectively.
3.4. Consumption of diet soft drink, preclinical AD, and vascular brain injury
Higher diet soft drink intake was associated with smaller total brain volume and poorer performance on the test of similarities (Supplementary Tables 3 and 4). There were no other associations between diet soft drink intake and the outcomes evaluated.
3.5. Sensitivity analysis
Excluding 540 persons from analyses of the neuropsychological outcomes and 463 persons from analyses of the MRI outcomes (due to prevalent diabetes or cardiovascular disease) did not change the observed pattern of results (data not shown). Adjusting for fasting blood glucose levels in place of prevalent diabetes status (in model 2) did not change the significance or direction of the reported results for any of the AD markers, with the exception that consuming more than two sugary beverages per day was associated with smaller hippocampal volume (β ± SE = 0.005 ± 0.002, P = .04). After adjustment for fasting blood glucose, consuming more than two sugary beverages per day was no longer associated with WMHV (β ± SE = 0.05 ± 0.07, P = .48).
4. Discussion
In our cross-sectional analysis of a large community-based sample, we observed that higher consumption of sugary beverages was associated with smaller total brain volume, poorer episodic memory, and smaller hippocampal volume (for higher fruit juice intake), a pattern of findings consistent with preclinical AD. These findings were striking given that they were evident in a middle-aged sample and were observed even after statistical adjustment for numerous confounding factors such as prevalent diabetes, total caloric intake, and physical activity. The magnitudes of the associations observed were the equivalent of 1.5–2.6 years of brain aging for total brain volume and 3.5–13 years of brain aging for episodic memory.
Excess sugary beverage intake is known to be associated with cardiovascular disease [2,3], which, in turn, is associated with vascular brain injury [30]. Although this suggests a possible link between sugary beverage consumption and vascular brain injury, we observed more striking associations between sugary beverage intake and markers of preclinical AD. These results add to a growing body of pre-clinical research suggesting that high sugar intake is associated with the correlates of AD in mice. Research using mice highly predisposed to developing AD pathology demonstrated that high sucrose intake increased Ab aggregation and tau phosphorylation via signaling of the mammalian target of rapamycin [4], a protein that regulates cell proliferation and survival as well as energy homeostasis. Similarly, a study using a transgenic mouse model of AD demonstrated that the long-term consumption of sucrose-sweetened water, relative to control water, led to poorer memory and a near three-fold increase in Ab aggregation [7]. Also in animal models, high fat refined sugar diets increase Aβ aggregation and tau phosphorylation [5], hippocampal atrophy [6], and reduce levels of brain-derived neurotrophic factor (BDNF) [6,31], a molecular correlate of preserved synaptic integrity, and improved neuronal survival [32], leading to impaired memory performance and reduced synaptic plasticity within the hippocampus [6,31]. Our previous work demonstrated that each SD increment in BDNF was associated with a 33% lower risk of AD dementia [33], suggesting that BDNF may partly mediate the association between high fat refined sugar diets and AD pathology.
In humans, the emerging pattern of results is consistent with the aforementioned preclinical work. In a sample of 737 middle-aged community-dwelling participants without diabetes, the Boston Puerto Rican Health Study reported that higher total sugar intake was cross-sectionally associated with an AD-like pattern of poorer verbal memory and phonemic fluency, whereas domains of cognition typically associated with vascular cognitive impairment, such as executive function and attention, were spared [34]. In a sample of 141 adults, impaired glucose tolerance and chronically elevated blood glucose levels were linked to poor memory, with results partially mediated by changes in hippocampal volume and microstructure [35]. By combining MRI and neuropsychological outcomes in a large, dementia-free community-dwelling cohort, our results provide further evidence that sugary beverage consumption is associated with markers of preclinical AD in humans. These findings are highly relevant given that AD is one of the largest growing disease burdens facing our aging population [36].
Excess consumption of sugar throughout the Western world has prompted action and debate from various Governments on how to lower sugar intake at the population level. In the United States, newly released dietary guidelines advise that adults should consume less than 10% of calories from added sugar [37]. In Britain, the Government recently announced a forthcoming sugar tax on soft drinks. According to the US National Nutrient Database, cola contains approximately 9 g of sugar/100 g, and unsweetened apple juice contains nearly 10 g of sugar/100 g [38]. Although soft drinks are not celebrated for their health benefits, fruit juices are often touted as a healthy alternative [39]. In one survey, the general public overestimated the sugar content of soft drinks but underestimated the sugar content of fruit juices by an average of 48% [40]. Even without added sugar, 100% fruit juice contains the fructose from multiple portions of fruit but with negligible fiber content. Worryingly, the average 100% fruit juice marketed to children contains more than a day recommended sugar allowance per 200 mL serving [39]. Our findings demonstrate that daily consumption of total sugary beverages and fruit juice were both linked to markers of preclinical AD. Diet soft drink was also associated with lower total brain volume. However, it is unclear whether the association between diet soft drinks and brain volume is mediated by concomitant higher intake of sugary beverages either at present or in the past.
The main strength of our study was the use of a large and well-characterized community-based sample free of clinical stroke and dementia. Limitations of our study include the observational and cross-sectional nature of the study, which precludes conclusions about causality and the temporal associations between sugary beverage intake, brain atrophy, and cognitive decline. Second, ethnic minorities were not well represented in our sample, limiting the generalizability of our results to nonwhite populations. Third, sugary beverage intake was quantified using a self-report FFQ, which may be subject to recall bias. However, sugary beverage intake estimated using our FFQ has been validated previously against dietary records [14,15]. Our FFQ also did not differentiate between fruit juice with and without added sugar, although both contain high amounts of fructose. Regarding the outcomes evaluated, we did not implement positron emission tomography to characterize the burden of Ab and tau pathology in the brain, which would help further clarify the association between sugary beverage intake and AD pathology. Finally, we did not adjust for multiple statistical testing, and we cannot rule out the possibility that some of the findings are due to chance.
In our cross-sectional observations in a large community-based sample, higher sugary beverage intake was associated with markers of preclinical AD, including brain atrophy and poorer episodic memory. Greater intake of total sugary beverages, fruit juice, and soft drinks were all associated with characteristics of preclinical AD. Additional studies are warranted to confirm our findings and evaluate if sugary beverages are associated longitudinally with worsening of subclinical AD measures and with incident AD.
Supplementary Material
RESEARCH IN CONTEXT.
Systematic review: We searched for relevant literature using online databases such as SCOPUS and PubMed. Although studies have investigated the associations of sugary beverage intake with cardiometabolic disease and stroke, the association of sugary beverage with subclinical brain injury and dementia remains little examined in humans.
Interpretation: Our findings indicate an association between higher sugary beverage intake and markers of preclinical Alzheimer’s disease, including lower brain volume and poorer memory.
Future directions: Prospective studies are needed to examine whether higher intake of sugary beverages leads to the progression of Alzheimer’s disease pathology and incident dementia.
Acknowledgments
The authors thank the Framingham Heart Study participants for their commitment and dedication. C.D. is a consultant to Novartis on a clinical trial of LCZ696 for heart failure. All other authors report no conflicts of interest. M.P.P. is funded by an Australian National Health and Medical Research Council Early Career Fellowship (APP1089698). The Framingham Heart Study is supported by the National Heart, Lung, and Blood Institute (contract no. N01-HC-25195 and no. HHSN268201500001I) and by grants from the National Institute on Aging (R01 AG054076, R01 AG049607, R01 AG033193, U01 AG049505, U01 AG052409) and the National Institute of Neurological Disorders and Stroke (NS017950 and UH2 NS100605). Funds from the USDA Agricultural Research Service Agreement No. 58–1950-4–003 supported in part the collection of dietary data for this project and the efforts of P.F.J. H.A. is supported by grants from the National Institute on Aging (T32-AG036697) and the American Heart Association (15GPSPG23770000).
Footnotes
Supplementary data
Supplementary data related to this article can be found at http://dx.doi.org/10.1016/joalz.2017.01.024.
References
- [1].Welsh JA, Sharma AJ, Grellinger L, Vos MB. Consumption of added sugars is decreasing in the United States. Am J Clin Nutr 2011; 94:726–34. [DOI] [PMC free article] [PubMed] [Google Scholar]
- [2].Dhingra R, Sullivan L, Jacques PF, Wang TJ, Fox CS, Meigs JB, et al. Soft drink consumption and risk of developing cardiometabolic risk factors and the metabolic syndrome in middle-aged adults in the community. Circulation 2007;116:480–8. [DOI] [PubMed] [Google Scholar]
- [3].Fung TT, Malik V, Rexrode KM, Manson JE, Willett WC, Hu FB. Sweetened beverage consumption and risk of coronary heart disease in women. Am J Clin Nutr 2009;89:1037–42. [DOI] [PMC free article] [PubMed] [Google Scholar]
- [4].Orr ME, Salinas A, Buffenstein R, Oddo S. Mammalian target of rapamycin hyperactivity mediates the detrimental effects of a high sucrose diet on Alzheimer’s disease pathology. Neurobiol Aging 2014; 35:1233–42. [DOI] [PMC free article] [PubMed] [Google Scholar]
- [5].Niu L, Han D, Xu RL, Han B, Zhou X, Wu HW, et al. A high-sugar high-fat diet induced metabolic syndrome shows some symptoms of Alzheimer’s disease in rats. J Nutr Health Aging 2016;20:509–13. [DOI] [PubMed] [Google Scholar]
- [6].Stranahan AM, Norman ED, Lee K, Cutler RG, Telljohann RS, Egan JM, et al. Diet-induced insulin resistance impairs hippocampal synaptic plasticity and cognition in middle-aged rats. Hippocampus 2008;18:1085–8. [DOI] [PMC free article] [PubMed] [Google Scholar]
- [7].Cao D, Lu H, Lewis TL, Li L. Intake of sucrose-sweetened water induces insulin resistance and exacerbates memory deficits and amyloidosis in a transgenic mouse model of Alzheimer disease. J Biol Chem 2007;282:36275–82. [DOI] [PubMed] [Google Scholar]
- [8].Dawber TR, Meadors GF, Moore FE. Epidemiological Approaches to Heart Disease: The Framingham Study. Am J Public Health Nations Health 1951;41:279–86. [DOI] [PMC free article] [PubMed] [Google Scholar]
- [9].Feinleib M, Kannel WB, Garrison RJ, McNamara PM, Castelli WP The framingham offspring study. Design and preliminary data. Prev Med 1975;4:518–25. [DOI] [PubMed] [Google Scholar]
- [10].Splansky GL, Corey D, Yang Q, Atwood LD, Cupples LA. Benjamin EJ, et al. The Third Generation Cohort of the National Heart, Lung, and Blood Institute’s Framingham Heart Study: design, recruitment, and initial examination. Am J Epidemiol 2007;165:1328–35. [DOI] [PubMed] [Google Scholar]
- [11].Rimm EB, Giovannucci EL, Stampfer MJ, Colditz GA, Litin LB, Willett WC. Reproducibility and Validity of an Expanded Self-Administered Semiquantitative Food Frequency Questionnaire among Male Health Professionals. Am J Epidemiol 1992;135:1114–26. [DOI] [PubMed] [Google Scholar]
- [12].Feskanich D, Rimm EB, Giovannucci EL, Colditz GA, Stampfer MJ, Litin LB, et al. Reproducibility and validity of food intake measurements from a semiquantitative food frequency questionnaire. J Am Diet Assoc 1993;93:790–6. [DOI] [PubMed] [Google Scholar]
- [13].Willett WC, Sampson L, Browne ML, Stampfer MJ, Rosner B, Hennekens CH, et al. The use of a self-administered questionnaire to assess diet four years in the past. Am J Epidemiol 1988;127:188–99. [DOI] [PubMed] [Google Scholar]
- [14].Hu FB, Rimm E, Smith-Warner SA, Feskanich D, Stampfer MJ, Ascherio A, et al. Reproducibility and validity of dietary patterns assessed with a food-frequency questionnaire. Am J Clin Nutr 1999; 69:243–9. [DOI] [PubMed] [Google Scholar]
- [15].Salvini S, Hunter DJ, Sampson L, Stampfer MJ, Colditz GA, Rosner B, et al. Food-based validation of a dietary questionnaire: the effects of week-to-week variation in food consumption. Int J Epidemiol 1989; 18:858–67. [DOI] [PubMed] [Google Scholar]
- [16].Frisoni GB, Fox NC, Jack CR, Scheltens P, Thompson PM. The clinical use of structural MRI in Alzheimer disease. Nat Rev Neurol 2010; 6:67–77. [DOI] [PMC free article] [PubMed] [Google Scholar]
- [17].Wardlaw JM, Smith EE, Biessels GJ, Cordonnier C, Fazekas F, Frayne R, et al. Neuroimaging standards for research into small vessel disease and its contribution to ageing and neurodegeneration. Lancet Neurol 2013;12:822–38. [DOI] [PMC free article] [PubMed] [Google Scholar]
- [18].Aljabar P, Heckemann RA, Hammers A, Hajnal JV, Rueckert D. Multiatlas based segmentation of brain images: Atlas selection and its effect on accuracy. Neuroimage 2009;46:726–38. [DOI] [PubMed] [Google Scholar]
- [19].DeCarli C, Massaro J, Harvey D, Hald J, Tullberg M, Au R, et al. Measures of brain morphology and infarction in the framingham heart study: establishing what is normal. Neurobiol Aging 2005; 26:491–510. [DOI] [PubMed] [Google Scholar]
- [20].DeCarli C, Fletcher E, Ramey V, Harvey D, Jagust WJ. Anatomical mapping of white matter hyperintensities (WMH): exploring the relationships between periventricular WMH, deep WMH, and total WMH burden. Stroke 2005;36:50–5. [DOI] [PMC free article] [PubMed] [Google Scholar]
- [21].Fletcher E, Carmichael O, Decarli C. MRI non-uniformity correction through interleaved bias estimation and B-spline deformation with a template. Conf Proc IEEE Eng Med Biol Soc 2012;2012:106–9. [DOI] [PMC free article] [PubMed] [Google Scholar]
- [22].Fletcher E, Singh B, Harvey D, Carmichael O, Decarli C. Adaptive image segmentation for robust measurement of longitudinal brain tissue change. Conf Proc IEEE Eng Med Biol Soc 2012;2012:5319–22. [DOI] [PMC free article] [PubMed] [Google Scholar]
- [23].Sperling RA, Aisen PS, Beckett LA, Bennett DA, Craft S, Fagan AM, et al. Toward defining the preclinical stages of Alzheimer’s disease: recommendations from the National Institute on Aging-Alzheimer’s Association workgroups on diagnostic guidelines for Alzheimer’s disease. Alzheimers Dement 2011;7:280–92. [DOI] [PMC free article] [PubMed] [Google Scholar]
- [24].Albert MS, DeKosky ST, Dickson D, Dubois B, Feldman HH, Fox NC, et al. The diagnosis of mild cognitive impairment due to Alzheimer’s disease: recommendations from the National Institute on Aging-Alz-heimer’s Association workgroups on diagnostic guidelines for Alzheimer’s disease. Alzheimers Dement 2011;7:270–9. [DOI] [PMC free article] [PubMed] [Google Scholar]
- [25].Pase MP, Beiser A, Enserro D, Xanthakis V, Aparicio H, Satizabal C, et al. Association of ideal cardiovascular health with vascular brain injury and incident dementia. Stroke 2016;47:1201–6. [DOI] [PMC free article] [PubMed] [Google Scholar]
- [26].Pase MP, Himali JJ, Mitchell GF, Beiser A, Maillard P, Tsao C, et al. Association of Aortic Stiffness With Cognition and Brain Aging in Young and Middle-Aged Adults: The Framingham Third Generation Cohort Study. Hypertension 2016;67:513–9. [DOI] [PMC free article] [PubMed] [Google Scholar]
- [27].Strauss E, Sherman EMS, Spreen O. A Compendium of Neuropsycho-logicalTests: Administration, Norms, and Commentary. USA: Oxford Press; 2006. [Google Scholar]
- [28].Au R, Seshadri S, Wolf PA, Elias M, Elias P, Sullivan L, et al. New norms for a new generation: cognitive performance in the framingham offspring cohort. Exp Aging Res 2004;30:333–58. [DOI] [PubMed] [Google Scholar]
- [29].Ford ES, Dietz WH. Trends in energy intake among adults in the United States: findings from NHANES. Am J Clin Nutr 2013;97:848–53. [DOI] [PMC free article] [PubMed] [Google Scholar]
- [30].Gorelick PB, Scuteri A, Black SE, Decarli C, Greenberg SM, Iadecola C, et al. Vascular contributions to cognitive impairment and dementia: A statement for healthcare professionals from the American Heart Association/American Stroke Association. Stroke 2011;42:2672–713. [DOI] [PMC free article] [PubMed] [Google Scholar]
- [31].Molteni R, Barnard RJ, Ying Z, Roberts CK, Gomez-Pinilla F. A high-fat, refined sugar diet reduces hippocampal brain-derived neurotrophic factor, neuronal plasticity, and learning. Neuroscience 2002; 112:803–14. [DOI] [PubMed] [Google Scholar]
- [32].Lu B, Nagappan G, Guan X, Nathan PJ, Wren P. BDNF-based synaptic repair as a disease-modifying strategy for neurodegenerative diseases. Nat Rev Neurosci 2013;14:401–16. [DOI] [PubMed] [Google Scholar]
- [33].Weinstein G, Beiser AS, Choi SH, Preis SR, Chen TC, Vorgas D, et al. Serum brain-derived neurotrophic factor and the risk for dementia: the Framingham Heart Study. JAMA Neurol 2014;71:55–61. [DOI] [PMC free article] [PubMed] [Google Scholar]
- [34].Ye X, Gao X, Scott T, Tucker KL. Habitual sugar intake and cognitive function among middle-aged and older Puerto Ricans without diabetes. Br J Nutr 2011;106:1423–32. [DOI] [PMC free article] [PubMed] [Google Scholar]
- [35].Kerti L, Witte AV, Winkler A, Grittner U, Rujescu D, Floel A. Higher glucose levels associated with lower memory and reduced hippocampal microstructure. Neurology 2013;81:1746–52. [DOI] [PubMed] [Google Scholar]
- [36].2015 Alzheimer’s disease facts and figures. Alzheimers Dement 2015; 11:332–84. [DOI] [PubMed] [Google Scholar]
- [37].U.S. Department of Health and Human Services and U.S. Department of Agriculture. 2015–2020 Dietary Guidelines for Americans. 8th ed.; 2015.
- [38].United States Department of Agriculture. National Nutrient Database for Standard Reference. Available at: https://ndb.nal.usda.gov/2015. Accessed October 1, 2016.
- [39].Boulton J, Hashem KM, Jenner KH, Lloyd-Williams F, Bromley H, Capewell S. How much sugar is hidden in drinks marketed to children? A survey of fruit juices, juice drinks and smoothies. BMJ Open 2016; 6:e010330. [DOI] [PMC free article] [PubMed] [Google Scholar]
- [40].Gill JM, Sattar N. Fruit juice: just another sugary drink? Lancet Diabetes Endocrinol 2014;2:444–6. [DOI] [PubMed] [Google Scholar]
Associated Data
This section collects any data citations, data availability statements, or supplementary materials included in this article.