Abstract
Background
Some Gynura species have been reported to be natural anti-diabetic plants. Improvement of their traits towards application relies on hybridization. Clearly, phylogenetic relationships could optimize compatible hybridizations. For flowerings plants, chloroplast genomes have been used to solve many phylogenetic relationships. To date, the chloroplast genome sequences of 4 genera of the tribe Senecioneae have been uploaded to GenBank. The internal relationships within the genus Gynura and the relationship of the genus Gynura with other genera in the tribe Senecioneae need further research.
Results
The chloroplast genomes of 4 Gynura species were sequenced, assembled and annotated. In comparison with those of 12 other Senecioneae species, the Gynura chloroplast genome features were analysed in detail. Subsequently, differences in the microsatellite and repeat types in the tribe were found. From the comparison, it was found that IR expansion and contraction are conserved in the genera Gynura, Dendrosenecio and Ligularia. Compared to other regions on the chloroplast genome, the region from 25,000 to 50,000 bp was not conserved. Seven ndh genes in this region are under purifying selection, with small changes in amino acids. The whole chloroplast genome sequences of 16 Senecioneae species were used to build a phylogenetic tree. Based on the oldest Artemisia pollen fossil, the divergence time was estimated.
Conclusions
Sequencing the chloroplast genomes of 4 Gynura species helps us to solve many problems. The phylogenetic relationships and divergence time among 4 Gynura and 16 Senecioneae species were evaluated by comparing their chloroplast genomes. The phylogenetic relationship of the genera Gynura and Ligularia was different from that observed previous work. In a previous phylogenetic tree, the genus Ligularia belonged to the Tussilagininae subtribe, which was in a lineage that diverged earlier than other genera. Further morphology and genome-wide analyses are needed to clarify the genus relationships.
Keywords: Chloroplast genome, Genus Gynura, Tribe Senecioneae, Phylogenetic relationships, Divergence time
Background
Gynura is a genus of flowering plants in the tribe Senecioneae of the family Asteraceae endemic to Asia, which contains 44 species in total [1]. Many species of the genus Gynura have been reported to have medicinal value for diabetes mellitus, such as G. procumbens, G. divaricata and G. medica. The aqueous extract from G. procumbens possesses a significant hypoglycaemic effect in streptozotocin-induced diabetic rats [2]. Additionally, an aqueous extract improved insulin sensitivity and suppressed hepatic gluconeogenesis in C57BL/KsJ-db/db mice [3]. Polysaccharide from G. divaricata could alleviate hyperglycaemia by modulating the activities of intestinal disaccharidases in streptozotocin-induced diabetic rats [4], and G. divaricata-lyophilized powder was effectively hypoglycaemic by activating insulin signalling and improving antioxidant capacity in mice with type 2 diabetes [5]. Phenolic compounds isolated from G. medica inhibited yeast α-glucosidase in vitro [6].
Some plants in the genus Gynura have also been used as vegetables and tea in people’s daily lives in East and South Asia; thus, there is value in studying the genus Gynura. Although Gynura plants are useful to resist diabetes, some shortcomings need improvement, such as the medicinal effect on diabetes, potential toxicity and oral tastes [7, 8]. Large improvement relies on interspecific hybridizations to increase genetic diversity and introgression of valuable traits. The phylogenetic relationship is useful information for interspecific hybridizations, but the phylogenetic relationship of the species in the genus Gynura is, as yet, unclear.
Whole chloroplast DNA ranges between 120 and 160 kb in size on the circular chromosome in most plants, composed of large single copy (LSC), small single copy (SSC), and two copies of an inverted repeat (IRa and IRb) [9, 10]. Compared to mitochondrial and nuclear genomes, chloroplast genomes are more conserved in terms of gene content, organization and structure [11]. The chloroplast genomes of angiosperms generally show slow substitution rates under adaptive evolution [12]. Considering its small size, conserved gene content and simple structure, the chloroplast genome is valid and cost-effective for studying phylogenetic relationships and the evolution of plants in different taxa. Recently, forage species of Urochloa [13], marine crop Gracilaria firma [14], epilithic sister genera Oresitrophe and Mukdenia [15], the families Adoxaceae and Caprifoliaceae of Dipsacales [16] were sequenced to elucidate the diversity, phylogeny and evolution of their related complete chloroplast genomes.
In the present study, we sequenced, assembled and annotated the chloroplast genomes of four Gynura species. Combined with chloroplast genomes of the genus Dendrosenecio, genus Jacobaea, genus Ligularia and genus Pericallis of the tribe Senecioneae, the structure features, repeat motifs, adaptive selection, phylogenetic relationships and divergence time were analysed.
Results and discussion
Chloroplast genome features of 16 Senecioneae species
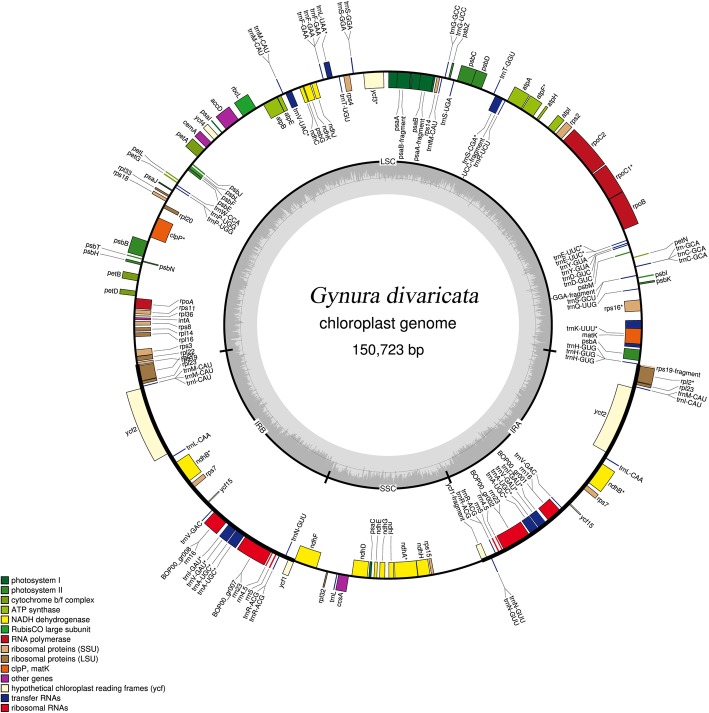
In this study, we sequenced and assembled the chloroplast genome of Gynura bicolor, Gynura divaricata, Gynura formosana and Gynura pseudochina. The 4 chloroplast genomes were successfully assembled and the details of data are shown in Table 1. The genus Gynura belongs to the tribe Senecioneae, which is the largest tribe of the family Asteraceae. Although the tribe comprises approximately 500 genera and 3000 species [17], we found that only 4 genera of the tribe Senecioneae had published chloroplast genomes in GenBank, and their IDs are listed in the methods. Five species of the genus Dendrosenecio, one species of the genus Jacobaea, five species of the genus Ligularia, one species of the genus Pericallis and four species of the genus Gynura were used to find their similarities and differences. The whole-sequence lengths ranged from 150,551 bp (Dendrosenecio brassiciformis) to 151,267 bp (Pericallis hybrida). With the typical quadripartite parts, such as most land plants, the chloroplast genome has one large single copy (LSC), one short single copy (SSC), and two inverted regions (IRa and IRb) (Fig. 1). The LSC lengths ranged from 82,816 bp (Jacobaea vulgaris) to 83,458 bp (Dendrosenecio cheranganiensis), the SSC lengths ranged from 17,749 bp (D. brassiciformis) to 18,331 bp (P. hybrida) and the IR lengths both ranged from 24,688 bp (D. brassiciformis) to 24,845 bp (P. hybrida) (Table 2). The total length changes were not consistent with the length changes of each region. J. vulgaris has the shortest chloroplast genome length, but its SSR region is longer than that of 4 Gynura species. In addition, there are 95 coding genes in the chloroplast genome of P. hybrida and 87 coding genes in J. vulgaris. GC content has a very low range of variation between 37.2 and 37.5%. Only the rRNA number is conserved in the chloroplast genome of the tribe Senecioneae, which is the same as that of the families Adoxaceae and Caprifoliaceae [16] but different from that of the genera Oresitrophe and Mukdenia [15].
Table 1.
Assembling datas of 4 Gynura species
| Speices | Raw data (Gb) | Clean data (Gb) | Total reads (bp) | Aligned reads (bp) | Assembled reads (bp) | Average coverage (Depth) |
|---|---|---|---|---|---|---|
| Gynura bicolor | 8.221 | 8.211 | 10,036,414 | 655,986 | 369,592 | 652X |
| Gynura divaricata | 7.514 | 7.489 | 10,036,414 | 151,500 | 120,390 | 150X |
| Gynura formosana | 3.213 | 3.213 | 9,064,960 | 103,304 | 73,720 | 102X |
| Gynura pseudochina | 3.449 | 3.444 | 9,728,392 | 211,624 | 143,102 | 211X |
Fig. 1.
Chloroplast genome map of Gynura divaricata. Genes inside the circle are transcribed clockwise and genes outside are transcribed counter-clockwise. The ratio of light gray inside to drak gray outside represents the ratio of AT/CG content. The colors of different genes correspond to different functional groups in the legend
Table 2.
Overview of chloroplast genome of 16 Senecioneae species
| Speices | Size (bp) | LSC (bp) | SSC (bp) | IR (bp) | GC% | Protein | rRNA | tRNA | Total genes |
|---|---|---|---|---|---|---|---|---|---|
| Gynura bicolor | 150,930 | 83,258 | 18,128 | 24,772 | 37.2 | 91 | 8 | 35 | 134 |
| Gynura divaricata | 150,723 | 82,998 | 18,163 | 24,781 | 37.2 | 91 | 8 | 35 | 134 |
| Gynura formosana | 151,104 | 83,368 | 18,164 | 24,786 | 37.2 | 91 | 8 | 35 | 134 |
| Gynura pseudochina | 151,023 | 83,330 | 18,131 | 24,781 | 37.2 | 91 | 8 | 35 | 134 |
| Dendrosenecio brassiciformis | 150,551 | 83,426 | 17,749 | 24,688 | 37.5 | 89 | 8 | 37 | 134 |
| Dendrosenecio cheranganiensis | 150,606 | 83,458 | 17,768 | 24,690 | 37.5 | 89 | 8 | 37 | 134 |
| Dendrosenecio johnstonii | 150,607 | 83,471 | 17,756 | 24,690 | 37.4 | 89 | 8 | 37 | 134 |
| Dendrosenecio kilimanjari | 150,593 | 83,457 | 17,756 | 24,690 | 37.5 | 89 | 8 | 37 | 134 |
| Dendrosenecio meruensis | 150,587 | 83,450 | 17,757 | 24,690 | 37.5 | 89 | 8 | 37 | 134 |
| Jacobaea vulgaris | 150,689 | 82,816 | 18,277 | 24,798 | 37.3 | 87 | 8 | 37 | 132 |
| Ligularia hodgsonii | 151,136 | 83,254 | 18,218 | 24,832 | 37.5 | 94 | 8 | 36 | 138 |
| Ligularia intermedia | 151,152 | 83,259 | 18,233 | 24,830 | 37.5 | 94 | 8 | 36 | 138 |
| Ligularia jaluensis | 151,148 | 83,264 | 18,226 | 24,829 | 37.5 | 94 | 8 | 36 | 138 |
| Ligularia mongolica | 151,118 | 83,245 | 18,215 | 24,829 | 37.5 | 93 | 8 | 36 | 137 |
| Ligularia veitchiana | 151,253 | 83,331 | 18,248 | 24,837 | 37.5 | 94 | 8 | 36 | 138 |
| Pericallis hybrida | 151,267 | 83,246 | 18,331 | 24,845 | 37.3 | 95 | 8 | 36 | 139 |
Microsatellite and repeat types
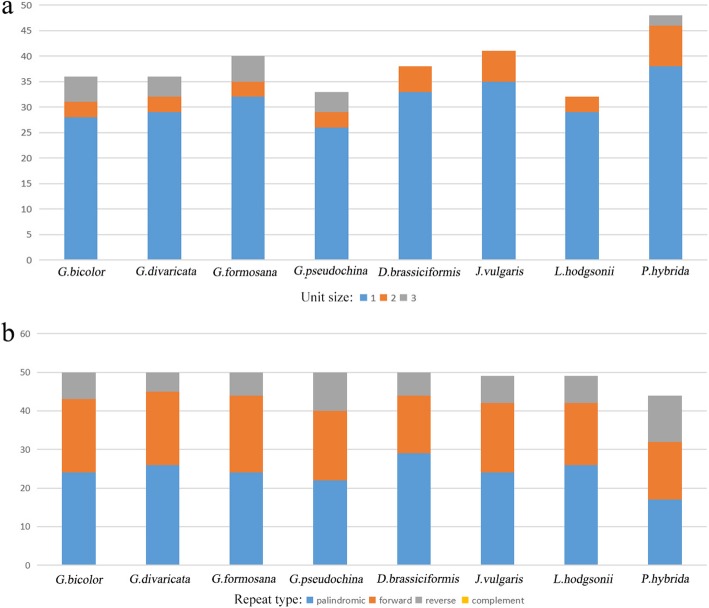
The number of microsatellites with mono-, di- and trinucleotide repeat motifs varies in the tribe. D. brassiciformis, J. vulgaris and L. hodgsonii do not have trinucleotide repeat motifs, while four Gynura species have 4 to 5 trinucleotide repeat motifs. The number of mononucleotide repeat motifs is 28 to 38, accounting for the largest proportion (Fig. 2a). The unit size of microsatellites is significantly different in four Urochloa species [13], which have tetranucleotide repeat motifs, and the trinucleotide motif is the largest proportion. The total number of repeat types is consistent with that in the four Gynura species, but the number of each repeat type is different. Palindromic repeats are the most abundant, and complement repeats are secondary in 16 Senecioneae species (Fig. 2b). Comparing the Oresitrophe and Senecioneae species [15], the Senecioneae species have 5 to 12 reverse repeats, but the Oresitrophe species do not have reverse repeats. In addition, the forward and palindromic repeat numbers are similar in the Oresitrophe species.
Fig. 2.
The repeat motif statistics of 7 Senecioneae species. a Frequency of repeat types. b Frequency of unit size
Contraction and expansion of inverted repeats
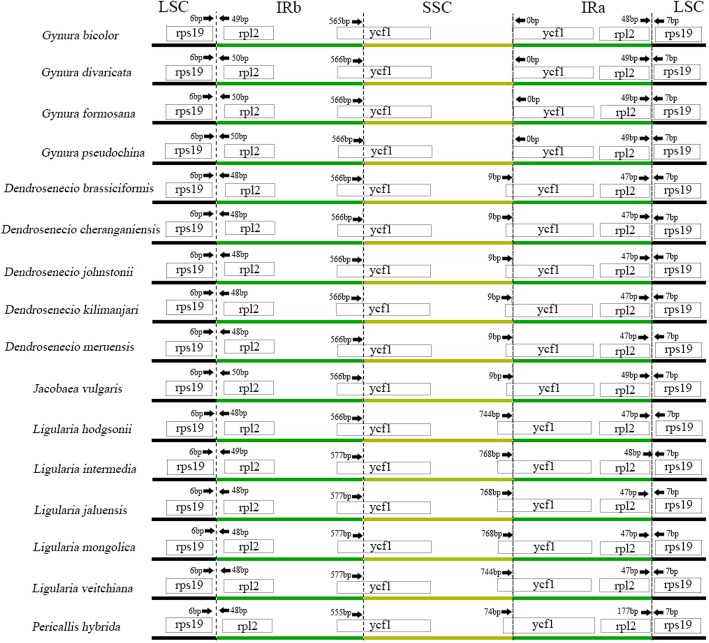
The chloroplast genome is highly conserved in land plants, but IR expansion and contraction lead to different genome sizes in different plants [18]. The LSC/IRb/SSC/IRa/LSC border and adjacent genes of 16 species of the Senecioneae tribe were carefully analysed to find similarities and differences (Fig. 3). The rps19 and rpl2 genes are located in the LSC/IRb and IRa/LSC borders in pairs. In 16 Senecioneae species, the two copies of rps19 have no change in position in relation to the border, and the two copies of rpl2 are relatively conserved, with 1–3 base position changes except for the IRa/LSC border of P. hybrida. One copy of ycf1 spans the border of LSC/IRb, and another copy is different. The start position is just on the border in the four Gynura species, but the others also span the border of IRa/LSC. By comparison, IR expansion and contraction are conserved in the genera Gynura, Dendrosenecio and Ligularia.
Fig. 3.
Schematic representation of the border positions of LSC, IRs and SSC in the chloroplast genome of 16 Senecioneae species
Sequence variation and adaptive selection
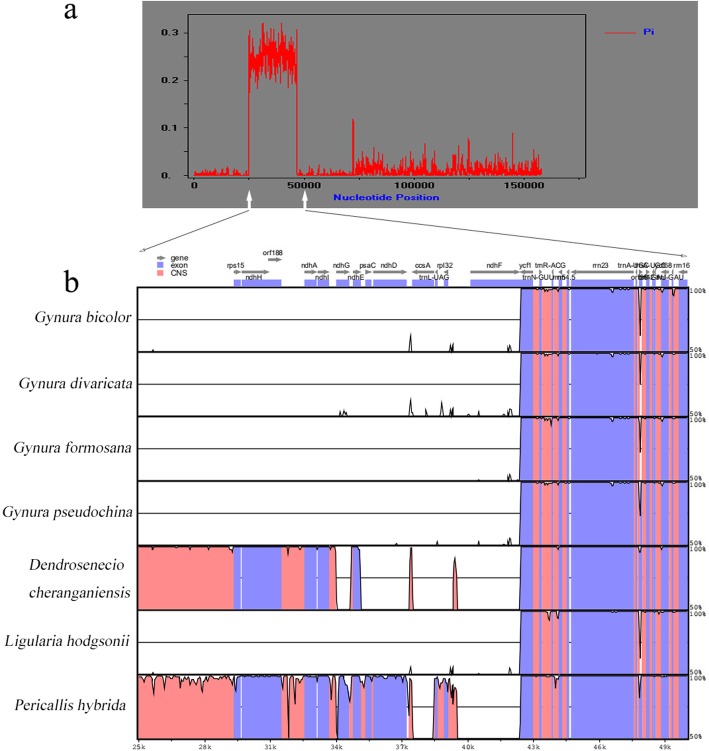
The whole chloroplast genome sequences of 16 Senecioneae species were aligned by the MAFFT program to find sequence variation. The alignment result was used to calculate the DNA polymorphism by the DnaSP program. The base sequence has a Pi value (nucleotide diversity) of 0.2–0.3 at 25,000 bp to 50,000 bp, and that of other positions was below 0.1 (Fig. 4a). This result shows that this region is not conserved, similar to other regions of the chloroplast genome. For further analysis of the results, the chloroplast genome sequences of four Gynura species, D. cheranganiensis, L. hodgsonii and P. hybrida were aligned and visualized by the mVISTA program. The overall result is consistent with the DNA polymorphism result (Additional file 1: Figure S1) and shows that the region from 25,000 bp to 50,000 bp is not conserved, similar to other regions. The four Gynura species are conserved in the 25,000 bp to 50,000 bp region and are similar to L. hodgsonii. In that region, D. cheranganiensis is close to P. hybrida but different from the four Gynura species and L. hodgsonii (Fig. 4b). That region has a total of 12 genes, and 7 genes encode the NAD(P) H dehydrogenase (NDH) complex subunit. The function of the NAD(P) H dehydrogenase (NDH) complex is well known in photosystem I (PSI) cyclic electron flow (CEF) and chlororespiration [19, 20], so the substitution of ndh genes was further studied. The ratio of the non-synonymous (dN)/synonymous substitution (dS) rate was calculated by the PAML program. A ratio > 1 indicates positive selection, a ratio < 1 indicates purifying selection and a ratio = 1 indicates neutral evolution. All the dN/dS ratios of 7 genes below 1 indicate that they are under purifying selection, and little amino acid change occurred (Table 3). Thus, the functions of 7 ndh genes should be conserved during evolution, although they are not located in a conserved region.
Fig. 4.
Sequence divergence of chloroplast genome sequences in 7 Senecioneae species. a The Pi value (nucleotide diversity) of the 7 chloroplast genome sequences. b The sequence divergence from 25,000 bp to 50,000 bp visualized by mVISTA program. The vertical scale indicates percentage identity, ranging from 50 to 100%
Table 3.
Molecular evolutionary rate of 7 ndh genes in 16 Senecioneae species
| Gene | ndhA | ndhB | ndhC | ndhD | ndhE | ndhF | ndhG | ndhH | ndhI | ndhJ | ndhK |
|---|---|---|---|---|---|---|---|---|---|---|---|
| dN/dS | 0.05971 | 0.71728 | 0.16003 | 0.34997 | 0.0001 | 0.33121 | 0.39231 | 0.13607 | 0.0001 | 0.06077 | 0.3433 |
Phylogenetic relationships
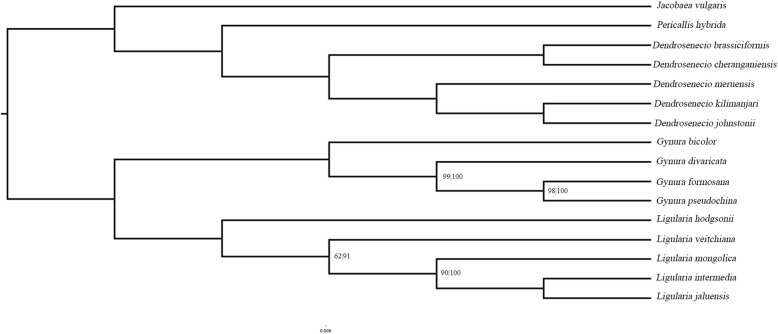
A sequence alignment of 16 Senecioneae species was used to construct a maximum likelihood (Fig. 5) and Bayesian inference (Additional file 2: Figure S2) tree. In the ML tree, two major clades were constructed with a 100% bootstrap value. One clade includes the genera Gynura and Ligularia, and the other clade includes the genera Dendrosenecio, Pericallis and Jacobaea. In the genus Gynura, G. bicolor was the first to differentiate, followed by G. divaricata and, finally, G. formosana and G. pseudochina. The former systemic phylogenies of the tribe Senecioneae based on the ITS region (nuclear) and plastid fragment sequences show a significant difference from the phylogenetic tree [17]. In a previous phylogenetic tree, the genus Ligularia belongs to the Tussilagininae subtribe, which was in lineage that diverged earlier than other genera. The sequence is relatively conserved among four Gynura species and five Ligularia species, and the Pi value of most sequence locations is below 0.1 (Additional file 3: Figure S3), which is significantly lower than that of the 16 species alignment. From the perspective of whole chloroplast genomes, the genus Ligularia is close to the genus Gynura.
Fig. 5.
Maximum-likelihood (ML) phylogenetic tree obtained for 16 Senecioneae species based on the whole chloroplast genome sequences. Unlabeled nodes have bootsrap values of 100%. Noted nodes shows the bootstrap values of ML/BI
Divergence time estimation
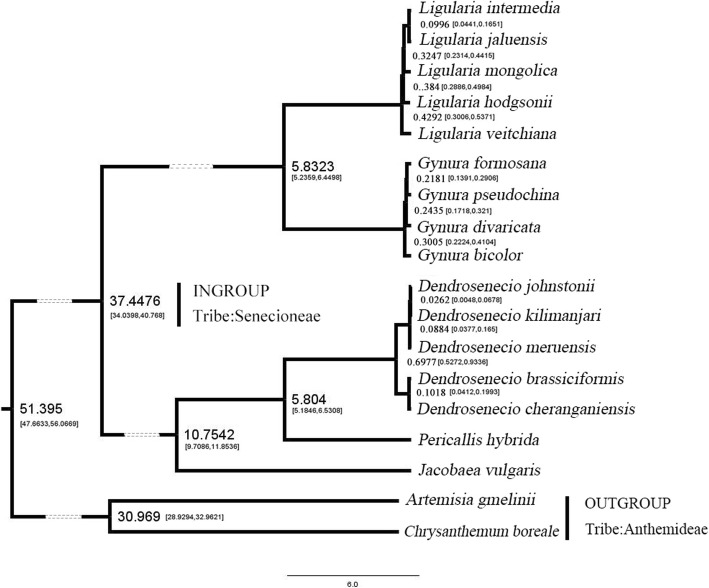
For the divergence time estimation of the 16 Senecioneae species, Artemisia gmelinii and Chrysanthemum boreale (tribe Anthemideae) were selected as the outgroup due to the oldest Artemisia fossil pollen [21, 22]. The divergence time of 16 Senecioneae species was estimated by the BEAST2.0 program (Fig. 6). The divergence clades of these genera are the same as the ML tree. The two major clades were expected to differentiate 37.4 mya (late Eocene). Both Gynura and Ligularia differentiated 5.8 mya (late Miocene). Dendrosenecio and Pericallis also differentiated 5.8 mya. The divergence time of the tribes Senecioneae and Anthemideae was 51.39 mya (early Eocene), and the result was consistent with that of a previous study on the evolution and phylogenetic of the family Asteroideae based on plastid fragment sequences [22]. The traditional view on divergence time of the genus Gynura is in the Old World after the Atlantic opening. In that time, the senecioid species were transferred to South America, and divergence began [23]. The divergence time of Gynura species was approximately 0.3 mya, and the result showed that the divergence time of the genus Gynura was much earlier than that of the traditional view. The divergence time of the genus Gynura could not start at hundreds or thousands of years ago [23], and the divergence time estimated by the BEAST program was in the same time period as that of other genera of land plants [13–16].
Fig. 6.
Divergence time estimation of 18 Asteraceae species. Dotted lines shorten the proportional length. The left and right numbers in square brackets are 95% HPD upper and lower bound respectively
Conclusion
This study analyses the chloroplast genome of four Gynura species used as herbal medicine in parts of Asia. By comparing with other plants in the tribe Senecioneae, the repeat motifs, detailed structure features, phylogenetic relationships and divergence time estimation were investigated. The phylogenetic relationships of the genera Gynura and Ligularia and others are still in doubt. The tribe Senecioneae contains 155 genera and is almost distributed throughout the world [17]. The phylogenetic relationship is difficult to determine by chloroplast fragment or genome. Morphology and genome-wide analyses are needed to further clarify the genus relationships. Determining interspecific relationships and intergeneric relationships will facilitate hybrid breeding of Gynura species.
Methods
Plant materials, genome sequencing and assembly
Gynura bicolor, a cultivated plant, voucher specimen (510918–1), was collected from Nanjing Botanical Garden Mem. Sun Yet-Sen. Gynura divaricata, a cultivated plant, voucher specimen (510918–6), was collected from Nanjing Botanical Garden Mem. Sun Yet-Sen. Gynura formosana, a cultivated plant, voucher specimen (512019–3), was collected from Kunming Botanical Garden. Gynura pseudochina, a wild plant, voucher specimen (512019–8), was collected from Wenshan Zhuang and Miao Autonomous Prefecture, Yunnan Province. All the plants were collected by Prof. Bingru Ren, and the specimens were deposited in the Herbarium of Institute of Botany, Jiangsu Province and Chinese Academy of Sciences.
The Gynura bicolor, G. divaricata, G. formosana and G. pseudochina plants were grown in a greenhouse with normal sunlight and temperature. The DNA was extracted from their fresh leaves by the CTAB method [24], and DNA degradation and contamination were monitored on 1% agarose gels.
Approximately 1.5 μg of the DNA sample was fragmented by sonication to a size of 350 bp. Then, the DNA fragments were end polished, poly A-tailed, and ligated with a full-length adaptor for Illumina sequencing, with further PCR amplification. After PCR product purification (AMPure XP system), libraries were analysed for size distribution by an Agilent 2100 Bioanalyzer and quantified by using real-time PCR.
The libraries constructed above were sequenced by the Illumina HiSeq X Ten platform, and 150 bp paired-end reads (PE150) were generated with an insert size of approximately 350 bp. Quality control (QC) removed reads with ≥10% unidentified nucleotides (N), > 50% bases having a phred quality < 5 and > 10 nt aligned to the adaptor, allowing ≤10% mismatches.
The Perl script NOVOPlasty 2.7.2 [25] was used to assemble the chloroplast genome sequence with a 50 K-mer. The chloroplast genome sequence of Dendrosenecio cheranganiensis (tribe Senecioneae) was selected as the reference genome. The family Asteraceae plant sequences used in the study were downloaded from GenBank as follows: Dendrosenecio brassiciformis (NC_037960.1), Dendrosenecio cheranganiensis (NC_037956.1), Dendrosenecio johnstonii (NC_037959.1), Dendrosenecio kilimanjari (NC_037957.1), Dendrosenecio meruensis (NC_037958.1), Jacobaea vulgaris (NC_037957.1), Ligularia hodgsonii (NC_039381.1), Ligularia intermedia (NC_039382.1), Ligularia jaluensis (NC_039383.1), Ligularia mongolica (NC_039384.1), Ligularia veitchiana (NC_039385.1), Artemisia gmelinii (NC_031399.1), and Chrysanthemum boreale (NC_037388.1).
Chloroplast genome annotation
The whole chloroplast genome sequences were annotated by Dual Organellar Genome Annotator [26] and GeSeq [27] with default parameters. Chloroplast genome sequences of tribe Senecioneae plants Dendrosenecio cheranganiensis and Pericallis hybrida were used as reference sequences. Subsequently, all tRNAs were verified by ARAGORN v1.2.38 [28] and tRNAscan-SE v2.0 [29]. A schematic diagram of the chloroplast genome with annotations was obtained by OGDRAW [30].
Repeat structure analysis
The microsatellite regions are a tract of repetitive DNA in which certain DNA motifs (ranging in length from 1 to 6 or more base pairs) are repeated, typically 5–50 times [31, 32]. The Perl script Microsatellite identification tool (MISA, http://pgrc.ipk-gatersleben.de/misa/misa.html) was used to find the microsatellite regions of the chloroplast genome. Considering the features of plant chloroplasts, the numbers of each unit of continuous DNA motifs was set to 1–6, and the minus DNA motifs of each unit was 1–10, 2–6, 3–5, 4–5, 5–5, and 6–5. Forward, reverse, complement and palindromic repeat types were detected by the online tool REPuter [33]. The Hamming distance was set as 1, and the minimum repeat size was 30 bp.
Chloroplast genome analysis
All the chloroplast genome sequences were aligned by MAFFT7.427 [34] on the FFT-NS-2 module. The different chloroplast genome sequences (LSC, SSC, IRa and IRb) concatenated together to make one sequence per species. Alignments of 7 selected genome sequences were visualized by mVISTA [35]. DNA polymorphism (nucleotide diversity) was calculated by DnaSPv5 [36] based on alignment results.
Molecular evolutionary rates (ω) between orthologous genes were estimated by calculating the ratio of the non-synonymous (dN)/synonymous substitution (dS) rates. Coding gene sequences of selected regions were extracted by using Artemis [37]. Gene sequences of each species were aligned by Clustal X [38] with default parameters, and the alignment results (dnd format) were converted to PML format by DAMBE [39] for subsequent analysis. The dN/dS value was calculated by the codeml module (seqtype = 1, model = 0, Nsites = 1,7,8) in PAML4.9i [40]. Significant differences were calculated by the likelihood ratio test.
Phylogenetic analysis
The 16 chloroplast genome sequences of the tribe Senecioneae (family Asteraceae) were aligned by MAFFT, and the results were used to analyse the phylogenetic relationships. RAxML8 [41] was used to build a maximum likelihood tree with the GTRGAMMAI module and 1000 bootstrap replicates. Mrbayes3.2.7a [42] was used to build a Bayesian inference tree. The parameter settings were as follows: nst = 6, rates = invgamma, burnin = 500, Ngen = 20,000, Samplefreq = 10, and Printfreq = 100. Both the results of the ML tree and BI tree were visualized by FigTree V1.4.3 (http://tree.bio.ed.ac.uk/software/figtree/).
Divergence time estimation
The divergence time of 16 species was estimated by BEAST2 [43]. The oldest Artemisia fossil pollen has been recorded from the Eocene–Oligocene boundary [21, 44]. The Asteraceae family plants Artemisia gmelinii and Chrysanthemum boreale were selected as the outgroup, and the node Artemisia–Chrysanthemum was constrained by using a lognormal distribution with an offset of 31 Ma and a mean and standard deviation of 0.5 [22]. The HKY nucleotide substitution model and the prior tree Yule model were selected with a strict clock. Each MCMC run had a chain length of 100,000,000 with sampling every 10,000 steps. Tracer [45] was used to read the ESS and trace value of logged statistics to access the results. Then, the divergence time was accessed by the Treeannotator program of BEAST2. The detailed settings were as follows: burnin percentage = 50, posterior probability limit = 0.0, target tree type = maximum clade credibility tree, and node heights = mean heights.
Supplementary information
Additional file 1: Figure S1. Alignment of whole choloroplast genome sequences of 7 Senecioneae species. The vertical scale indicates percentage identity, ranging from 50 to 100%.
Additional file 2: Figure S2. Bayesian inference (BI) phylogenetic tree obtained for 16 Senecioneae species based on the whole chloroplast genome sequences. Unlabeled nodes have bootsrap values of 100%.
Additional file 3: Figure S3. The Pi value (nucleotide diversity) of chloroplast genome sequences between four Gynura species and five Ligularia species.
Acknowledgements
Thanks for everyone who helped us.
Authors’ contributions
JL and HL obtained the samples. TH and BR analyzed the data. ML, JC and TH conceived and wrote the manuscript. WL and JC designed the idea of the article. WL applied for experimental funds. All authors read and approved the final manuscript.
Funding
This research was funded by the National Natural Science Foundation of China (No. 31770366; No. 81773885; No. 81703224). The authors are also indebted to the supports from Jiangsu Scientific and Technological Innovations Platform (Jiangsu Provincial Service Center for Antidiabetic Drug Screening).
Availability of data and materials
All the data and materials are available from the corresponding authors upon request. The raw sequence data was uploaded to NCBI SRA database and the unique identifier is BioProject: PRJNA577235.
Ethics approval and consent to participate
Not applicable
Consent for publication
Not applicable.
Competing interests
The authors declare that they have no competing interests.
Footnotes
Publisher’s Note
Springer Nature remains neutral with regard to jurisdictional claims in published maps and institutional affiliations.
Contributor Information
Tianyu Han, Email: Hantianyu4333@163.com.
Mimi Li, Email: limm001@163.com.
Jiawei Li, Email: lijiawei36@foxmail.com.
Han Lv, Email: xiaohan1814@163.com.
Bingru Ren, Email: Bingruren@126.com.
Jian Chen, Email: chenjian80@aliyun.com.
Weilin Li, Email: wlli@njfu.edu.cn.
Supplementary information
Supplementary information accompanies this paper at 10.1186/s12864-019-6196-x.
References
- 1.Vanijajiva O. A revision of Gynura (Asteraceae: Senecioneae) J Systematics Evol. 2011;49(4):285–314. [Google Scholar]
- 2.Hassan Z, Yam MF, Ahmad M, et al. Antidiabetic properties and mechanism of action of Gynura procumbens water extract in Streptozotocin-induced diabetic rats. Molecules. 2010;15(12):9008–9023. doi: 10.3390/molecules15129008. [DOI] [PMC free article] [PubMed] [Google Scholar]
- 3.Choi SI, Lee HA, Han JS. Gynura procumbens extract improves insulin sensitivity and suppresses hepatic gluconeogenesis in C57BL/KsJ-db/db mice. Nutr Res Pract. 2016;10. [DOI] [PMC free article] [PubMed] [Retracted]
- 4.Deng YX, Chen YS, Zhang WR, et al. Polysaccharide from Gynura divaricata modulates the activities of intestinal disaccharidases in streptozotocin-induced diabetic rats. Br J Nutr. 2011;106(9):1323–1329. doi: 10.1017/S0007114511001693. [DOI] [PubMed] [Google Scholar]
- 5.Xu BQ, Yang P, Zhang YQ. Hypoglycemic activities of lyophilized powder of Gynura divaricata by improving antioxidant potential and insulin signaling in type 2 diabetic mice. Food Nutr Res. 2015;59(1):29652. doi: 10.3402/fnr.v59.29652. [DOI] [PMC free article] [PubMed] [Google Scholar]
- 6.Tan C, Wang Q, Luo C, et al. Yeast α-Glucosidase inhibitory phenolic compounds isolated from Gynura medica leaf. Int J Mol Sci. 2013;14(2):2551–2558. doi: 10.3390/ijms14022551. [DOI] [PMC free article] [PubMed] [Google Scholar]
- 7.Rosidah, Yam MF, Sadikun A, et al. Toxicology evaluation of standardized methanol extract of Gynura procumbens. J Ethnopharmacol. 2009;123(2):0–249. [DOI] [PubMed]
- 8.Zhang F, Zhou Y, Yang X, et al. Gynura Rhizoma containing pyrrolizidine alkaloids induces the hepatic sinusoidal obstruction syndrome in mice via upregulating fibrosis-related factors. Acta Pharmacologica Sinica. 2018. [DOI] [PMC free article] [PubMed]
- 9.Palmer DJ. Comparative Organization of Chloroplast Genomes. Annu Rev Genet. 1985;19(1):325–354. doi: 10.1146/annurev.ge.19.120185.001545. [DOI] [PubMed] [Google Scholar]
- 10.Palmer JD, Jansen RK, Michaels HJ, et al. Chloroplast DNA variation and plant phylogeny. Ann Mo Bot Gard. 1988;75(4):1180–1206. [Google Scholar]
- 11.Raubeson LA, Jansen RK, Henry RJ. Chloroplast genomes of plants. 2005.
- 12.Erixon P, Oxelman B. Reticulate or tree-like chloroplast DNA evolution in Sileneae (Caryophyllaceae)? Mol Phylogenet Evol. 2008;48(1):313–325. doi: 10.1016/j.ympev.2008.04.015. [DOI] [PubMed] [Google Scholar]
- 13.Marco PF, Martins AM, Ferreira ME. Molecular dating of phylogenetic divergence between Urochloa species based on complete chloroplast genomes. BMC Genomics. 2017;18(1):516. doi: 10.1186/s12864-017-3904-2. [DOI] [PMC free article] [PubMed] [Google Scholar]
- 14.Ng PK, Lin SM, Lim PE, et al. Complete chloroplast genome of Gracilaria firma (Gracilariaceae, Rhodophyta), with discussion on the use of chloroplast phylogenomics in the subclass Rhodymeniophycidae. BMC Genomics. 2017;18(1):40. doi: 10.1186/s12864-016-3453-0. [DOI] [PMC free article] [PubMed] [Google Scholar]
- 15.Liu L, Wang Y, He P, et al. Chloroplast genome analyses and genomic resource development for epilithic sister genera Oresitrophe and Mukdenia (Saxifragaceae), using genome skimming data. BMC Genomics. 2018;19(1):235. doi: 10.1186/s12864-018-4633-x. [DOI] [PMC free article] [PubMed] [Google Scholar]
- 16.Fang WB, Ying W, Jiao Y, et al. Comparative chloroplast genomics of Dipsacales species: insights into sequence variation, adaptive evolution, and phylogenetic relationships. Front Plant Sci. 2018;9:689. doi: 10.3389/fpls.2018.00689. [DOI] [PMC free article] [PubMed] [Google Scholar]
- 17.Pelser PB, Kennedy AH, Tepe EJ, et al. Patterns and causes of incongruence between plastid and nuclear Senecioneae (Asteraceae) phylogenies. Am J Bot. 2010;97(5):856–873. doi: 10.3732/ajb.0900287. [DOI] [PubMed] [Google Scholar]
- 18.Wang RJ, Cheng CL, Chang CC, et al. Dynamics and evolution of the inverted repeat-large single copy junctions in the chloroplast genomes of monocots. BMC Evol Biol. 2008;8(1):36–0. [DOI] [PMC free article] [PubMed]
- 19.Burrows PA, Sazanov LA, Svab Z, et al. Identification of a functional respiratory complex in chloroplasts through analysis of tobacco mutants containing disrupted plastid ndh genes. EMBO J. 1998;17(4):868–876. doi: 10.1093/emboj/17.4.868. [DOI] [PMC free article] [PubMed] [Google Scholar]
- 20.Shikanai T. Cyclic Electron transport around photosystem I: genetic approaches. Annu Rev Plant Biol. 2007;58(1):199–217. doi: 10.1146/annurev.arplant.58.091406.110525. [DOI] [PubMed] [Google Scholar]
- 21.Hobbs CR, Baldwin BG. Asian origin and upslope migration of Hawaiian Artemisia (Compositae—Anthemideae) J Biogeogr. 2013;40(3):442–454. [Google Scholar]
- 22.Panero JL, Crozier BS. Macroevolutionary dynamics in the early diversification of Asteraceae. Mol Phylogenet Evol. 2016;S105579031600083X. [DOI] [PubMed]
- 23.Davies FG. The genus Gynura (Compositae) in Malesia and Australia. Kew Bull. 1980;35(4):711–734. [Google Scholar]
- 24.Doyle JJ, Doyle JL. A rapid DNA isolation procedure for small quantities of fresh leaf tissue. Phytochem Bull. 1987;19:11–15. [Google Scholar]
- 25.Dierckxsens N, Mardulyn P, Smits G. NOVOPlasty de novo assembly of organelle genomes from whole genome data. Nucleic Acids Res. 2016;45(4):e18. doi: 10.1093/nar/gkw955. [DOI] [PMC free article] [PubMed] [Google Scholar]
- 26.Wyman SK, Jansen RK, Boore JL. Automatic annotation of organellar genomes with DOGMA. Bioinformatics. 2004;20(17):3252–3255. doi: 10.1093/bioinformatics/bth352. [DOI] [PubMed] [Google Scholar]
- 27.Tillich M, Lehwark P, Pellizzer T, et al. GeSeq - versatile and accurate annotation of organelle genomes. Nucleic Acids Res. 2017;45(1):3. doi: 10.1093/nar/gkx391. [DOI] [PMC free article] [PubMed] [Google Scholar]
- 28.Laslett D. ARAGORN, a program to detect tRNA genes and tmRNA genes in nucleotide sequences. Nucleic Acids Res. 2004;32(1):11–16. doi: 10.1093/nar/gkh152. [DOI] [PMC free article] [PubMed] [Google Scholar]
- 29.Lowe TM, Chan PP. tRNAscan-SE on-line: integrating search and context for analysis of transfer RNA genes. Nucleic Acids Res. 2016;44:W54–W57. doi: 10.1093/nar/gkw413. [DOI] [PMC free article] [PubMed] [Google Scholar]
- 30.Lohse M, Drechsel O, Bock R. OrganellarGenomeDRAW (OGDRAW): a tool for the easy generation of high-quality custom graphical maps of plastid and mitochondrial genomes. Curr Genet. 2007;52(5–6):267–274. doi: 10.1007/s00294-007-0161-y. [DOI] [PubMed] [Google Scholar]
- 31.Richard GF, Kerrest A, Dujon B. Comparative genomics and molecular dynamics of DNA repeats in eukaryotes. Microbiol Mol Biol Rev. 2008;72(4):686–727. doi: 10.1128/MMBR.00011-08. [DOI] [PMC free article] [PubMed] [Google Scholar]
- 32.Gulcher J. Microsatellite markers for linkage and association studies. Cold Spring Harb Protoc. 2012;4:425–32. [DOI] [PubMed]
- 33.Kurtz S, Choudhuri JV, Ohlebusch E, et al. REPuter: the manifold applications of repeat analysis on a genomic scale. Nucleic Acids Res. 2001;29(22):4633–4642. doi: 10.1093/nar/29.22.4633. [DOI] [PMC free article] [PubMed] [Google Scholar]
- 34.Nakamura T, Yamada KD, Tomii K, et al. Parallelization of MAFFT for large-scale multiple sequence alignments. Bioinformatics. 2018;34(14):2490–2492. doi: 10.1093/bioinformatics/bty121. [DOI] [PMC free article] [PubMed] [Google Scholar]
- 35.Frazer KA, Pachter L, Poliakov A, et al. VISTA: computational tools for comparative genomics. Nucleic Acids Res. 2004;32(Web Server issue):W273–W279. doi: 10.1093/nar/gkh458. [DOI] [PMC free article] [PubMed] [Google Scholar]
- 36.Librado P, Rozas J. DnaSP v5: a software for comprehensive analysis of DNA polymorphism data. Bioinformatics. 2009;25(11):1451–1452. doi: 10.1093/bioinformatics/btp187. [DOI] [PubMed] [Google Scholar]
- 37.Carver T, Harris SR, Berriman M, et al. Artemis: an integrated platform for visualization and analysis of high-throughput sequence-based experimental data. Bioinformatics. 2012;28(4):464–469. doi: 10.1093/bioinformatics/btr703. [DOI] [PMC free article] [PubMed] [Google Scholar]
- 38.Larkin MA, Blackshields G, Brown NP, et al. Clustal W and Clustal X version 2.0. Bioinformatics. 2007;23(21):2947–2948. doi: 10.1093/bioinformatics/btm404. [DOI] [PubMed] [Google Scholar]
- 39.Xia X, Kumar S. DAMBE7: new and improved tools for data analysis in molecular biology and evolution. Mol Biol Evol. 2018. [DOI] [PMC free article] [PubMed]
- 40.Yang ZH. PAML 4: phylogenetic analysis by maximum likelihood. Mol Biol Evol. 2007;24(8):1586–1591. doi: 10.1093/molbev/msm088. [DOI] [PubMed] [Google Scholar]
- 41.Stamatakis A. RAxML version 8: a tool for phylogenetic analysis and post-analysis of large phylogenies. Bioinformatics. 2014;30(9):1312–1313. doi: 10.1093/bioinformatics/btu033. [DOI] [PMC free article] [PubMed] [Google Scholar]
- 42.Ronquist F, Teslenko M, van der Mark P, et al. MrBayes 3.2: efficient Bayesian phylogenetic inference and model choice across a large model space. Syst Biol. 2012;61(3):539–542. doi: 10.1093/sysbio/sys029. [DOI] [PMC free article] [PubMed] [Google Scholar]
- 43.Bouckaert R, Heled J, Denise K, et al. BEAST 2: a software platform for Bayesian evolutionary analysis. PLoS Comput Biol. 2014;10(4):e1003537. doi: 10.1371/journal.pcbi.1003537. [DOI] [PMC free article] [PubMed] [Google Scholar]
- 44.Wang WM. On the origin and development of Artemisia (Asteraceae) in the geological past. Bot J Linn Soc. 2004;145(3):331–336. [Google Scholar]
- 45.Rambaut A, Drummond AJ, Xie D, et al. Posterior Summarization in Bayesian Phylogenetics Using Tracer 1.7. Syst Biol. 2018;67(5):901–904. doi: 10.1093/sysbio/syy032. [DOI] [PMC free article] [PubMed] [Google Scholar]
Associated Data
This section collects any data citations, data availability statements, or supplementary materials included in this article.
Supplementary Materials
Additional file 1: Figure S1. Alignment of whole choloroplast genome sequences of 7 Senecioneae species. The vertical scale indicates percentage identity, ranging from 50 to 100%.
Additional file 2: Figure S2. Bayesian inference (BI) phylogenetic tree obtained for 16 Senecioneae species based on the whole chloroplast genome sequences. Unlabeled nodes have bootsrap values of 100%.
Additional file 3: Figure S3. The Pi value (nucleotide diversity) of chloroplast genome sequences between four Gynura species and five Ligularia species.
Data Availability Statement
All the data and materials are available from the corresponding authors upon request. The raw sequence data was uploaded to NCBI SRA database and the unique identifier is BioProject: PRJNA577235.


