Figure 3.
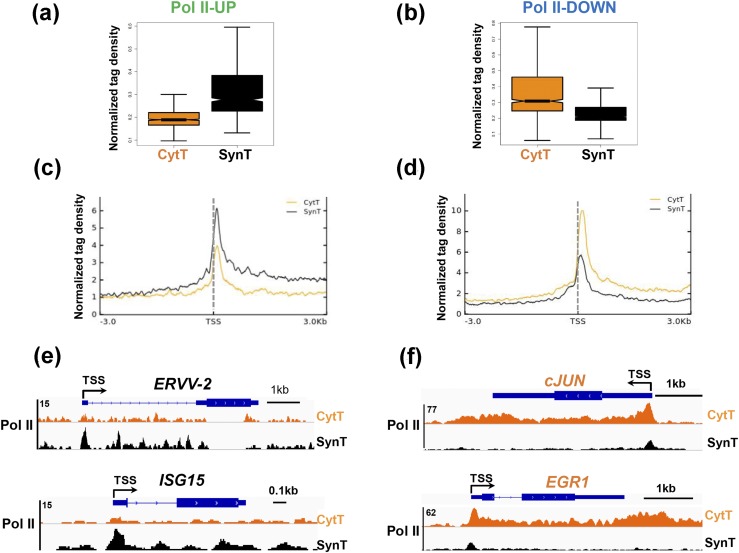
Genome-wide changes in Pol II binding occur at the TSS and gene body during SynT differentiation. Box plots of Pol II density at genes that manifested (a) increased Pol II binding in SynT compared with CytT (Pol II-UP) and (b) decreased Pol II binding in SynT compared with CytT (Pol II-DOWN). Metagene analysis of Pol II distribution in (c) Pol II-UP and (d) Pol II-DOWN genes in CytT vs SynT. Genome browser views of representative (e) Pol II-UP and (f) Pol II-DOWN genes in CytT vs SynT.

