Figure 1.
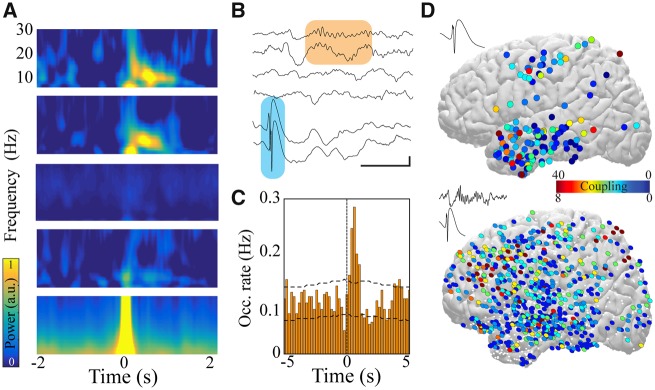
IEDs induce spindles in patients with focal epilepsy. (A) IED trigger-averaged spectrograms derived from different electrodes reveal distinct patterns of activity: coupled spindle (top two panels), no change (middle two panels), and temporally locked IED (bottom). (B) Sample raw traces of detected IEDs (shaded blue box) and coupled cortical spindles (shaded orange box). Scale bar = 1 s, 200 μV. (C) Sample cross-correlogram demonstrating significant IED-spindle coupling. IED occurrence times served as reference (time = 0, vertical dashed line) and horizontal dashed lines represent 95% confidence intervals. (D) Anatomical location of electrodes expressing IEDs that couple to spindles across all patients (top) and anatomical location of electrodes expressing spindles that are coupled to IEDs across all patients (bottom) projected onto lateral cortical surface (left hemisphere view; right hemisphere locations converted to left for display purposes). Colour represents number of significant IED-spindle coupling interactions per electrode location across patients. White dots show electrode locations that do not express IED-spindle coupling.

