Abstract
Dietary supplements (DS) are widely consumed. However, most people have limited knowledge about the safety and efficacy of DS. Even though there exists the well-curated integrated DIetary Supplement Knowledge base (iDISK) with a formal knowledge representation, it lacks a user-friendly interface for general consumers to query and retrieve DS information relevant to their needs. Following user-centered design principles, we prototyped a web application, ALOHA (i.e., dietAry suppLement knOwledge grapH visuAlization), with interactive graph-based visualization to facilitate consumers’ browsing of iDISK. We conducted a usability inspection and design session with a focus group and evaluated the usability of the prototype with a modified System Usability Scale (SUS). The SUS result was marginal (63.75 ± 7.2 with 1 outlier removed). Nevertheless, all participants agreed that such an application is urgently needed to address the gaps in how DS information (and health information in general) are currently organized and consumed online. These feedbacks are valuable to inform the next iteration of ALOHA.
Keywords: knowledge graph, user-centered design, usability testing, dietary supplement
1. Introduction
Dietary supplements (DS) are widely consumed in people’s daily life. However, most people have limited knowledge about the safety and efficacy of DS. On the other hand, the public has a growing interest in DS-related health information online. Nevertheless, the quality and accessibility of DS-related health information online are worrisome. Many studies have shown that even the best Internet search engines do not return results in the order of content quality, usefulness and trustworthiness [1]. Given how often consumers turn to online health information resources, it is important to assist them in accessing evidence-based, high-quality health information rather than those that are controversial, exaggerated, or not yet thoroughly researched.
Recently, an integrated DIetary Supplement Knowledge base (iDISK) was created with a standardized DS ontology model [2]. The current release of iDISK focuses on representing information related to DS ingredients and their potential interactions with prescription medicines that may cause serious adverse events. The iDISK integrated DS information from four reputable, high-quality scientific resources, including the Natural Medicines Comprehensive Database (NMCD), the Dietary Supplement Label Database (DSLD), the Natural Health Products Ingredients Database (NHPID), and the Licensed Natural Health Products Database (LNHPD), and uses a formal, ontology-based knowledge representation. iDISK follows the Rich Release Format (RRF)—a standard developed by the National Library of Medicine (NLM) in their Unified Medical Language System (UMLS) and can be easily integrated with other resources in UMLS. Nevertheless, there is not yet a solution for the general consumers to access the scientific knowledge in iDISK effectively with a user-friendly interface.
On the other hand, visualization is an effective commonly used approach in presenting a large amount of information and stimulating visual thinking. A well-designed interactive visualization system can facilitate understanding of the information [3]. Our priori work on visualizing social networks has shown efficacy in helping people explore, perceive, and reason about graph-structured data [4]. Ontologically-structured knowledge in iDISK can be naturally visualized as networks. We believe that interactive visualizations of semantic search results could be more effective in helping users query iDISK to find and understand DS and relevant safety information.
This paper describes a full implementation circle of our effort following user-centered design (UCD) principles to prototype a web application, ALOHA (i.e., dietAry suppLement knOwledge grapH visuAlization), with interactive graph-based visualizations to facilitate browsing of iDISK.
II. Methods
A. Data Sources
The iDISK was created as a standardized source of DS and DS relevant safety information (especially drug-supplement interactions, DSIs) to assist clinicians, researchers, and consumers make informed decisions about the use of DS. The data in iDISK are ontologically-structured and consist of three main parts: DS related concepts, relations among these concepts, and the attributes of these concepts and relations.
iDISK focuses on individual DS ingredients and their relationships with 5 other concept categories: 1) the pharmacological drugs that the DS ingredients interact with, 2) the diseases that the DS ingredients have effects on, 3) the therapeutic classes of the DS ingredients, 4) the system organs that the DS ingredients can adversely affect; and 5) the DS products that contains these DS ingredients.
B. Implementation of ALOHA Using User-Centered Design Principles
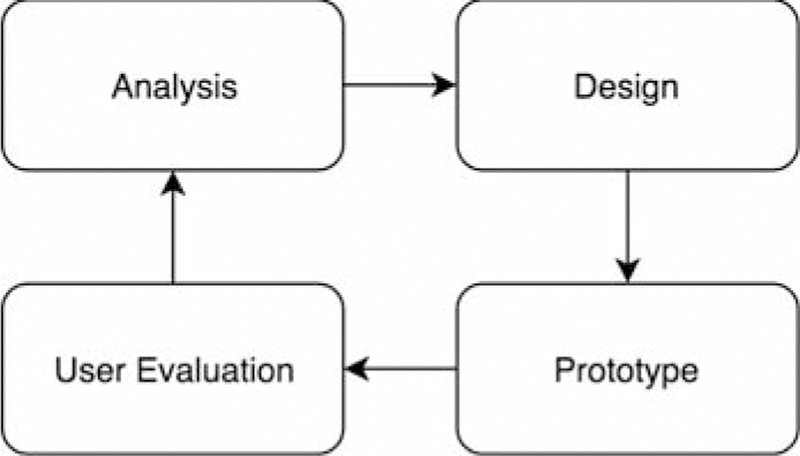
The goal of ALOHA is to facilitate the target users of iDISK to seek information, especially safety information, related to DS ingredients. As shown in Fig. 1, our design and implementation process of ALOHA are divided into 4 steps following UCD principles: 1) analysis of the needs and requirements of the intended end-users; 2) a prototype design of ALOHA with the required functionalities and related visualizations; 3) the development of a working prototype; and 4) usability assessments and collection of user feedback. These four steps: analysis, design, prototype, and user evaluation, should be conducted iteratively.
Fig. 1.

An iterative user-centered design process for developing ALOHA.
1). Analysis of the needs and requirements.
Through three difference sources: 1) discussions with DS experts and clinicians, 2) a literature review on DS and DS safety information, and 3) online health information sites (e.g., WebMD), we collected a list of questions that the intended end users would have related to DS and identified the most frequent ones that ALOHA should provide answers to. We also attempted to identify the different contexts where the potential users may use the ALOHA (e.g., questions on the safety of a particular product or looking for DS products for specific diseases or conditions). Based on these qualititative analyses, we identified an initial list of the intended end-users’ needs and requirements. In subsequent design iterations, we shall update the needs and requirements according to the usability assessments and users’ feedback.
2). Design.
Based on the needs and requirements, we sketched the initial functionalities desired by the intended end-users and developed the funtional requirements. We also researched the different visualization techniques in presenting ontologically-structured data and determiend that graph-/network-based visualizations are widely used and proven useful.
3). Prototype.
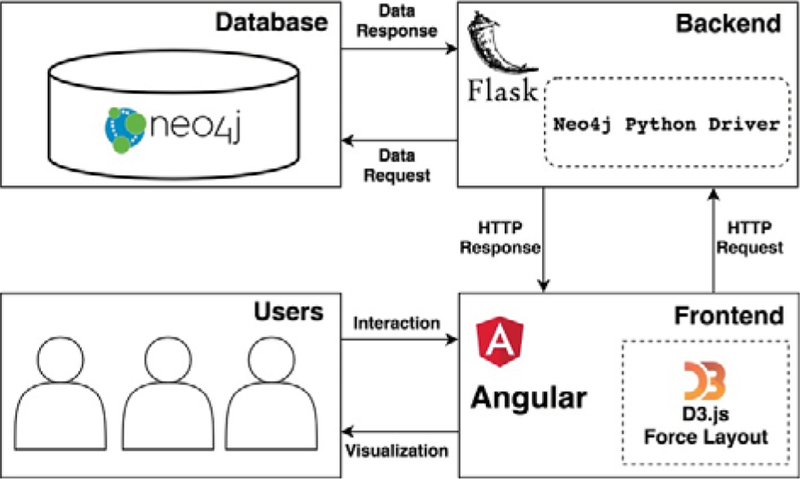
We implemented a prototype of ALOHA followed the blueprint developed in the design phase. As depicted in Fig. 2, the ALOHA prototype consists of three parts: (a) a Neo4j graph database that can store ontologically-structured knowledge and execute semantic queries, (b) a Python-Flask-based backend to provide Representational State Transfer-ful (RESTful) application programing interfaces (APIs), and (c) a web frontend built with the popular Angular Javascript framework with d3.js-powered visualizations.
Fig. 2.
The application architecture of ALOHA.
4). User evaluation and usability assessments.
We evaluated the usability of ALOHA with a focus group of 9 participants recruited from a convenience sample (i.e., students in the University of Florida). The focus group session included 6 segments: (a) an introduction to the purpose of this study and background information about the project; (b) an introduction to the basic functionalities of ALOHA; 3) participant exploration of the prototype; 4) usability assessment using a modified System Usability Scale (SUS) [5]; 5) open-ended questions to stimulate user thinking; and 6) open discussions to collect user experince and suggestions for improvements.
C. Analysis of the Usability Assessment Focus Group Data
We applied both quantitative and qualitative methods to analyze the data collected from the focus group. First, we used SUS—a simple, 10-item Likert scale, providing a quick view of the usability of the system. The original SUS questions were worded to assess system usability such as “I think that I would like to use this system frequently.” To make it more appropriate for evaluating ALHOA, we simply replaced the word “system” with “website”, e.g., “I think that I would like to use this website frequently.” The result of the SUS questionnaire is a single score, ranging from 0 to 100, with a SUS score above 80 being described as ‘Excellent’ usability.
Second, we posed four open-ended questions to stimulate participants’ thinking: 1) “What other functions should be added to the website?”; 2) “Do you have any ideas or advice for this visualization?”; 3) “List the most negative aspect(s)”; and 4) “List the most positive aspect(s).”
At last, we prompted the participants to “think-aloud” and verbalize their experience interacting with ALOHA [6]. Participants were also encouraged to discuss other related topics, such as their perceptions and attitudes towards using a system like ALOHA. The focus group session was recorded with participants’ consent, and the recording was transcribed.
We then reviewed the transcript, identified and categorized the usability issues discussed in the focus group by themes and heuristics. A two-step qualitative usability analysis was conducted. First, by analyzing data collected through the open-ended question questionnaire, an initial list of usability issues was cataloged. Second, we analyzed the transcript text and more usability issues were extracted. All of the usability issues were coded using themes that were derived by thematic analysis and mapped to usability heuristics described in Gerhardt-Powals’ cognitive engineering principles to note any violations of usability principles [7]. The usability heuristics contains 10 principles: 1) automating unwanted workload; 2) reducing uncertainty; 3) fusing data; 4) presenting new information with meaningful aids to interpretation; 5) using names that are conceptually related to function; 6) grouping data in consistently meaningful ways; 7) limiting data-driven tasks; 8) including in the displays only that information needed by the user at a given time; 9) providing multiple coding of data when appropriate; and 10) practicing judicious redundancy [7].
Suggested usability improvements were also extracted from the open-ended question questionnaire and the voice recording transcribed text.
III. Results
A. A Prototype of ALOHA
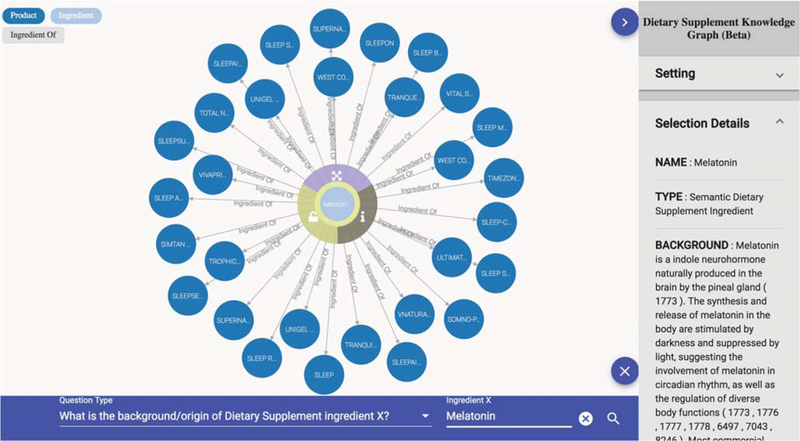
Fig. 3 shows the prototype interface of ALOHA consists of three parts: 1) a bottom bar for users to enter DS questions of their interests, 2) a canvas for graph-based interactive visualization, and 3) a sidebar for detailed text information.
Fig. 3.
A prototype interface of ALOHA.
1). Consumer questions.
Through our initial analysis of user needs, we identified 7 question templates that consumers of DS are interested in. These questions are:
What is/are available product(s) containing DS ingredient X?
To which ingredient category does DS ingredient X belong?
Which LanguaL type does DS product with ingredient X belong to?
What is the background/origin of DS ingredient X
What are the common uses of DS ingredient X?
What is/are the common adverse effect(s) associated with DS ingredient X?
With what medications does DS ingredient X could interact with?
As the questions are all focused on the relationships between a DS “ingredient X”, the bottom bar consists of 2 parts. As shown in Fig.3, in the “Question Type” part (the left part of the bottom bar), the user could choose one of the seven question templates she is interested in; and then enter the name of the ingredient in the “Ingredient X” part (the right column of the bottom bar). There is an autocomplete function so the user does not need to enter the full name of the ingredient.
2). Graph-based visualization.
As shown in Fig. 3, based on the user question, the system will pose semantic queries against the underlying iDISK using neo4j’s Cypher query language. Neo4j uses a property graph model (PGM) where data is organized as nodes, relationships, and properties. Ontologically-structured data in iDISK can be naturally expressed in a PGM. The Cypher is a declarative graph query langauge similar to Structured Query Language (SQL) for relational databases but optimized for graphs. Neo4j’s query engine also supports semantic queries with reasoning needs (i.e., levarging the knowledge encoded in the ontoloy).
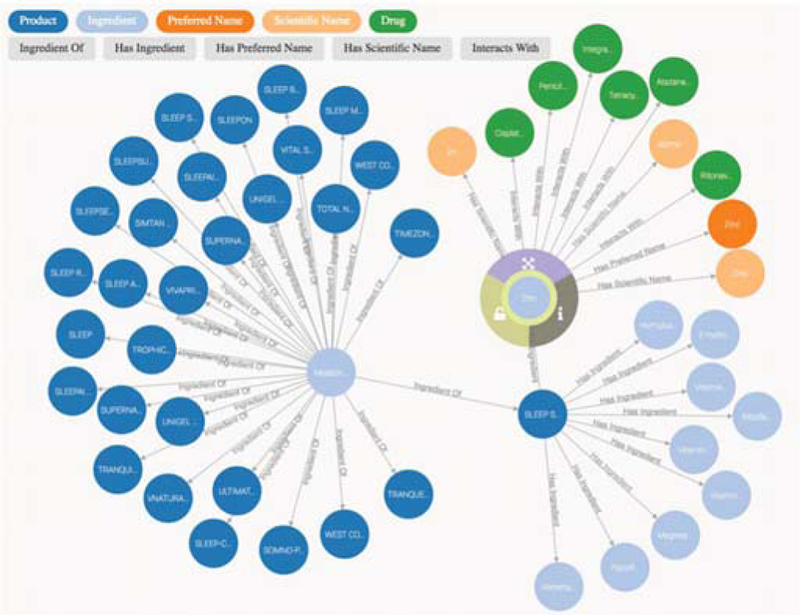
The query results (in responding to the specific user question) are then organized as a knowledge graph (i.e., nodes of concepts connected by edges indicating the relationships between nodes). A number of convenient functions were built to help users interact with and explore the knowledge graph. For example, as shown in Fig. 4, when a user double clicks on a concept node, the system will expand the node and show the subgraph with all other related nodes and the relationships. Each node is color-coded based on its concept category. For example, prescription drugs that might interact with the specific DS ingredient is colored in green, while the products that contain the specific DS ingredient are colored in dark blue.
Fig. 4.
An example of expanding a node in ALOHA
3). Text information in the sidebar
When a concept node is selected, more information such as the background and safety informatio about the DS ingredient is shown in the sidebar on the right side of the canvas.
B. Usablity Assessment And Focus Group Results
1). System Usability Scale (SUS) score:
The SUS is a validated instrument indicating the overall usability of the system, where a score of 0 to 50 was not acceptable, a score of 50 to 70 was marginal, and a score of 70 to 100 was acceptable. The SUS scores obtained from the focus group ranged between 7.5 to 70. 7 of the 9 participants rated our prototype as ‘marginal’, while the other 2 participants rated the prototype as ‘not acceptable’. 1 of the 9 participants rated the system 7.5 (outside of the 3 standard deviations); thus, we considered this participant as an outliner. The average SUS score of the rest 8 participants was marginal (63.75 ± 7.2). This result indicated that participants had varying experience in using the prototype; and the marginal SUS score suggested that the prototype is useful although its usability suboptimal.
2). Usability issues:
All of the usability issues (30) reported by the participants were coded by seven themes through thematic analysis. These usability themes were derived based on the characteristics of the identified usability issues. Similar issues reported by different participants were grouped as a single unique issue type. This process reduced the 30 issues to 23 distinct issues. The seven usability themes revealed were a) lack of functionality (8/23), b) unnecessary information (5/23), c) incomplete functionality (3/23), d) unclear information presentation (3/23), e) incomplete information (2/23), f) lack of information (1/23), and g) unintuitive information (1/23).
We then mapped these usability issue to the 10 usability heuristics described in Gerhardt-Powals’ cognitive engineering principles. The top 2 usability heuristics are a) reducing uncertainty and b) including in the displays only that information needed by the user at a given time.
C. Suggested Usability Improvement
Usability improvements suggested by the participants were well aligned with the usability issues identified before. These suggested improvements included: 1) removing unnecessary information; 2) grouping similar information; 3) changing the expression of data to be easier for laypeople to consume; and 4) making texts more clear to be recognized.
IV. Discussion and Conclusion
The use of dietary supplements (e.g., vitamins, minerals, botanical extracts, and protein powders) are common in the United States and across the globe despite consumers having limited knowledge about their safety and efficacy. In this study, we developed an interactive visualization system of DS knowledge graph called ALOHA based on a well-curated knowledge base—iDISK. During the implementation of ALOHA, we followed user-centered design principles, which could lead to a more user-friendly application. Lessons learned from our initial implementation could serve as a guide for future design iteration of ALOHA and development of other knowledge graph-based applications. Through the usability inspection focus group, many usability issues were revealed with specific action points to improve the usability of ALOHA in future iterations. The UCD principles enable an iterative development process to create a user-friendly web-based applications for lay consumers to explore DS knowledge relevant to their needs.
Acknowledgment
This work was supported in part by grants UL1TR001427 and R01AT009457. The content is solely the responsibility of the authors and does not necessarily represent the official views of the NIH.
References
- [1].Eysenbach G, “How do consumers search for and appraise health information on the world wide web? Qualitative study using focus groups, usability tests, and in-depth interviews,” BMJ, vol. 324, no. 7337, pp. 573–577, Mar. 2002. [DOI] [PMC free article] [PubMed] [Google Scholar]
- [2].Zhang R, “integrated DIetary Supplement Knowledge base (iDISK).” Data Repository for the University of Minnesota (DRUM), 2018.
- [3].Meyer J, Thomas J, Diehl S, Fisher B, and Keim DA, “From Visualization to Visually Enabled Reasoning,” 2010.
- [4].Bian J et al. , “CollaborationViz: interactive visual exploration of biomedical research collaboration networks,” PloS One, vol. 9, no. 11, p. e111928, 2014. [DOI] [PMC free article] [PubMed] [Google Scholar]
- [5].Brooke J, “SUS: A Retrospective,” J Usability Stud, vol. 8, no. 2, pp. 29–40, Feb. 2013. [Google Scholar]
- [6].Jääskeläinen R, “Think-aloud protocol,” in Handbook of Translation Studies, vol. 1, Gambier Y and van Doorslaer L, Eds. Amsterdam: John Benjamins Publishing Company, 2010, pp. 371–373. [Google Scholar]
- [7].Gerhardt-Powals J, “Cognitive Engineering Principles for Enhancing Human-computer Performance,” Int J Hum-Comput Interact, vol. 8, no. 2, pp. 189–211, Apr. 1996. [Google Scholar]


