In patients with relapsed and/or refractory multiple myeloma (MM), it is difficult to predict which new line of therapy will be effective. Usually, classes of drugs are rotated and each patient will try the different options available. An in vitro prediction model might aid the selection of an effective therapy. We therefore investigated whether an in vitro bone marrow (BM) myeloma model, based on a three-dimensional (3D) hydrogel culture of multipotent mesenchymal stromal cells, endothelial progenitor cells and myeloma cells, is capable of predicting clinical responses to various classes of drugs. CD138+ myeloma cells derived from relapsed/refractory MM patients were cultured in the model. Two dosages of various proteasome inhibitors, immunomodulatory drugs, and alkylating agents were tested for drug sensitivity and resistance. The treatment responses observed in vitro were compared to the clinical treatment responses. High agreement and predictive values were found for responses to alkylating agents and proteasome inhibitors, but not for immunomodulatory drugs. These results indicate that preclinical screening models, mimicking basic cellular interactions and currently lacking immune cells, cannot be considered as universal tools for the screening of all treatments. When using 3D in vitro models for preclinical screening of therapies, the mechanisms of action of the drugs being tested and the mimicry of these mechanisms in vitro need to be taken into account.
MM, characterized by neoplastic transformation of terminally differentiated plasma cells in the BM, remains an incurable disease. Even though treatment outcomes of MM have improved over the past decade,1 the majority of MM patients will still experience multiple disease relapses that require additional therapy.2 Various treatment options exist; however, the efficacy of each treatment decreases with every new treatment line.3 Therefore, there is a need to determine the optimal treatment option after each relapse on an individual basis, avoiding switching from one suboptimal treatment to potentially another.
3D in vitro models offer the possibility of culturing myeloma cells in a human system that resembles the BM environment closely. Different types of human BM cells can be included, as well as myeloma cells derived from patients. This provides the possibility of creating disease models that can be used for drug screening in a personalized setting.4 Several research groups have developed models to culture primary myeloma cells in a 3D environment mimicking the human BM, and have used these models to study responses to chemotherapeutic agents.5–11 However, these previous studies did not determine whether the models were capable of predicting clinical treatment outcomes, or whether the prediction of treatment outcomes varied depending on the mechanisms of action of the cytotoxic agents investigated.12,13
The aim of this study was to investigate an in vitro 3D BM myeloma model as a platform for predicting clinical response to various classes of drugs used as treatments for individual patients with relapsed/refractory MM. The BM myeloma model, which enables the outgrowth of primary CD138+ myeloma cells,8 has been shown to support a genetically stable, viable population of myeloma cells over the course of weeks, as well as the analysis of treatment effects induced by cytotoxic agents.11 The model, combined with confocal imaging, provides the possibility of quantifying the sensitivity and resistance of myeloma cells to drugs, within the context of the engineered BM environment. In this study, various treatments were tested in vitro and compared to the clinical outcomes of relapsed/refractory MM patients when given the same treatments. The predictive value of the model was analyzed, using multiple outcome measures such as agreement and predictive values, stratifying between classes of drugs with different direct or indirect mechanisms of action (alkylating agents and proteasome inhibitors vs. immunomodulatory drugs).
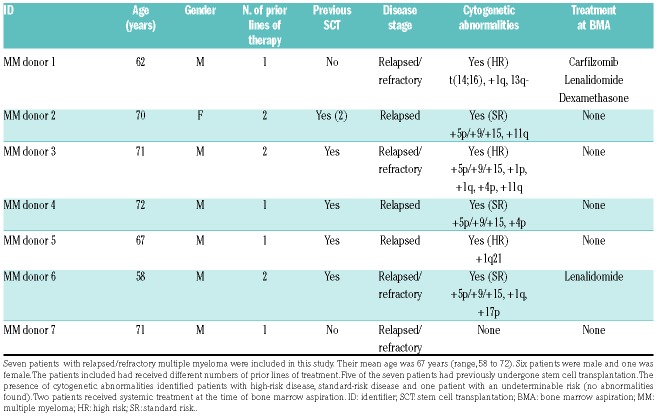
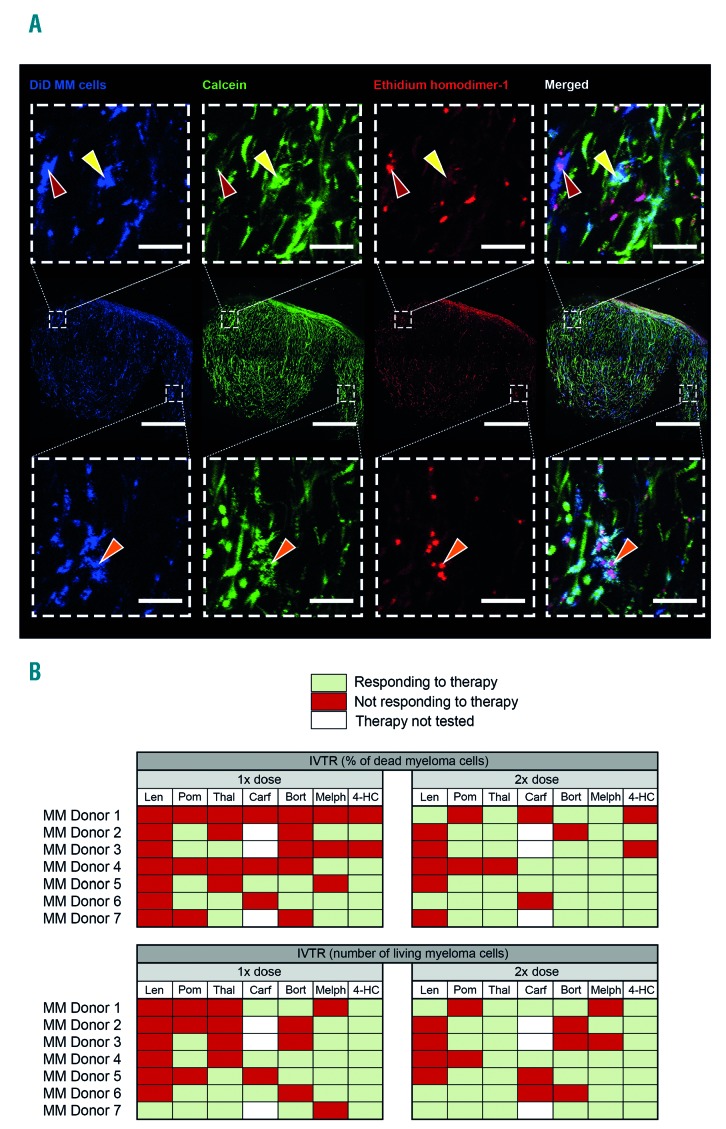
The readouts used in this study were optimized using cell lines (OPM2 and L363) (Online Supplementary Figure S1), before studying the primary MM cells from seven patients with relapsed/refractory MM. The patients included in this study had a mean age of 67 years. A heterogeneous cytogenetic profile was observed: three patients could be defined as having a high-risk profile. The number of treatments that each patient had received before the in vitro treatment testing varied (Table 1). CD138+ cells were isolated from each patient from a BM aspirate: the selected CD138+ myeloma cells were labeled before culture, so that these cells could be tracked over time. Live myeloma cells could be distinguished from dying/dead myeloma cells using live confocal imaging (Figure 2A). Based on this distinction, the responses of each donor to the given therapies were analyzed. The in vitro treatment responses were analyzed using different readout parameters (percentage of dead myeloma cells and number of live myeloma cells), which resulted in different outcomes (Figure 2B).
Table 1.
Patients’ demographics at the time of the bone marrow aspiration.
Figure 2.
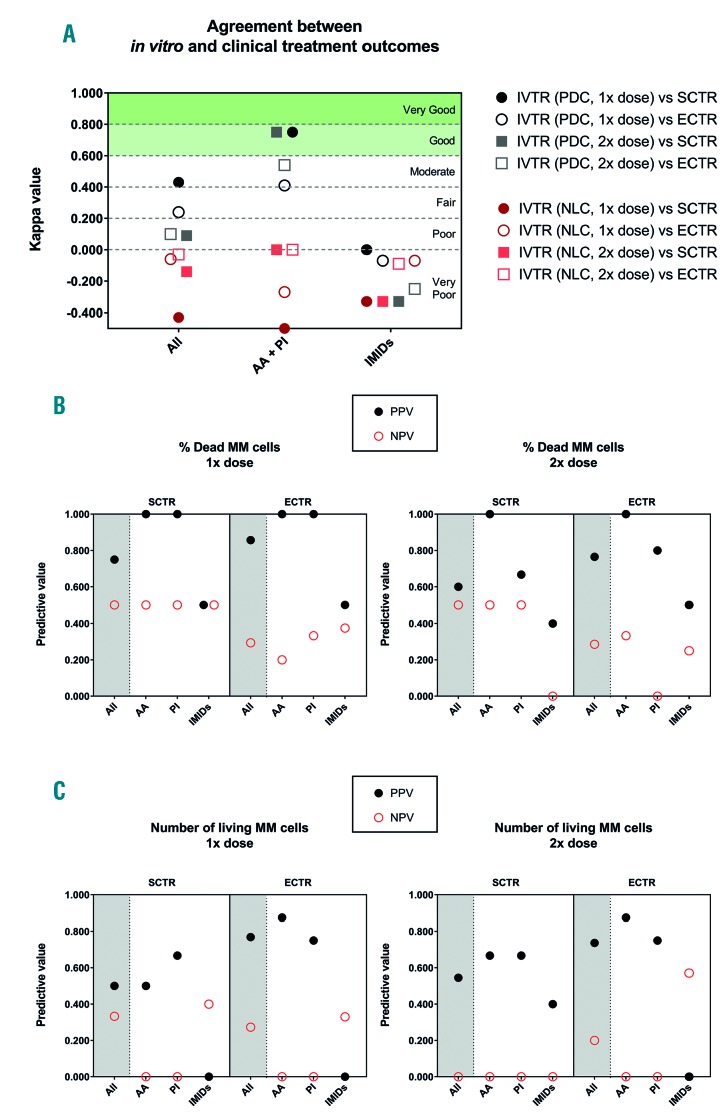
κ and predictive values of the in vitro bone marrow multiple myeloma model for clinical treatment responses. The values depicted were analyzed for all treatments (all), or the treatments split into two groups: treatments with direct mechanisms of action (alkylating agents and proteasome inhibitors) and treatments with indirect mechanisms of action (immunomodulatory drugs). (A) κ values indicating the degree of agreement between in vitro treatment responses and clinical treatment responses (strict and extended). (B) The percentage of dead myeloma cells after treatment with a single (1x) or double (2x) dose was correlated to the strict and extended clinical treatment responses. The positive and negative predictive values were calculated for multiple comparisons. (C) Similar predictive values were calculated analyzing the number of live myeloma cells after treatment. AA: alkylating agents; PI: proteasome inhibitors; IMiDs: immunomodulatory drugs; IVTR: in vitro treatment responses; SCTR: strict clinical response, i.e., a clinical response immediately before or after bone marrow aspiration; ECTR: extended clinical treatment response, i.e., clinical responses ever recorded for that patient; PDC: percentage of dead myeloma cells after treatment, NLC: number of live myeloma cells after treatment; MM: multiple myeloma; PPV: positive predictive value; NPV: negative predictive value.
Figure 1.
Treatment responses of in vitro cultured primary myeloma cells using the three-dimensional bone marrow model, 72 hours after treatment addition. (A) Confocal images from multiple myeloma donor 2, representative of all donors. An overview of the co-culture (middle row, scale bar represents 600 mm) shows the cultured CD138+ myeloma cells (stained with DiD, blue), viable cells (stained with calcein, green) and dead cells (stained with ethidium homodimer-1, red). Zoomed images (top and bottom rows, scale bar represents 60 mm) show live or dead cells. Dead CD138+ myeloma cells (red arrows) can be identified by a single blue color, with co-localization of the blue and red channels for the nucleus of the cell (magenta). Live CD138+ myeloma cells (yellow arrows) can be identified by co-localization of the blue and green channels (cyan). Some cells were positive for all channels (orange arrows). These double-positive cells (cyan and magenta) were considered as dead cells. Viable supporting mesenchymal stromal cells or endothelial progenitor cells can be identified in the green channel, without a co-localizing blue signal. Dead mesenchymal stromal cells or endothelial progenitor cells were identified in the red channel, without a co-localizing blue signal. (B) Overview of the in vitro treatment responses of all donors. Either a single or double dose of treatment was given, treatment response were analyzed looking at the percentage of dead myeloma cells, or the number of live myeloma cells. IVTR: in vitro treatment responses; MM: multiple myeloma; len: lenalidomide; pom: pomalidomide; thal: thalidomide; bort: bortezomib; carf: carfilzomib; melp: melphalan; 4-HC: 4-hydroperoxy-cyclophosphamide.
The validity of the two analytic methods and the two dosages used to assess the in vitro treatment responses was analyzed by comparing each in vitro treatment response outcome set to the strict clinical treatment responses (i.e., the treatment response to the last clinical therapy before BM aspiration, and the treatment response to the therapy given immediately after BM aspiration), and the extended clinical treatment responses (the treatment responses to all clinical therapies before BM aspiration, and the treatment responses to all therapies given after the BM aspiration).
Diagnostic agreement was assessed using unweighted κ values, positive predictive values (PPV) and negative predictive values (NPV), among others (Online Supplementary Tables S1-S3). When analyzing the κ values of all the treatments given (alkylating agents, proteasome inhibitors and immunomodulatory drugs), none of the in vitro treatment responses demonstrated very good or good agreement with the clinical treatment responses (Figure 3A). When separating treatments according to whether they had direct mechanisms of action towards myeloma cells (alkylating agents, proteasome inhibitors) or both direct and indirect mechanisms of action (immunomodulatory drugs), different results were obtained. All in vitro treatment responses to immunomodulatory drugs showed very poor agreement with the clinical treatment responses, ranging from κ = 0.00 to κ =-0.50. Correspondingly low PPV and NPV were found, regardless of the method of analysis, with these values ranging from 0.57 to 0.00 (Figure 3B, C).
Opposite results were found when analyzing the effects of treatment with alkylating agents and proteasome inhibitors. For these classes of drugs, the analysis of the percentage of dead myeloma cells showed good agreement with the strict clinical treatment responses, when the treatment was with either a single or double dose (κ = 0.75). Correspondingly high PPV and NPV were found, ranging from 1.00 to 0.80. When including additional clinical treatment responses that did not occur immediately before or after BM aspiration (i.e., extended clinical treatment responses), a moderate agreement was found (κ = 0.41 and κ = 0.54, for the single and double dose, respectively). In correspondence, lower PPV and NPV were found, ranging from 1.00 to 0.44.
The investigated BM myeloma model offers the possibility of culturing primary myeloma cells in an engineered BM environment, thereby taking into account the BM-induced resistance of myeloma cells to therapy. However, one problem after determining the effects of drugs in the model is translation of the in vitro treatment responses into clinical treatment responses. Furthermore, there is a lack of knowledge about the drug dosages to which resident myeloma cells are subjected to in vivo on a cellular level. The in vitro treatment dosages used in this study were chosen based on known dose responses in both two-and three-dimensional cultures,6 and not on dosages known to be clinically relevant. In addition, there are various ways to analyze the in vitro results, using information on either the percentage of dead myeloma cells or the amount of surviving myeloma cells. In our study, the analysis of the percentage of dead myeloma cells in vitro, after treatment with alkylating agents and proteasome inhibitors, showed the best agreement with the strict clinical treatment responses, with correspondingly high predictive values. This suggests that in our model, the actual killing of myeloma cells is a better predictor of clinical treatment responses than the amount of live myeloma cells remaining, which also takes into account affected proliferation rates. It is, however, important to note that all the data were collected from a small group of seven patients with refractory/relapsed MM. Additional research is needed, including a larger group of refractory/relapsed MM patients with varying backgrounds, in order to validate the in vitro BM myeloma model as a preclinical tool for predicting treatment responses.
Immunomodulatory drugs, thalidomide and its analogs, are known to have various indirect cytotoxic mechanisms of action. Thalidomide displays little activity in cytotoxicity assays, in contrast to both lenalidomide and pomalidomide which also induce myeloma cell death directly. Furthermore, immunomodulatory drugs have a significant effect on the BM microenvironment and its supportive properties towards myeloma cells, inhibiting interactions between MM and mesenchymal stromal cells and the production of cytokines. Multiple other indirect effects contribute to myeloma cell death as well, including the co-stimulation of T cells, increased and enhanced activity of both natural killer and natural killer T cells, and both anti-angiogenic and anti-inflammatory effects.14,15 These indirect mechanisms of action are currently not reproduced in vitro, making these models potentially inadequate as a tool for predicting the clinical effectiveness of therapies. This was confirmed in the in vitro BM myeloma model investigated in this study, which showed a very poor agreement between in vitro treatment responses to immunomodulatory drugs (regardless of the method of analysis and dosage used) and subsequent clinical treatment responses. The addition of immune system components to this in vitro BM myeloma model could potentially increase its predictive value for immunomodulatory drugs in the future.
Acknowledgments
The authors thank Willem Paul Gielis for his advice on the statistical methods used in this study.
Footnotes
Funding: this study was funded by Fonds Stimulans, Celgene and the Dutch Arthritis Foundation.
Information on authorship, contributions, and financial & other disclosures was provided by the authors and is available with the online version of this article at www.haematologica.org.
References
- 1.Kumar SK, Rajkumar V, Kyle RA, et al. Multiple myeloma. Nat Rev Dis Primers. 2017;3:17046. [DOI] [PubMed] [Google Scholar]
- 2.Sonneveld P, Broijl A. Treatment of relapsed and refractory multiple myeloma. Haematologica. 2016;101(8):995. [DOI] [PMC free article] [PubMed] [Google Scholar]
- 3.Yong K, Delforge M, Driessen C, et al. Multiple myeloma: patient outcomes in real-world practice. Br J Haematol. 2016;175(2):252–264. [DOI] [PMC free article] [PubMed] [Google Scholar]
- 4.Kimlin L, Kassis J, Virador V. 3D in vitro tissue models and their potential for drug screening. Expert Opin Drug Discov. 2013; 8(12):1455–1466. [DOI] [PubMed] [Google Scholar]
- 5.de la Puente P, Muz B, Gilson RC, et al. 3D tissue-engineered bone marrow as a novel model to study pathophysiology and drug resistance in multiple myeloma. Biomaterials. 2015;73:70–84. [DOI] [PMC free article] [PubMed] [Google Scholar]
- 6.Jakubikova J, Cholujova D, Hideshima T, et al. A novel 3D mesenchymal stem cell model of the multiple myeloma bone marrow niche: biologic and clinical applications. Oncotarget. 2016; 7(47):77326–77341. [DOI] [PMC free article] [PubMed] [Google Scholar]
- 7.Belloni D, Heltai S, Ponzoni M, et al. Modeling multiple myeloma-bone marrow interactions and response to drugs in a 3D surrogate microenvironment. Haematologica. 2018;103(4):707–716. [DOI] [PMC free article] [PubMed] [Google Scholar]
- 8.Braham MVJ, Minnema MC, Aarts T, et al. Cellular immunotherapy on primary multiple myeloma expanded in a 3D bone marrow niche model. Oncoimmunology. 2018;7(6):e1434465. [DOI] [PMC free article] [PubMed] [Google Scholar]
- 9.Reagan MR, Mishima Y, Glavey SV, et al. Investigating osteogenic differentiation in multiple myeloma using a novel 3D bone marrow niche model. Blood. 2014;124(22):3250–3259. [DOI] [PMC free article] [PubMed] [Google Scholar]
- 10.Kirshner J, Thulien KJ, Martin LD, et al. A unique three-dimensional model for evaluating the impact of therapy on multiple myeloma. Blood. 2008;112(7):2935–2945. [DOI] [PubMed] [Google Scholar]
- 11.Braham MVJ, Deshantri AK, Minnema MC, et al. Liposomal drug delivery in an in vitro 3D bone marrow model for multiple myeloma. Int J Nanomedicine. 2018;13:8105–8118. [DOI] [PMC free article] [PubMed] [Google Scholar]
- 12.Majumder MM, Silvennoinen R, Anttila P, et al. Identification of precision treatment strategies for relapsed/refractory multiple myeloma by functional drug sensitivity testing. Oncotarget. 2017;8(34):56338–56350. [DOI] [PMC free article] [PubMed] [Google Scholar]
- 13.Silva A, Silva MC, Sudalagunta P, et al. An ex vivo platform for the prediction of clinical response in multiple myeloma. Cancer Res. 2017;77(12):3336–3351. [DOI] [PMC free article] [PubMed] [Google Scholar]
- 14.Quach H, Ritchie D, Stewart AK, et al. Mechanism of action of immunomodulatory drugs (IMiDS) in multiple myeloma. Leukemia. 2010;24(1):22–32. [DOI] [PMC free article] [PubMed] [Google Scholar]
- 15.Holstein SA, McCarthy PL. Immunomodulatory drugs in multiple myeloma: mechanisms of action and clinical experience. Drugs. 2017;77(5):505–520. [DOI] [PMC free article] [PubMed] [Google Scholar]


